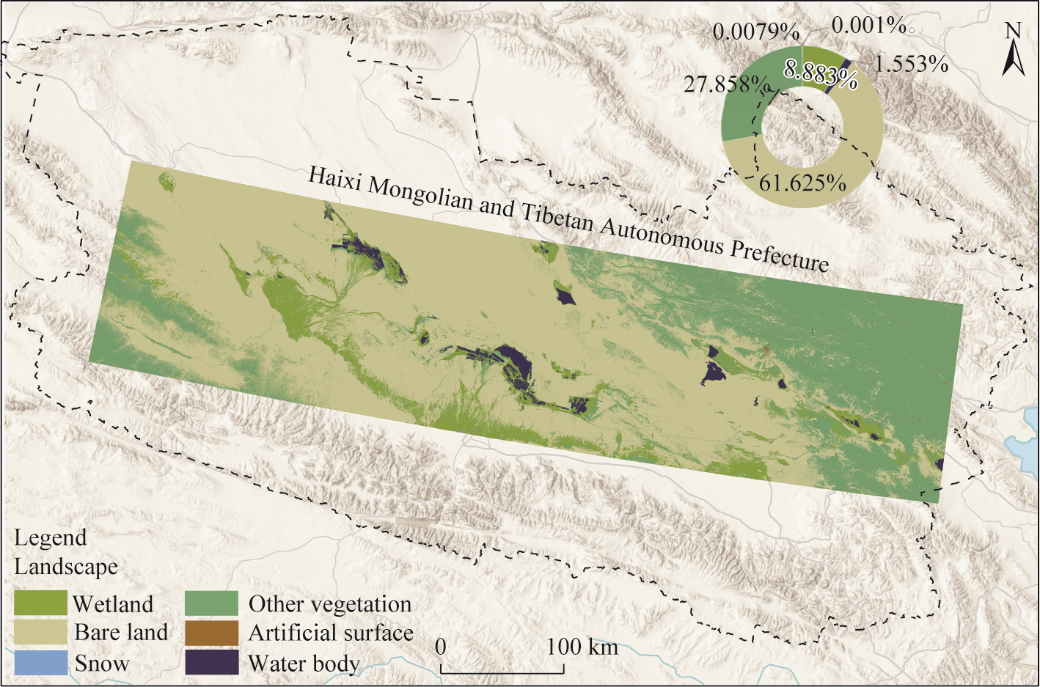
| Landscape | Sampling sites | Source | Cartographic Accuracy |
|---|---|---|---|
| Wetland | 83 (66) | Field survey & Google Earth point | 88.451% |
| Water body | 92 | Google Earth point | 92.607% |
| Bare land | 83 | Google Earth point | 87.923% |
| Other vegetation | 76 | Google Earth point | 83.411% |
| Artificial surface | 84 | Google Earth point | 85.655% |
| Snow | 57 | Google Earth point | 80.127% |
Fig. 8 Analysis of drivers for wetland vegetation characteristics in the Qaidam Basin using PLS-PM. (a), the loading value of each explanatory variable; (b), the direct and indirect effects of environmental variables on wetland ecosystems from the PLS-PM. AVE, average variance extracted; MAP, mean annual precipitation; MAT, mean annual temperature; PET, potential evapotranspiration. GOF, Goodness-of-Fit. **, significance at P<0.05 level; ***, significance at P<0.01 level. Solid lines indicate significant relationships; and blue and red dashed lines indicate negative and positive insignificant relationships, respectively. The thickness of the line represents the strength of the causal relationship, supplemented by a standardized path coefficient.
Fig. 6 Comparative analysis of wetland vegetation community characteristics under different connectivity gradients. (a), fractional vegetation coverage (FVC); (b), Simpson's Dominance Index; (c), Pielou's Evenness Index; (d) Shannon-Wiener Diversity Index. The upper and lower boundaries of the box indicate the 25th and 75th percentiles, respectively; the bar is the standard deviation (SD); the horizontal line within each box indicates the median value; and the black line connects the mean values across analysis units; the symbol "×" indicates that only one species was recorded at that sampling site; and the point indicates the data of each sampling site. ns, non-significance; ***, significance at P<0.01 level.
Fig. 7 Characteristics of wetland vegetation pattern indices under different connectivity gradients. (a), class area (CA); (b), largest patch index (LPI); (c), area-weighted mean patch size (AREA_AM); (d), mean shape index (SHAPE_MN); (e), patch density (PD); (f), perimeter-area fractal dimension (PAFRAC); (g), mean contiguity index (CONTIG_MN); (h), mean Euclidean nearest-neighbor distance (ENN_MN); (i), aggregation index (AI).