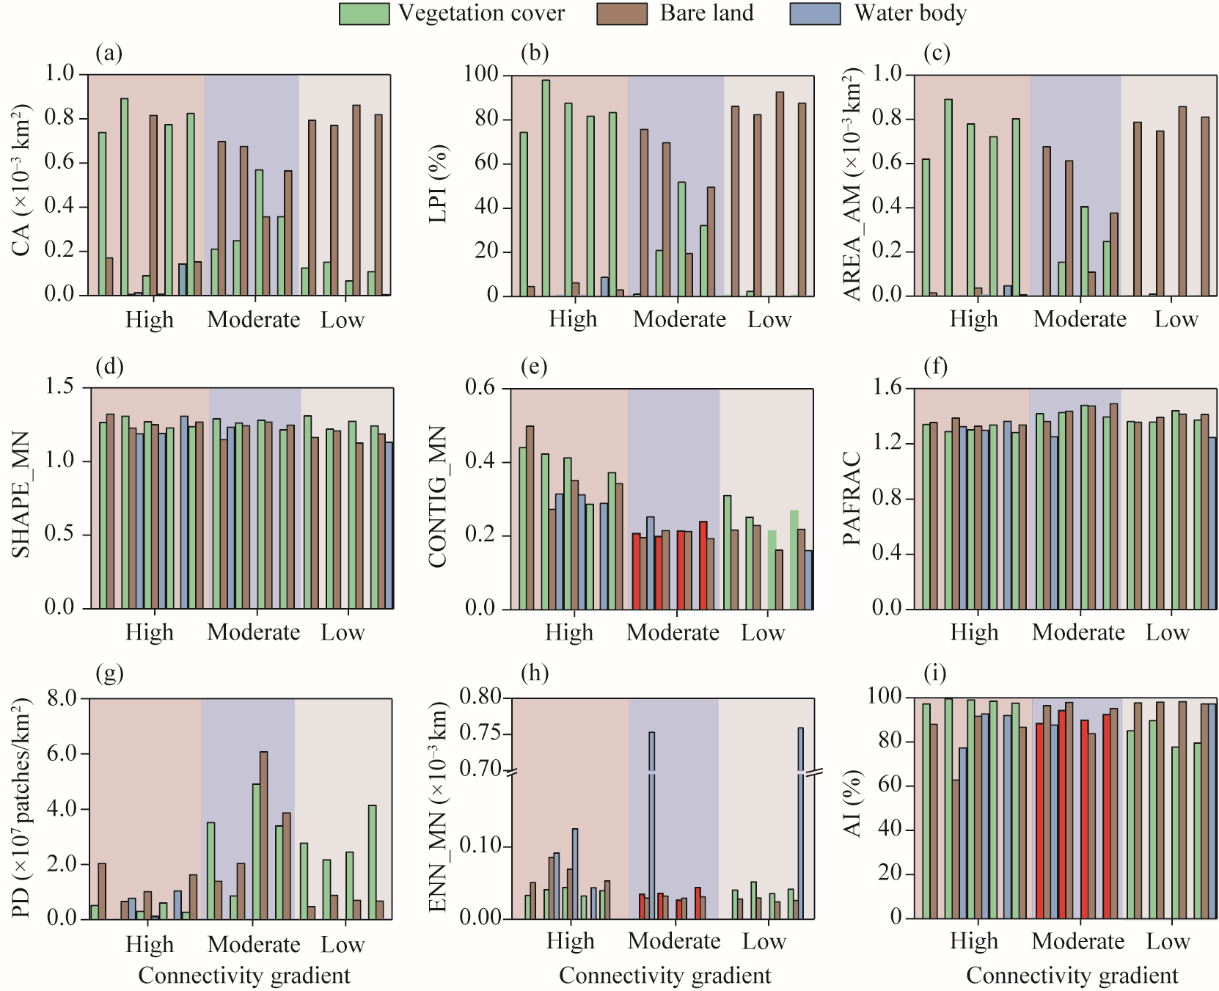
Fig. 8 Analysis of drivers for wetland vegetation characteristics in the Qaidam Basin using PLS-PM. (a), the loading value of each explanatory variable; (b), the direct and indirect effects of environmental variables on wetland ecosystems from the PLS-PM. AVE, average variance extracted; MAP, mean annual precipitation; MAT, mean annual temperature; PET, potential evapotranspiration. GOF, Goodness-of-Fit. **, significance at P<0.05 level; ***, significance at P<0.01 level. Solid lines indicate significant relationships; and blue and red dashed lines indicate negative and positive insignificant relationships, respectively. The thickness of the line represents the strength of the causal relationship, supplemented by a standardized path coefficient.
Fig. 6 Comparative analysis of wetland vegetation community characteristics under different connectivity gradients. (a), fractional vegetation coverage (FVC); (b), Simpson's Dominance Index; (c), Pielou's Evenness Index; (d) Shannon-Wiener Diversity Index. The upper and lower boundaries of the box indicate the 25th and 75th percentiles, respectively; the bar is the standard deviation (SD); the horizontal line within each box indicates the median value; and the black line connects the mean values across analysis units; the symbol "×" indicates that only one species was recorded at that sampling site; and the point indicates the data of each sampling site. ns, non-significance; ***, significance at P<0.01 level.