×
模态框(Modal)标题
在这里添加一些文本
关闭
关闭
提交更改
取消
确定并提交
×
模态框(Modal)标题
×
期刊
文章
图表
检索
EN
中文
首页
期刊介绍
编委会
投稿指南
在线期刊
当期目录
过刊浏览
推荐文章
阅读排行
下载排行
EN
中文
图/表 详细信息
Effects of wetland connectivity on plant communities and vegetation patterns in the Qaidam Basin
YUE Yifan, MA Dengke, MA Yuanyuan, KANG Wenrong, ZHOU Guoying, ZHAO Wenzhi
干旱区科学, 2026, 18(
4
): 696-714. DOI:
10.1016/j.jaridl.2026.04.008
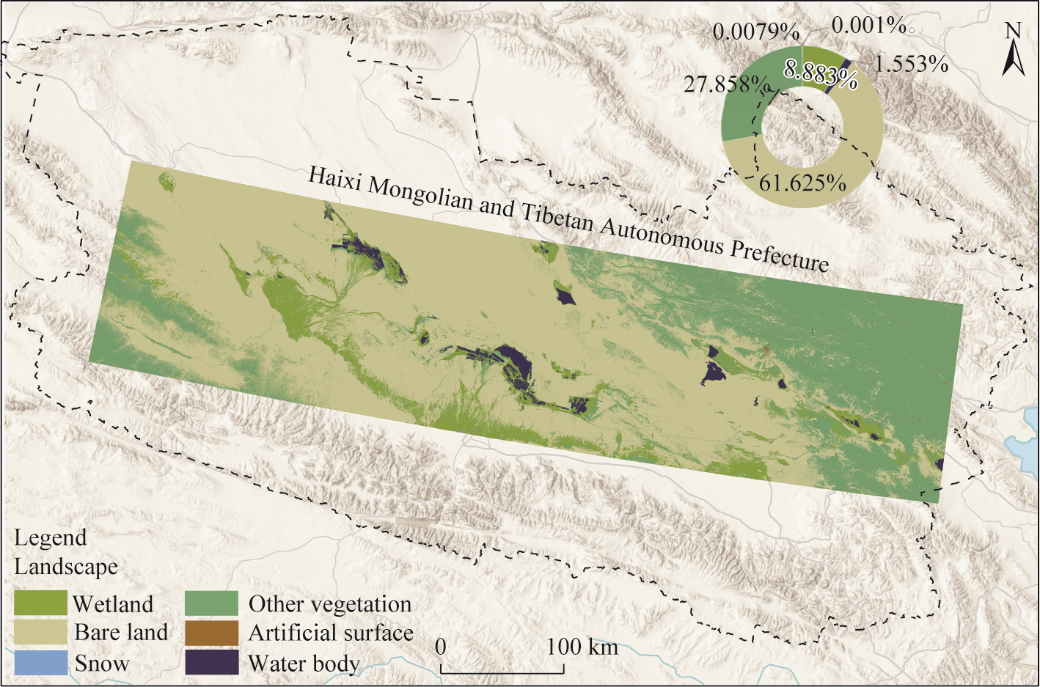
Fig. 3
Spatial distribution of different landscape
本文的其它图/表
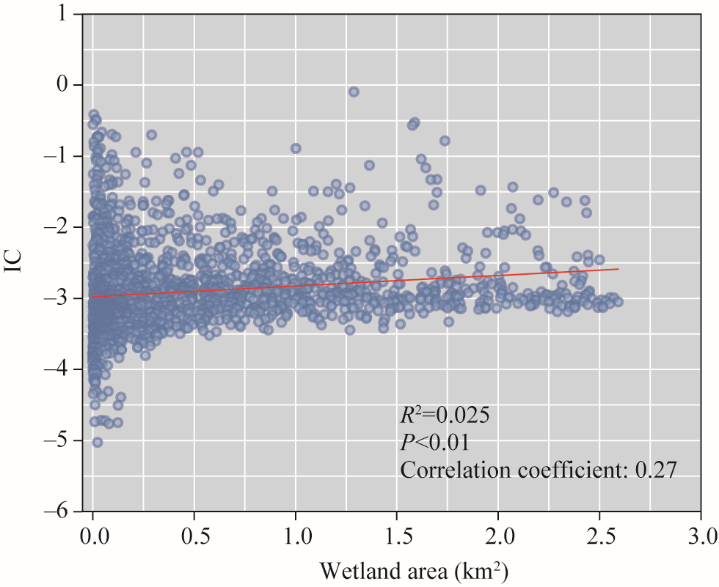
Fig. 2
Correlation analysis between the Index of Connectivity (IC) and wetland area
Fig. 8
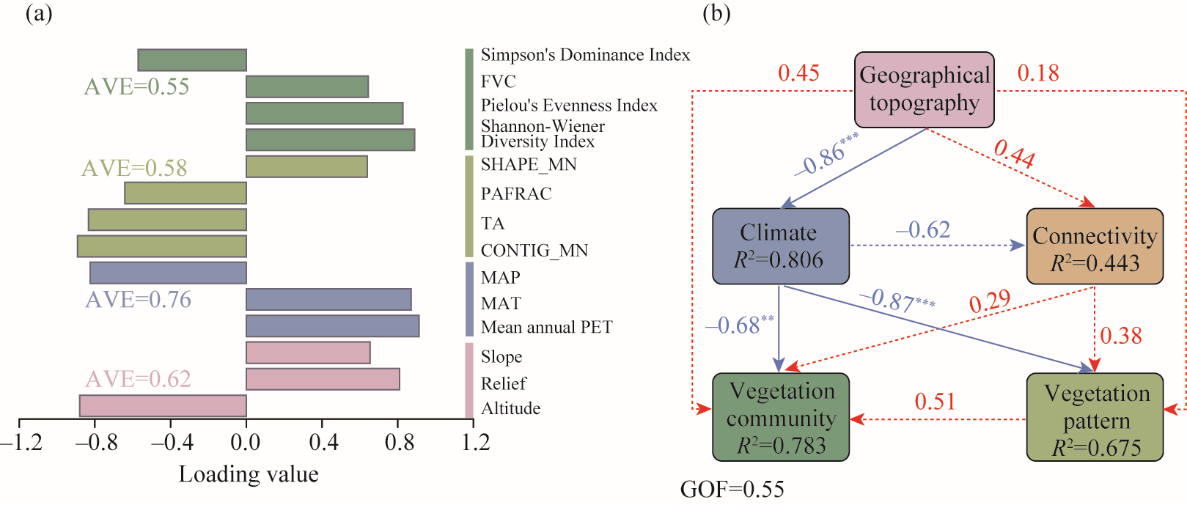
Analysis of drivers for wetland vegetation characteristics in the Qaidam Basin using PLS-PM. (a), the loading value of each explanatory variable; (b), the direct and indirect effects of environmental variables on wetland ecosystems from the PLS-PM. AVE, average variance extracted; MAP, mean annual precipitation; MAT, mean annual temperature; PET, potential evapotranspiration. GOF, Goodness-of-Fit.
**
, significance at P<0.05 level;
***
, significance at P<0.01 level. Solid lines indicate significant relationships; and blue and red dashed lines indicate negative and positive insignificant relationships, respectively. The thickness of the line represents the strength of the causal relationship, supplemented by a standardized path coefficient.
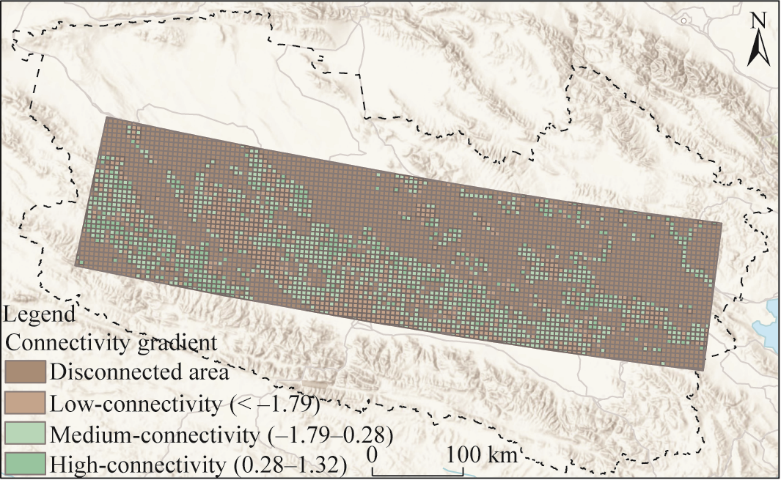
Fig. 5
Spatial pattern of different wetland connectivity gradients
Table S1
Number of validation sampling sites and cartographic accuracy for each land cover type
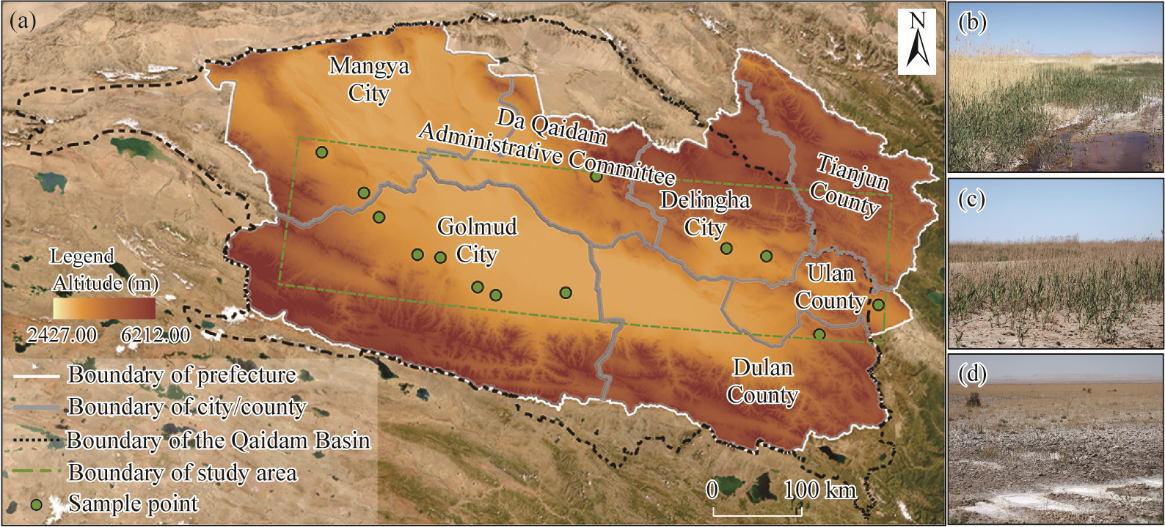
Fig. 1
Sampling site locations of the wetlands in the Qaidam Basin (a) and representative landscape photographs of high- (b), moderate- (c), and low-connectivity (d) sites.
Table 1
Sampling sites division
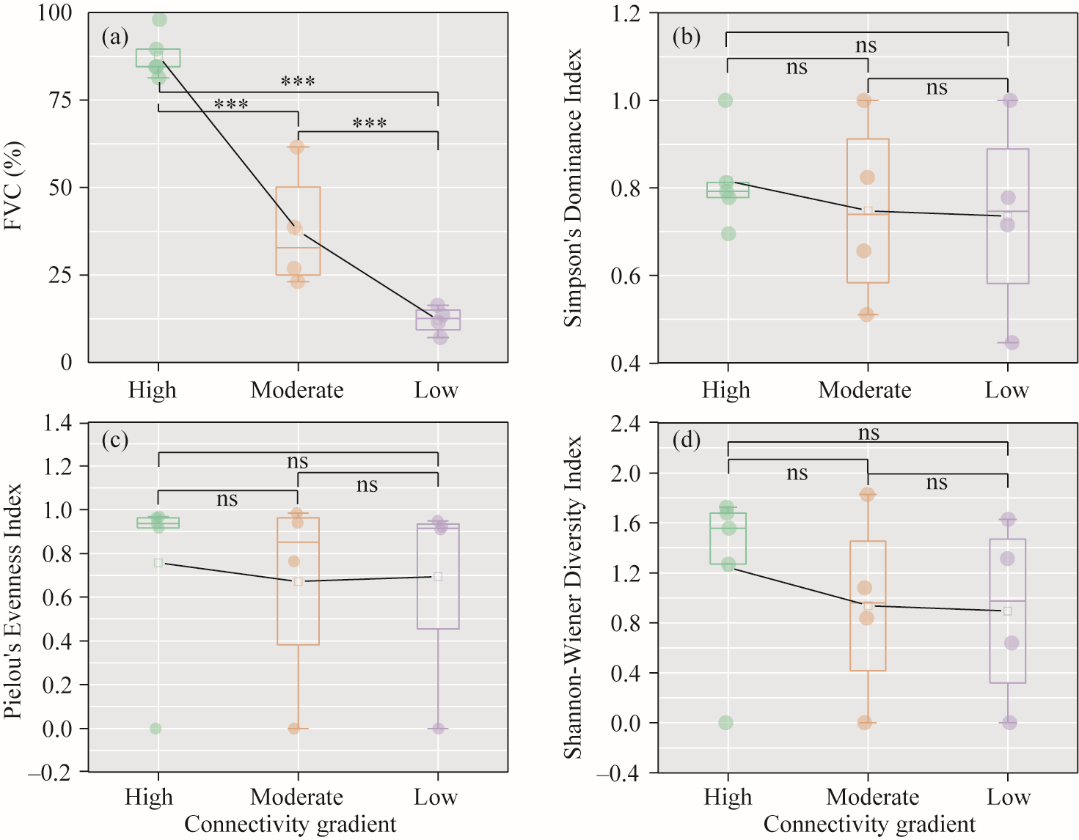
Fig. 6
Comparative analysis of wetland vegetation community characteristics under different connectivity gradients. (a), fractional vegetation coverage (FVC); (b), Simpson's Dominance Index; (c), Pielou's Evenness Index; (d) Shannon-Wiener Diversity Index. The upper and lower boundaries of the box indicate the 25
th
and 75
th
percentiles, respectively; the bar is the standard deviation (SD); the horizontal line within each box indicates the median value; and the black line connects the mean values across analysis units; the symbol "×" indicates that only one species was recorded at that sampling site; and the point indicates the data of each sampling site. ns, non-significance;
***
, significance at P<0.01 level.
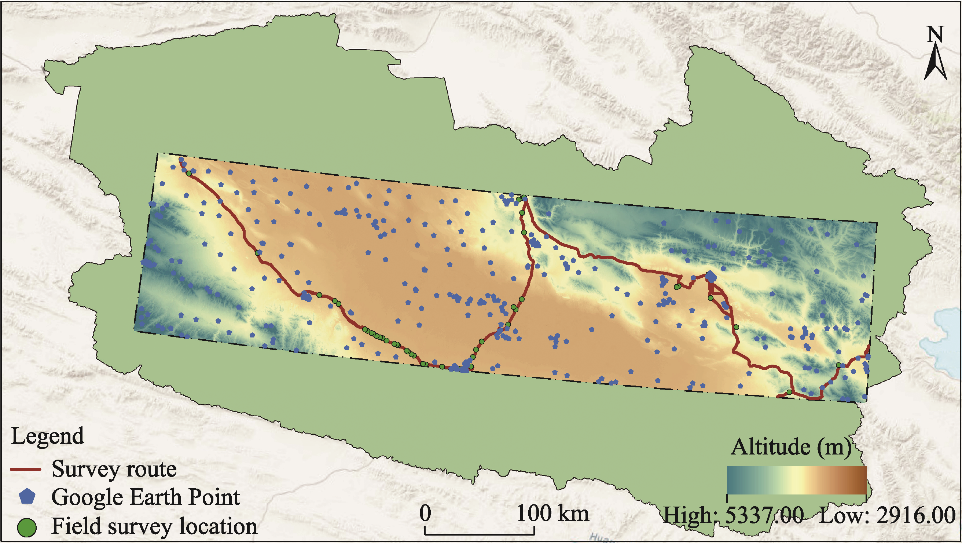
Fig. S1
Spatial distribution of validation sampling sites used for accuracy assessment. The survey route denotes the actual vehicle survey route conducted during field investigations in the Qaidam Basin from June to July in 2025.
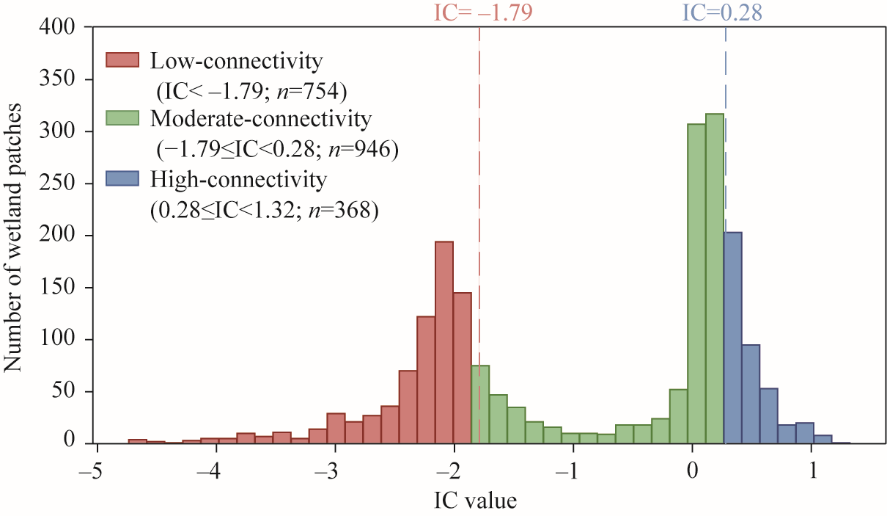
Fig. S2
Frequency distribution histogram of IC values with connectivity classification based on the Jenks Natural Breaks method
Table S2
Characteristics of wetland vegetation communities in the Qaidam Basin
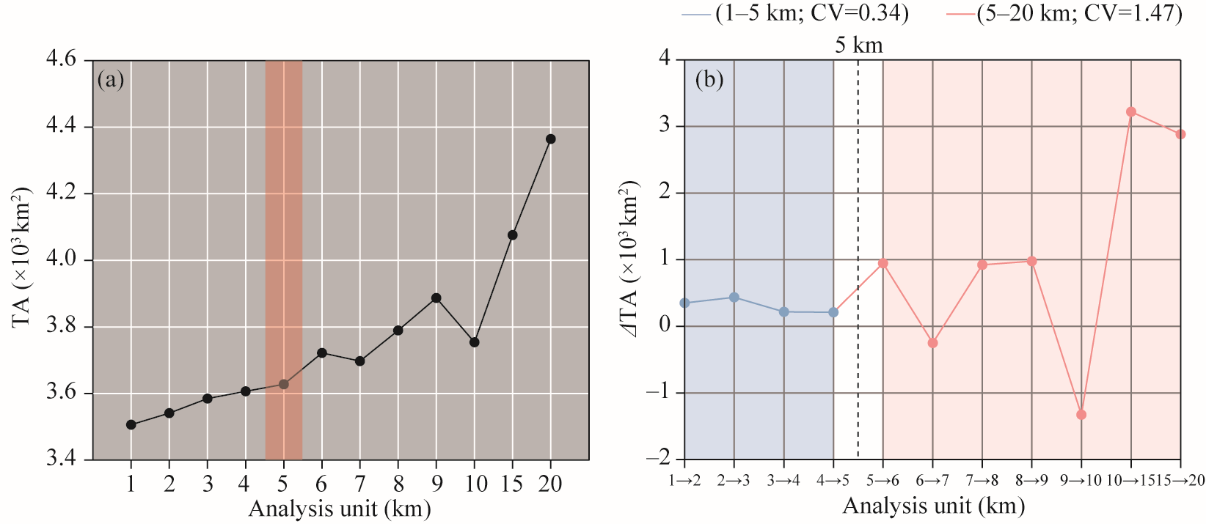
Fig. 4
Determination of the optimal analysis unit. (a), variation characteristics of wetland landscape total area (TA); (b), stability analysis of first-order differences (ΔTA) across different analysis unit. CV, coefficient of variation.
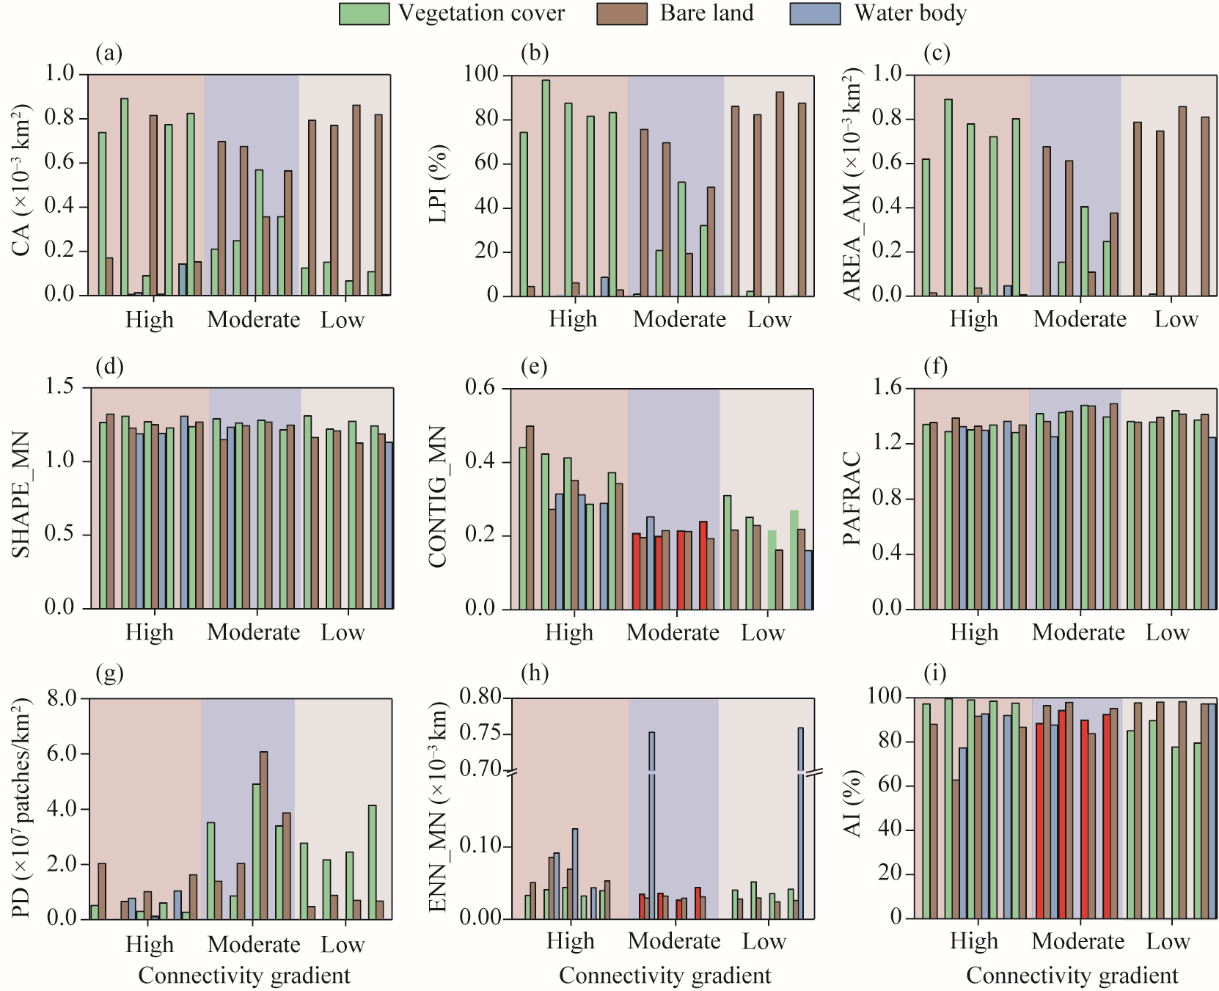
Fig. 7
Characteristics of wetland vegetation pattern indices under different connectivity gradients. (a), class area (CA); (b), largest patch index (LPI); (c), area-weighted mean patch size (AREA_AM); (d), mean shape index (SHAPE_MN); (e), patch density (PD); (f), perimeter-area fractal dimension (PAFRAC); (g), mean contiguity index (CONTIG_MN); (h), mean Euclidean nearest-neighbor distance (ENN_MN); (i), aggregation index (AI).