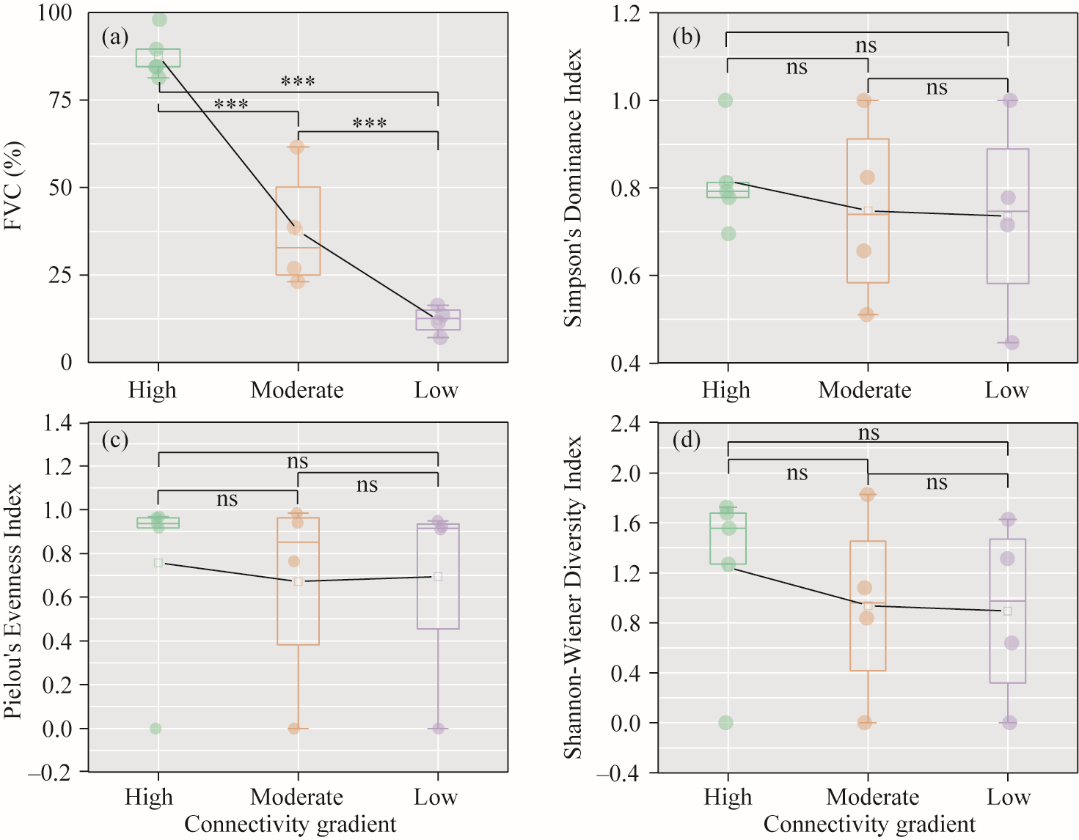
Fig. 6 Comparative analysis of wetland vegetation community characteristics under different connectivity gradients. (a), fractional vegetation coverage (FVC); (b), Simpson's Dominance Index; (c), Pielou's Evenness Index; (d) Shannon-Wiener Diversity Index. The upper and lower boundaries of the box indicate the 25th and 75th percentiles, respectively; the bar is the standard deviation (SD); the horizontal line within each box indicates the median value; and the black line connects the mean values across analysis units; the symbol "×" indicates that only one species was recorded at that sampling site; and the point indicates the data of each sampling site. ns, non-significance; ***, significance at P<0.01 level.
本文的其它图/表