| Connectivity gradients | Threshold range | Sampling site | IC value | Geographic information |
|---|---|---|---|---|
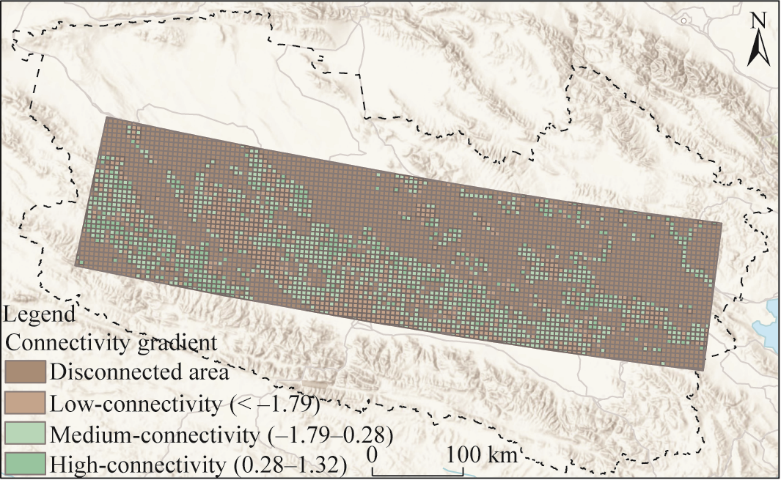
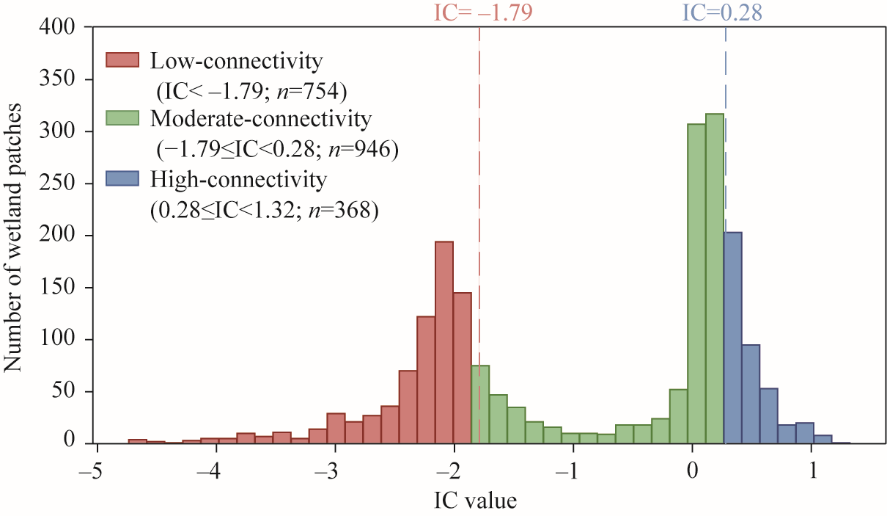
| High-connectivity | 0.28-1.32 | S2 | 0.38 | 36°34′25.33′′N, 98°31′21.66′′E |
| S3 | 0.31 | 37°09′10.21′′N, 97°33′14.92′′E | ||
| S4 | 0.66 | 37°24′30.63′′N, 96°43′32.58′′E | ||
| S5 | 0.29 | 37°44′39.71′′N, 95°17′28.83′′E | ||
| S11 | 0.47 | 36°58′21.19′′N, 93°02′08.41′′E | ||
| Moderate-connectivity | -1.79-0.28 | S1 | 0.05 | 36°47′40.06′′N, 99°00′29.35′′E |
| S8 | 0.03 | 36°36′53.92′′N, 93°53′19.79′′E | ||
| S9 | -1.75 | 36°52′39.82′′N, 93°23′53.26′′E | ||
| S10 | 0.05 | 36°36′16.16′′N, 93°54′13.67′′E | ||
| Low-connectivity | < -1.79 | S6 | -2.16 | 36°36′16.80′′N, 94°58′28.85′′E |
| S7 | -1.86 | 36°28′13.95′′N, 94°19′27.01′′E | ||
| S12 | -2.33 | 37°22′07.14′′N, 92°30′37.78′′E | ||
| S13 | -2.06 | 37°33′14.12′′N, 92°07′54.68′′E |
Fig. 8 Analysis of drivers for wetland vegetation characteristics in the Qaidam Basin using PLS-PM. (a), the loading value of each explanatory variable; (b), the direct and indirect effects of environmental variables on wetland ecosystems from the PLS-PM. AVE, average variance extracted; MAP, mean annual precipitation; MAT, mean annual temperature; PET, potential evapotranspiration. GOF, Goodness-of-Fit. **, significance at P<0.05 level; ***, significance at P<0.01 level. Solid lines indicate significant relationships; and blue and red dashed lines indicate negative and positive insignificant relationships, respectively. The thickness of the line represents the strength of the causal relationship, supplemented by a standardized path coefficient.
Fig. 6 Comparative analysis of wetland vegetation community characteristics under different connectivity gradients. (a), fractional vegetation coverage (FVC); (b), Simpson's Dominance Index; (c), Pielou's Evenness Index; (d) Shannon-Wiener Diversity Index. The upper and lower boundaries of the box indicate the 25th and 75th percentiles, respectively; the bar is the standard deviation (SD); the horizontal line within each box indicates the median value; and the black line connects the mean values across analysis units; the symbol "×" indicates that only one species was recorded at that sampling site; and the point indicates the data of each sampling site. ns, non-significance; ***, significance at P<0.01 level.
Fig. 7 Characteristics of wetland vegetation pattern indices under different connectivity gradients. (a), class area (CA); (b), largest patch index (LPI); (c), area-weighted mean patch size (AREA_AM); (d), mean shape index (SHAPE_MN); (e), patch density (PD); (f), perimeter-area fractal dimension (PAFRAC); (g), mean contiguity index (CONTIG_MN); (h), mean Euclidean nearest-neighbor distance (ENN_MN); (i), aggregation index (AI).