

Risk Assessment and Planning Optimization of Wind Disasters in Protected Areas of the Fuzhou Metropolitan Area
|
LIN Shuyun is a master student in the College of Landscape Architecture and Art, Fujian Agriculture and Forestry University. Her research focuses on national parks and protected areas |
|
WANG Shaohan, Ph.D., is a lecturer in the College of Landscape Architecture and Art, Fujian Agriculture and Forestry University. Her research focuses on territorial landscape conservation and ecological restoration, national parks and protected areas |
|
LIAO Lingyun, Ph.D., is a professor and doctoral supervisor in the College of Landscape Architecture and Art, Fujian Agriculture and Forestry University. Her research focuses on national park and protected area planning, and community planning |
Received date: 2025-10-31
Revised date: 2026-02-08
Online published: 2026-03-13
[Objective] Climate change, biodiversity loss, and environmental pollution are widely recognized as the triple planetary crisis. Among them, climate change has intensified the frequency and magnitude of extreme wind events, particularly typhoons, resulting in substantial impacts on ecosystems and human societies. China is located within the active typhoon belt of the northwest Pacific, where approximately 80% of annual typhoons make landfall. Coastal regions exhibit pronounced spatial heterogeneity in wind disaster risk due to complex interactions among topography, climate conditions, and socioeconomic development. Protected areas, as critical spatial units for biodiversity conservation and ecological security, are increasingly exposed to wind hazards. However, systematic assessments of wind disaster risk at the protected-area scale remain limited. Existing studies predominantly adopt the three-dimensional “hazard−exposure−vulnerability” framework proposed by the Intergovernmental Panel on Climate Change (IPCC). In this framework, hazard represents the intensity and frequency of disasters, exposure reflects the degree to which natural and social elements are affected, and vulnerability indicates the likelihood of system damage. While this framework has been widely applied to floods, earthquakes, heatwaves, and other natural hazards, its application to wind disaster risk in protected areas is still insufficient. In particular, previous studies often fail to integrate long-term hazard dynamics with ecological and socio-economic characteristics, limiting their ability to support targeted risk management and spatial planning.
[Methods] To address these gaps, drawing on the Sixth Assessment Report of the Intergovernmental Panel on Climate Change, we developed a three-dimensional wind disaster risk assessment framework integrating hazard, exposure, and vulnerability. The framework combined multi-source environmental and socio-economic data to quantify wind disaster risk and reveal its spatial differentiation and temporal evolution. The Fuzhou Metropolitan Area was selected as the case study because it is located along China’s southeastern coast, characterized by frequent typhoon activity, diverse protected area types, and pronounced coastal-inland gradients, making it a representative region for examining wind disaster risks under climate change. Within this framework, wind disaster risk levels of protected areas in 1980 and 2020 were quantified and compared. Multi-criteria evaluation methods were applied to construct the hazard, exposure, and vulnerability indices, while the entropy weight method was used to reduce subjectivity in indicator selection. ArcGIS spatial analysis techniques, including spatial overlay,zonal statistics, and hotspot analysis, were employed to analyze the spatial patterns and temporal dynamics of wind hazards, exposure, vulnerability, and comprehensive risk. At the indicator level, meteorological, topographic, ecological, and socio-economic data were integrated to conduct comparative risk assessments across protected areas in the Fuzhou metropolitan area.
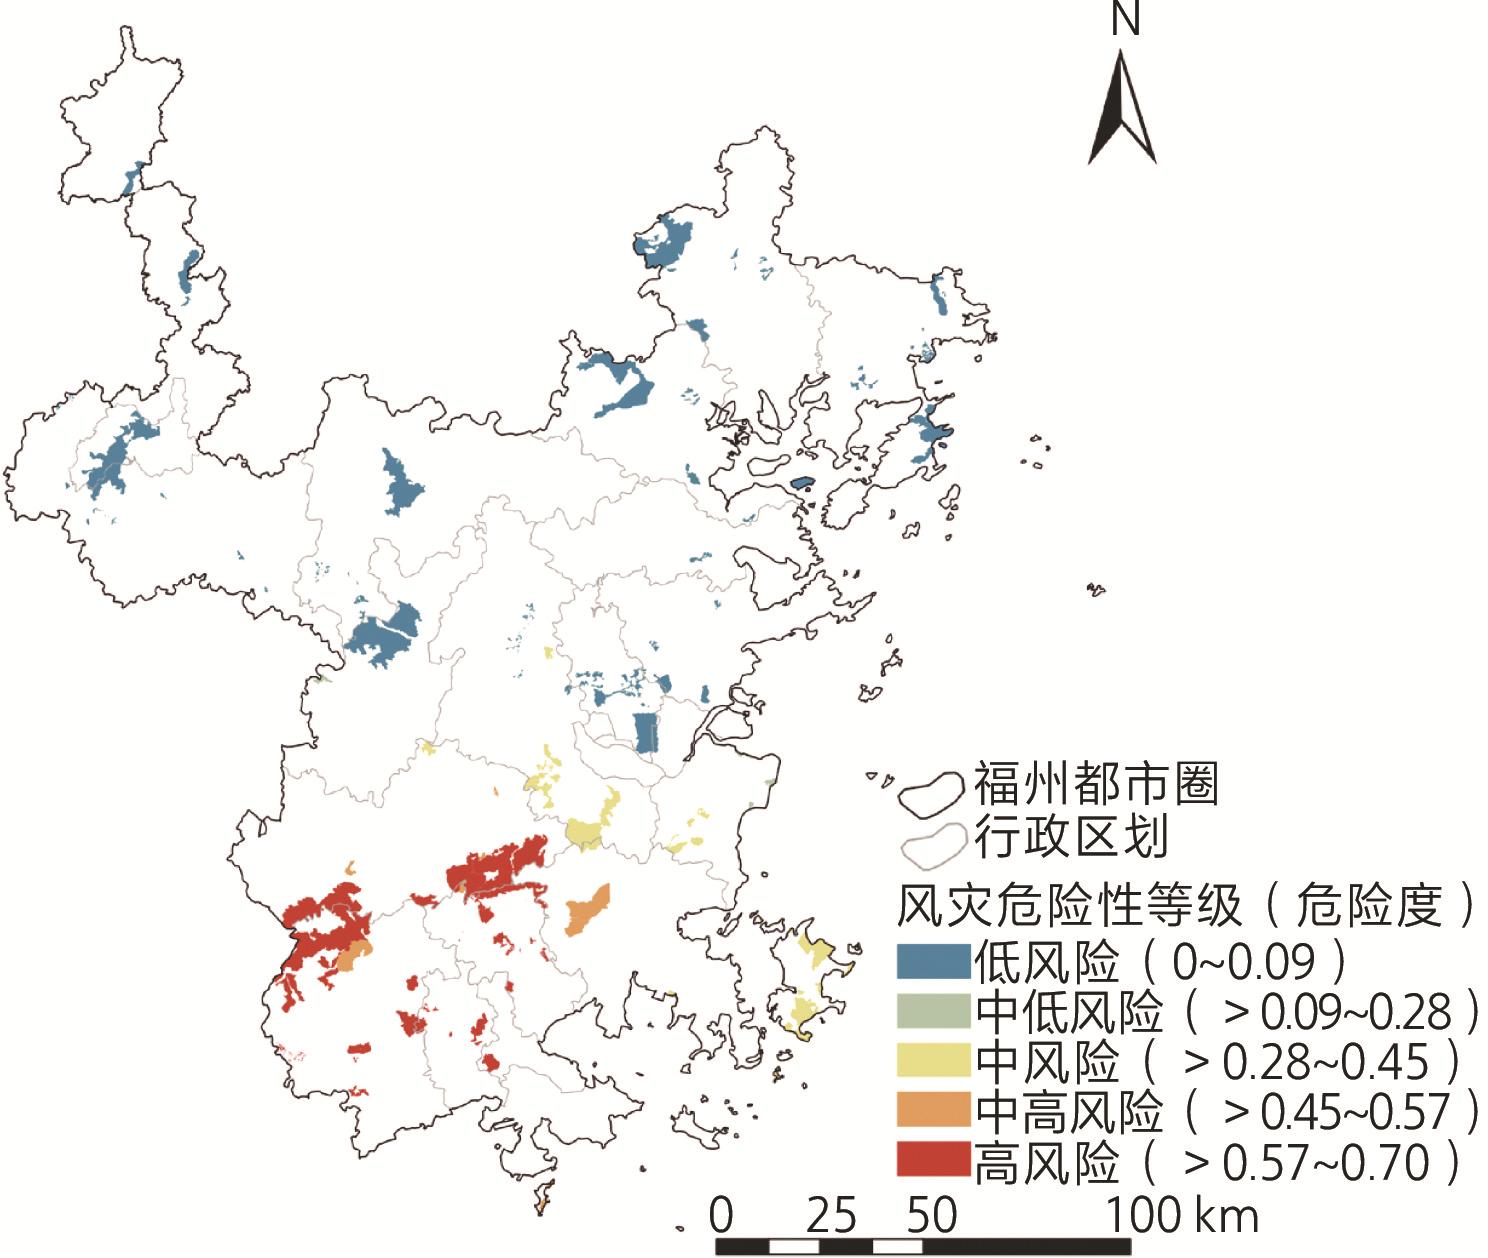
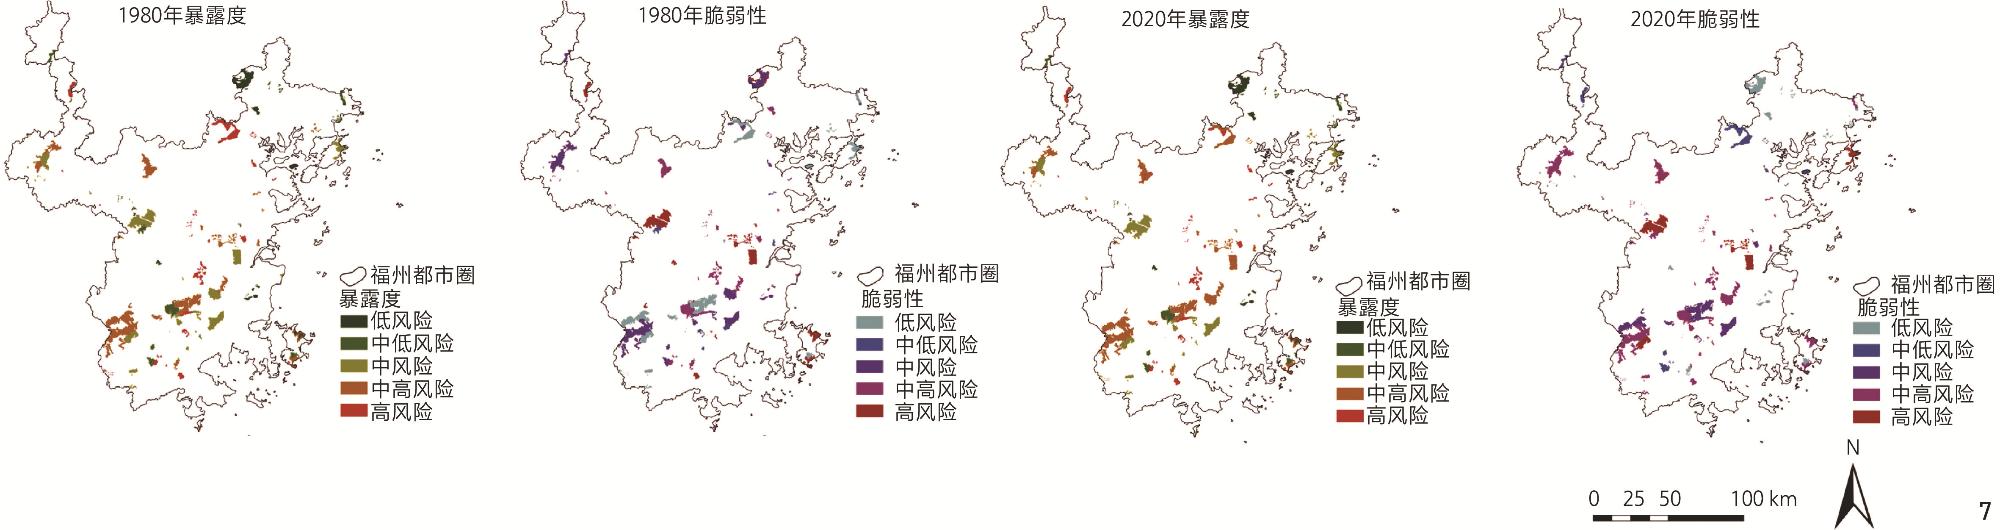
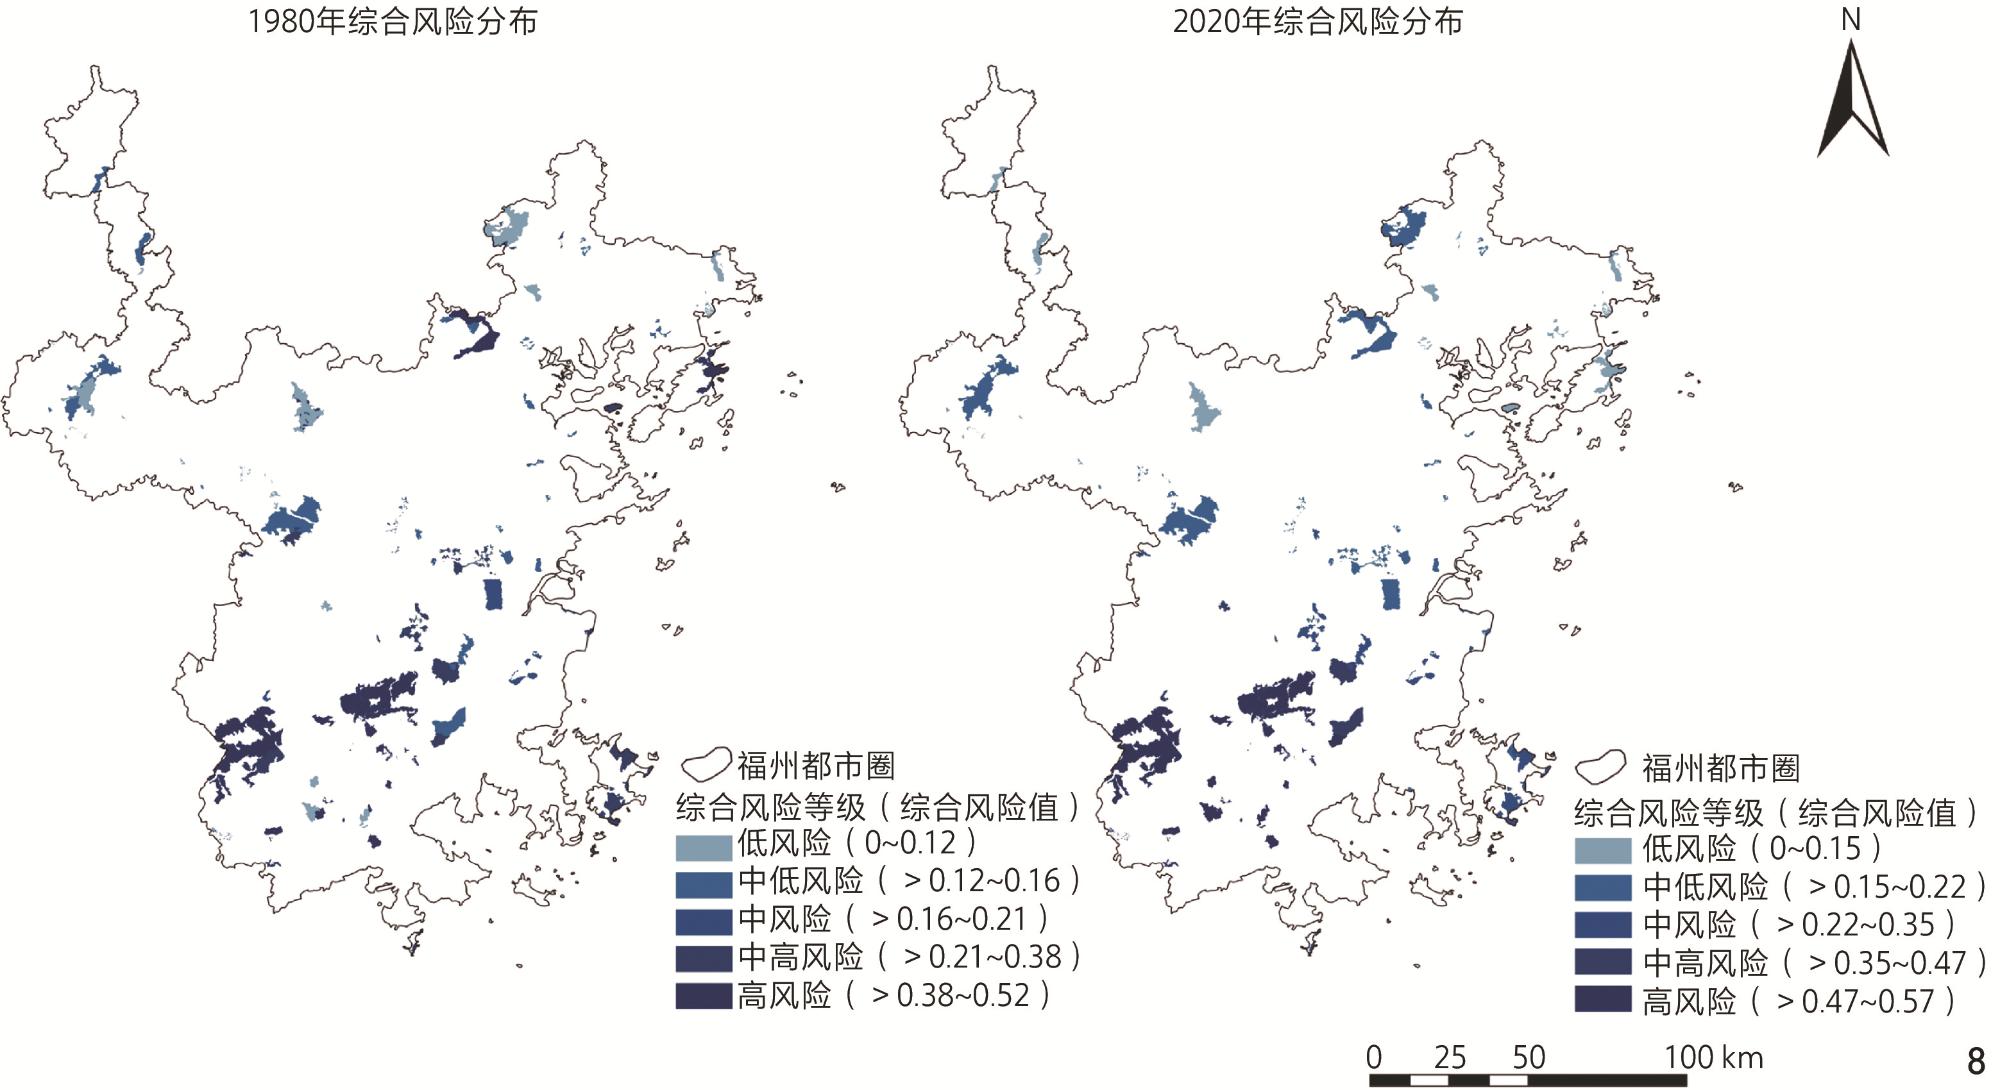
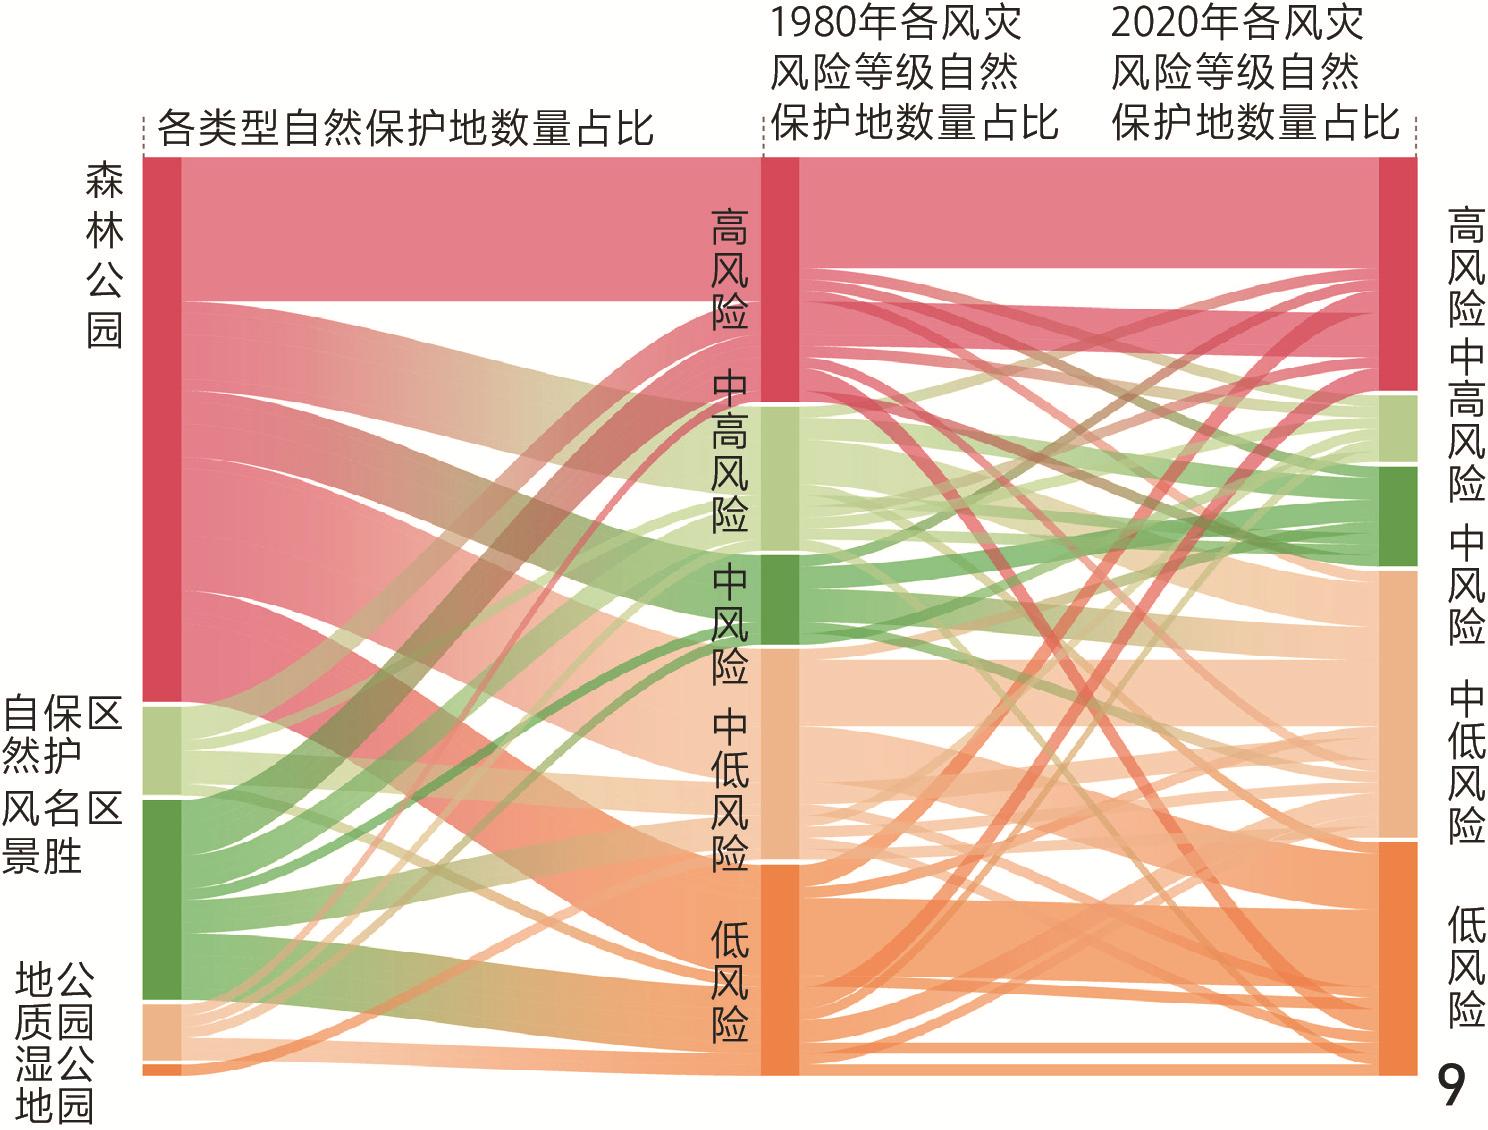
[Results] 1) Wind disaster risk exhibited a clear spatial pattern characterized by higher risk in the south (0.57) and lower risk in the north (0.09), with coastal protected areas generally facing higher risk levels than inland areas. Wind disaster risk showed clear spatial clustering, with high-risk protected areas (0.61−0.66) concentrated in the southern and southwestern regions, medium−high risk areas (0.500−0.550) in the central transition zone, and low-risk areas (≤0.01) mainly distributed in the northern and northeastern regions, showing a pronounced south−north decreasing gradient. 2)Exposure levels across protected areas were generally moderate to high, while vulnerability showed an overall increasing trend from 1980 to 2020, indicating growing sensitivity of protected areas to wind hazards over time. In 1980, high-exposure areas (0.59−0.62) were located in northwest mountains and central hills, and low-exposure areas (0.04) were along the eastern coast. By 2020, high-exposure zones persisted but declined (e.g., from 0.59 to 0.31), with low coastal exposure unchanged, showing stable spatial patterns and an overall decrease. 3)Comprehensive wind disaster risk differed markedly among protected area types, ranked from high to low as forest parks to scenic areas, nature reserves, wetland parks, and geological parks. High-risk protected areas, including Jiulihu Scenic Area, Dafeishan, and Biqing Forest Parks (0.54−0.57), clustered in the south and south-central region. Medium-risk areas (0.30−0.50) occupied central and coastal transitional zones. Low-risk areas, such as Dongchong Peninsula, Sandu’ao, and Baiyunshan Parks (≤0.20), were located in the north and inland mountains.
[Conclusion] Based on these findings, we proposed three planning optimization strategies for protected areas: optimizing functional zoning to reflect spatial risk differentiation, establishing dynamic wind hazard monitoring and early-warning mechanisms, and implementing pilot-based differentiated risk mitigation measures tailored to specific risk profiles. We analyzed wind disaster risks across temporal and spatial scales and visualized their dynamics through spatial mapping. Focusing on the protected area level, fine-scale spatial heterogeneity and temporal evolution patterns can be identified, which are often obscured in conventional assessments. By revealing the spatial patterns and evolution characteristics of wind disaster risk from a protected-area perspective, we provided an assessment framework that balances universality and practicality. The framework can offer practical support for climate-resilient planning and governance of protected area systems under ongoing climate change.
LIN Shuyun , WANG Shaohan , LIAO Lingyun . Risk Assessment and Planning Optimization of Wind Disasters in Protected Areas of the Fuzhou Metropolitan Area[J]. Landscape Architecture, 2026 , 33(3) : 111 -120 . DOI: 10.3724/j.fjyl.LA20250684
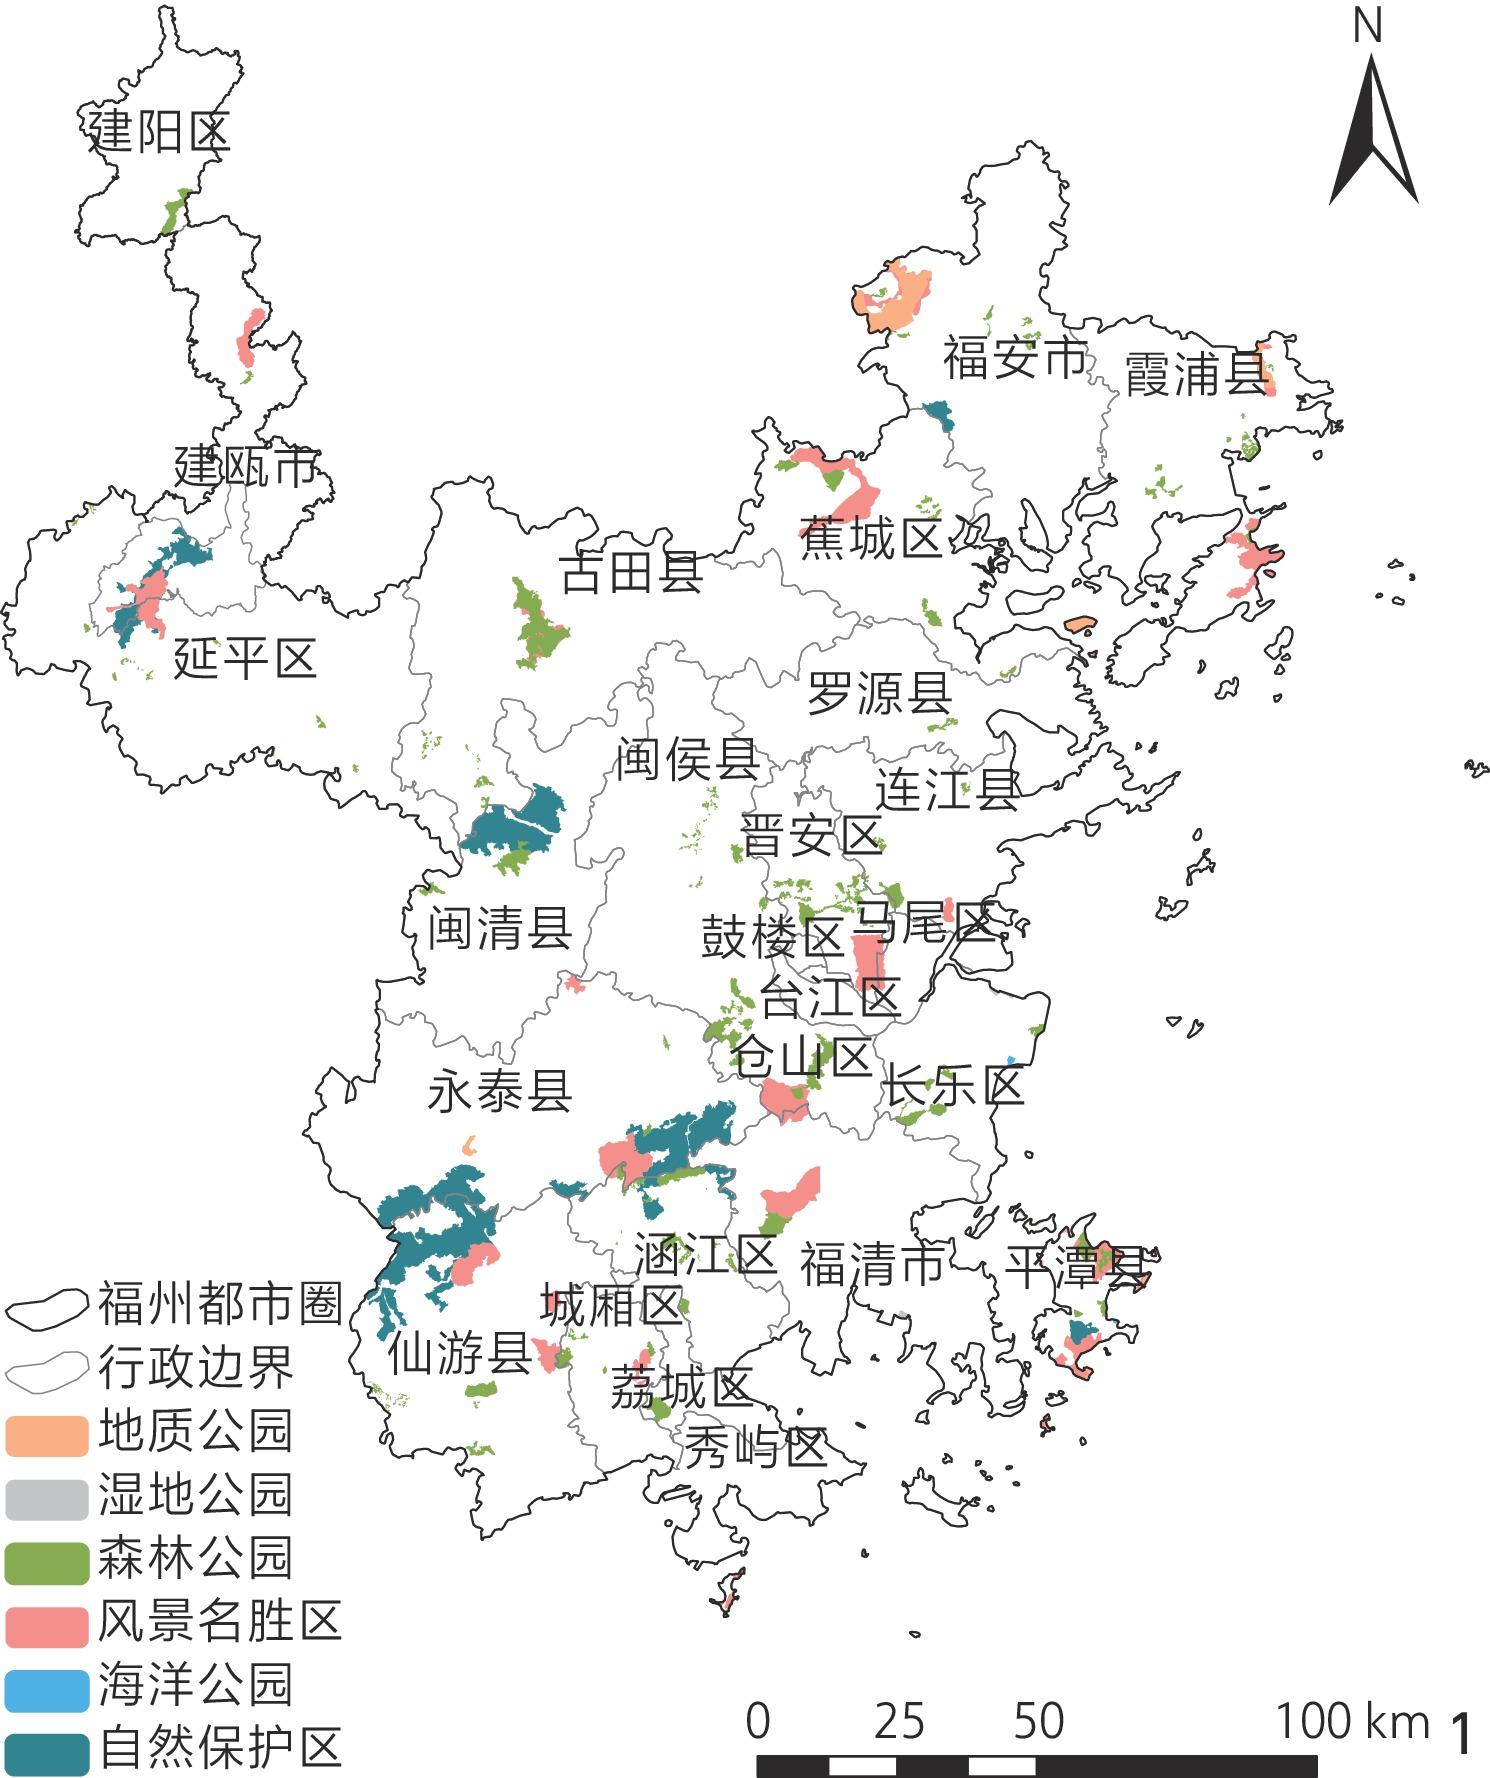
表1 福州都市圈自然保护地名录Tab. 1 Inventory of protected areas in the Fuzhou Metropolitan Area |
| 类型 | 级别 | 名称 |
| 地质公园 | 国家级 | 平潭国家地质公园、福鼎太姥山国家地质公园、白云山国家地质公园、宁德三都澳省级地质公园 |
| 省级 | 永泰百漈沟省级地质公园 | |
| 湿地公园 | 国家级 | 长乐闽江河口国家湿地公园 |
| 森林公园 | 国家级 | 福建九龙谷国家级森林公园、福清灵石山国家森林公园、福建长乐国家森林公园、平潭海岛国家森林公园、福建五虎山国家森林公园、福建旗山国家森林公园、福州国家森林公园、福建天星山国家森林公园、福建支提山国家森林公园 |
| 省级 | 福建泉州罗溪省级森林公园、仙游大蜚山省级森林公园、永春碧卿森林公园、莆田白云省级森林公园、莆田天马山省级森林公园、仙游溪口省级森林公园、莆田尖山寨省级森林公园、莆田夹漈草堂省级森林公园、莆田壶公山省级森林公园、莆田黄龙省级森林公园、莆田瑞云山省级森林公园、莆田望江山省级森林公园、永泰壁舟里省级森林公园、平潭十八村省级森林公园、闽清美菰林省级森林公园、长乐大鹤省级森林公园、福建省闽清白云山森林公园、福州西溪温泉森林公园、南平大峰山省级森林公园、连江长龙森林公园、连江贵安森林公园、福鼎大洋山省级森林公园、古田鼎古云省级森林公园、南平市郊省级森林公园、罗源吕洞省级森林公园、福安化蛟省级森林公园、南平马头山省级森林公园、闽侯北凤省级森林公园、古田溪省级森林公园、福安富春溪省级森林公园、南平凤山省级森林公园、霞浦福宁湾省级森林公园、闽侯白沙省级森林公园、南平来舟省级森林公园、南平屏山省级森林公园、霞浦杨梅岭省级森林公园、福安蟾溪省级森林公园、建瓯水西森林公园、宁德霍童溪森林公园、建阳庵山森林公园 | |
| 风景名胜区 | 国家级 | 青云山国家级风景名胜区、十八重溪国家级风景名胜区、海坛国家级风景名胜区、鼓山国家级风景名胜区、太姥山国家级风景名胜区、白云山国家级风景名胜区 |
| 省级 | 九鲤湖省级风景名胜区、凤凰山省级风景名胜区、石竹山省级风景名胜区、菜溪岩省级风景名胜区、湄洲岛国家级风景名胜区、姫岩省级风景名胜区、青芝山省级风景名胜区、茫荡山省级风景名胜区、翠屏湖省级风景名胜区、东冲半岛省级风景名胜区、支提山省级风景名胜区、归宗岩省级风景名胜区 | |
| 海洋公园 | 国家级 | 湄洲岛国家级海洋公园、长乐国家级海洋公园、平潭综合实验区海坛湾国家级海洋公园 |
| 自然保护区 | 国家级 | 福建闽江河口湿地国家级自然保护区、福建雄江黄楮林国家级自然保护区、福建茫荡山国家级自然保护区 |
| 省级 | 福清兴化湾水鸟省级自然保护区、福建莆田老鹰尖省级自然保护区、仙游木兰溪源省级自然保护区、藤山省级自然保护区、平潭三十六脚湖省级自然保护区、福建福安瓜溪桫椤省级自然保护区 |
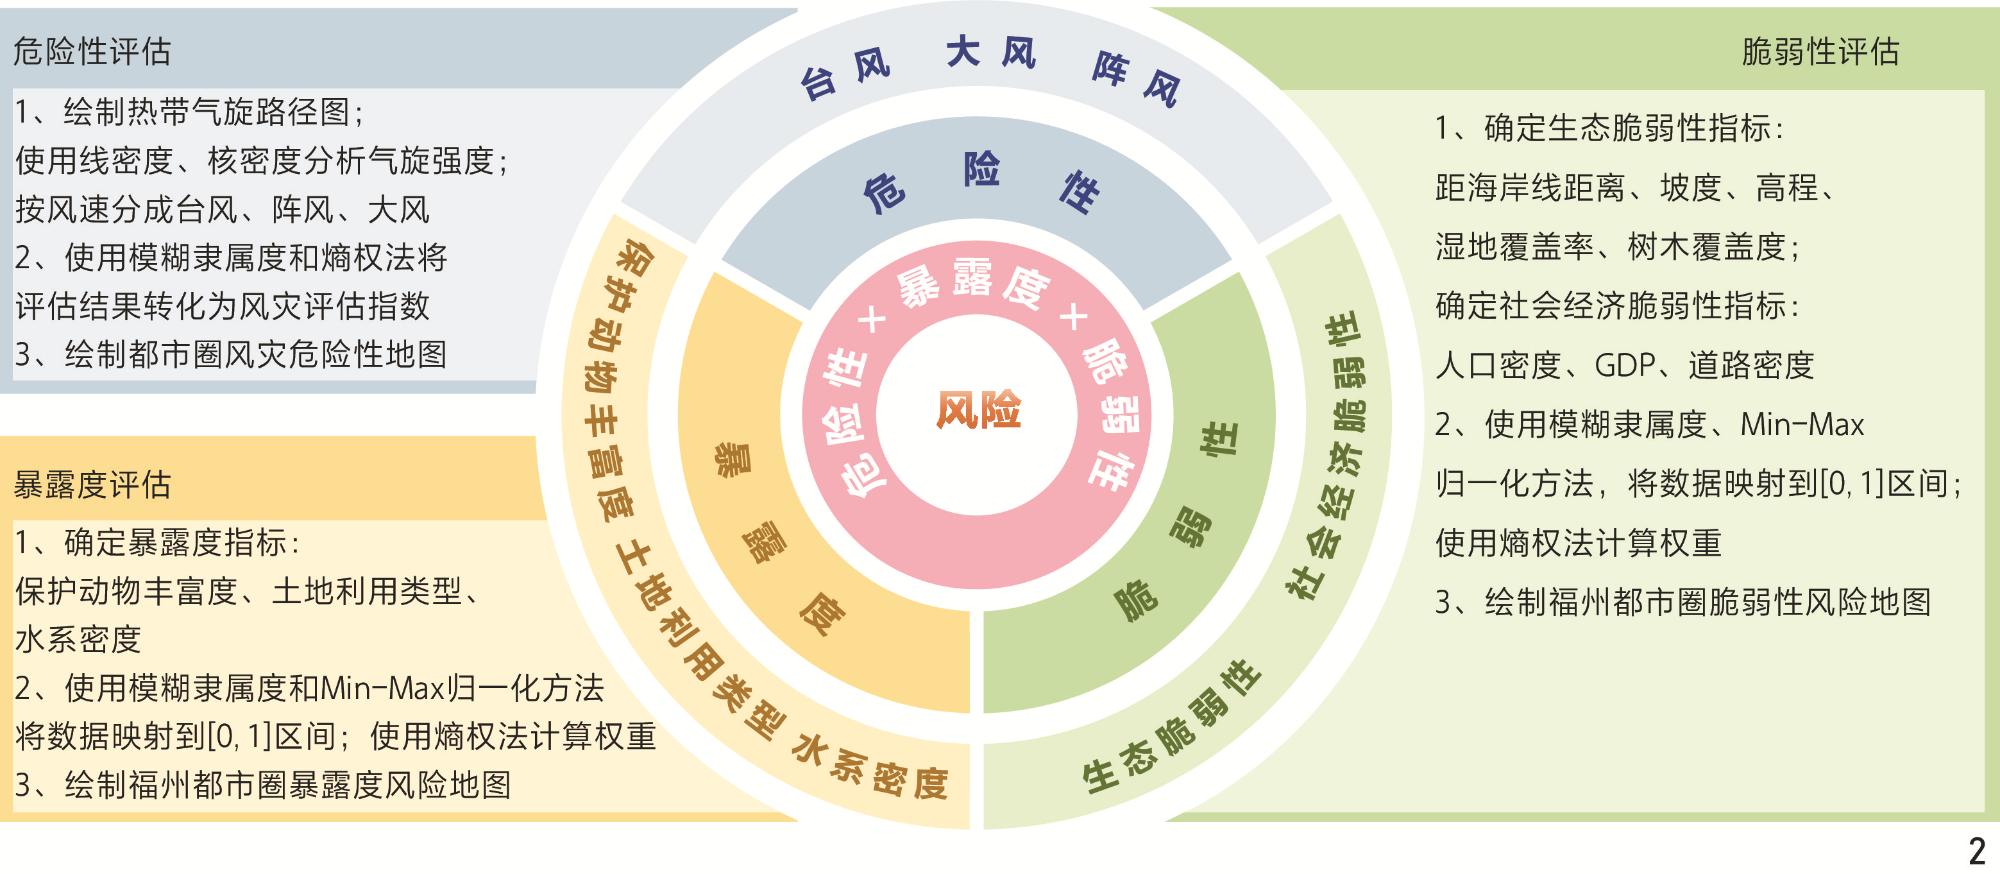
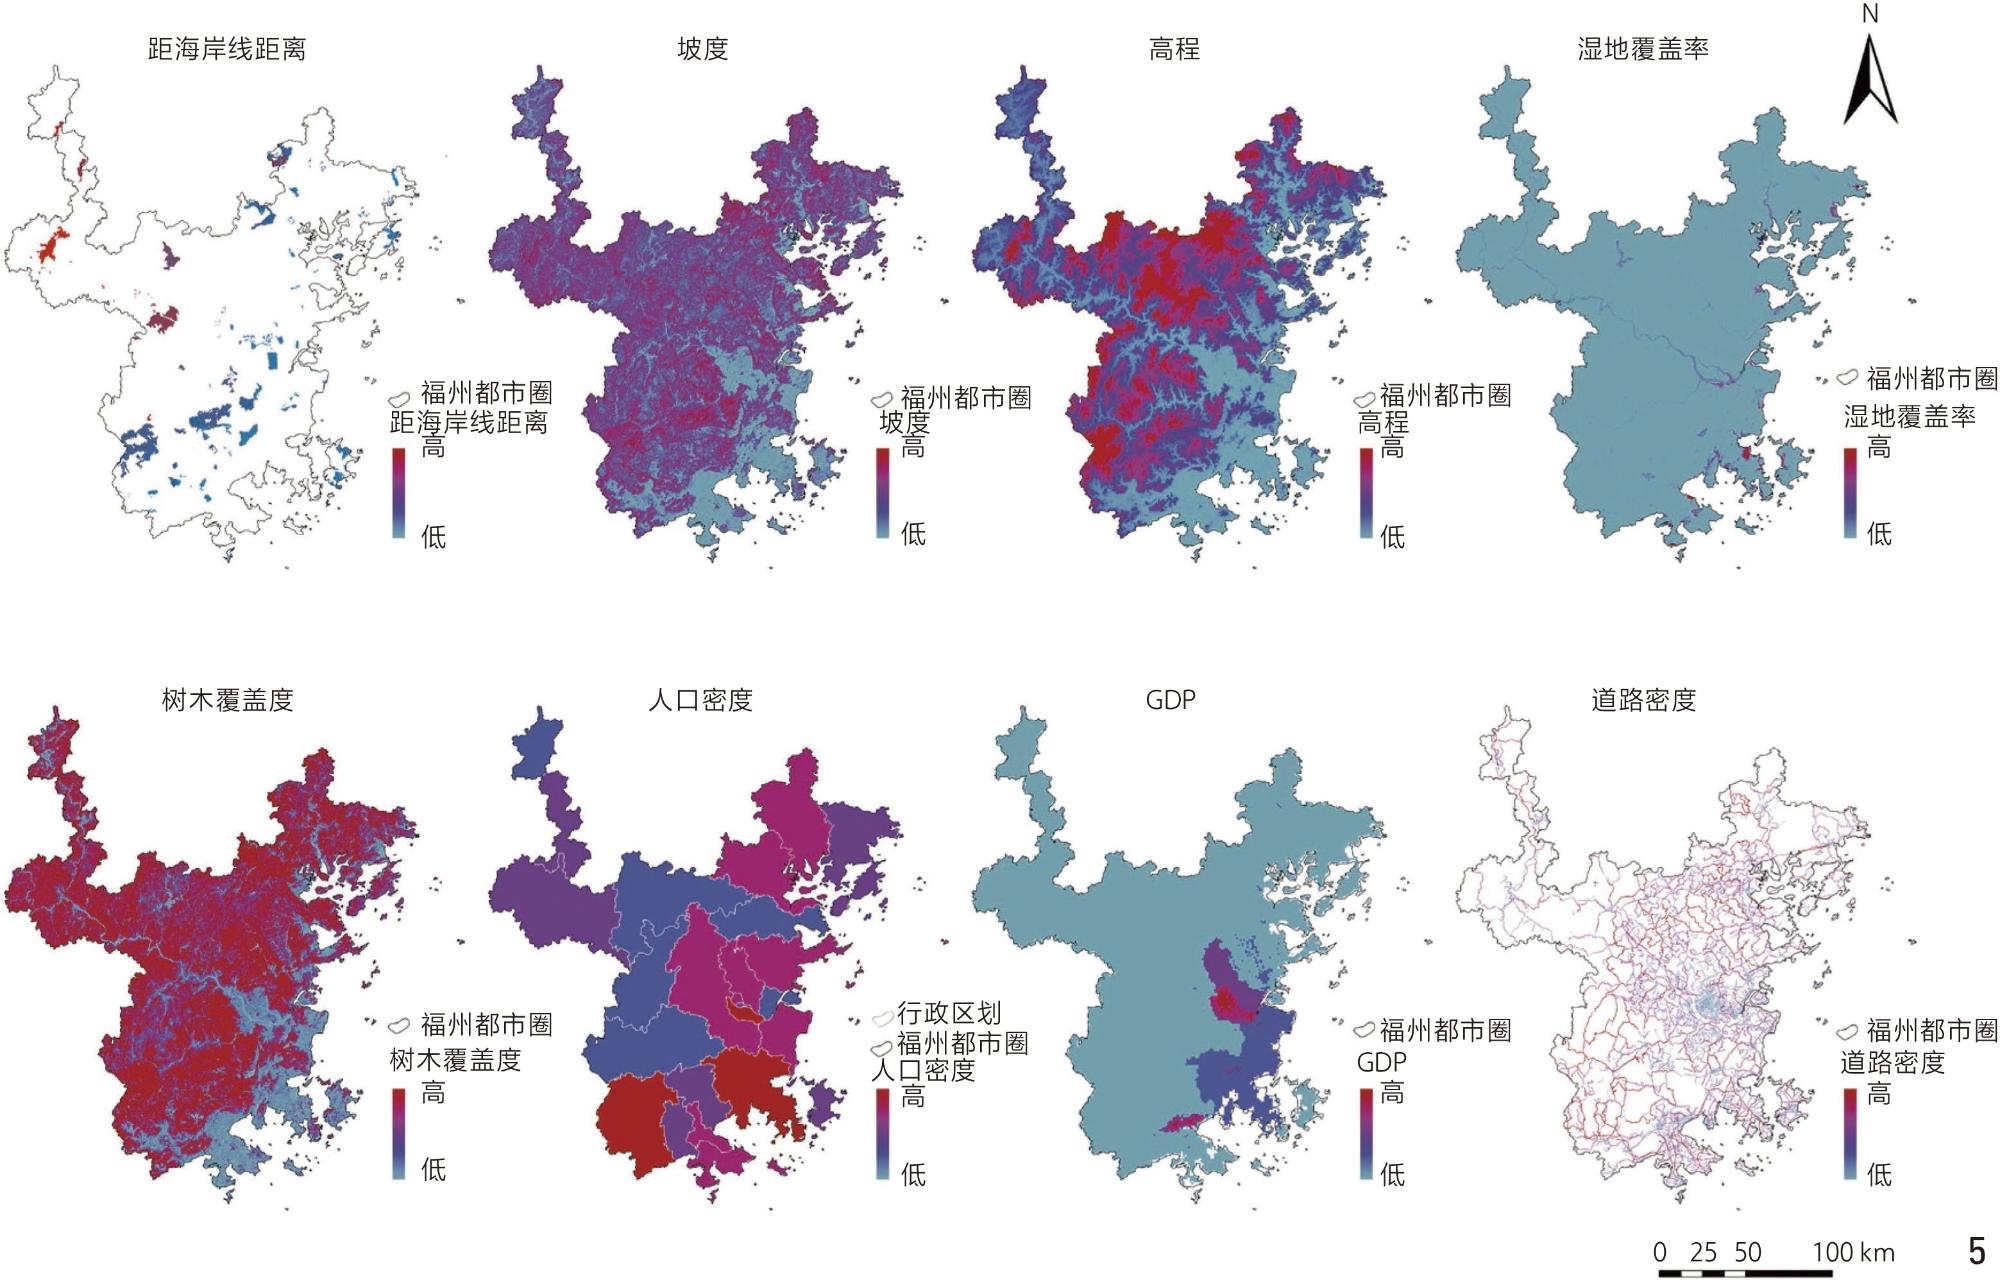
表2 福州都市圈自然保护地风灾风险评估指标体系[2, 13-14, 28, 32-33]Tab. 2 Wind disaster indicator system for protected areas in the Fuzhou Metropolitan Area[2, 13-14, 28, 32-33] |
| 维度 | 指标 | 描述 | 数据来源 | 属性 | |
| 一级维度 | 二级维度 | ||||
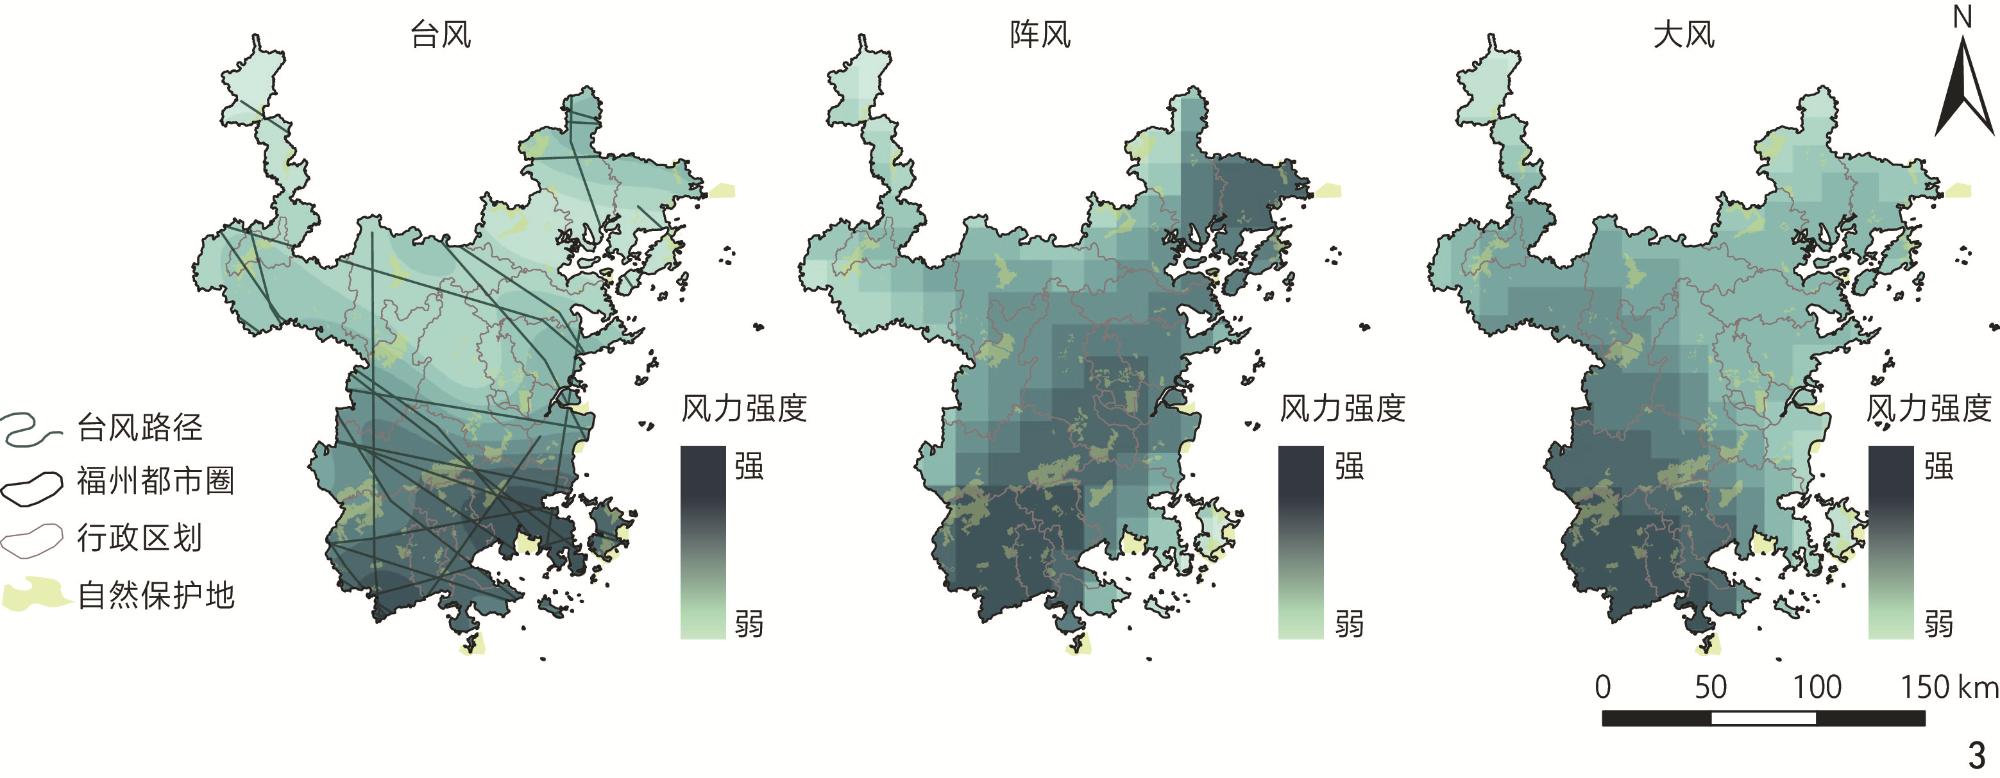
| 危险性[14] | 台风 | 反映台风的影响程度,风速越高,影响越大 | 中国气象局热带气旋资料中心(tcdata.typhoon.org.cn) | 正向 | |
| 阵风 | 反映阵风的影响程度,风速越高,影响越大 | 中国气象局热带气旋资料中心(tcdata.typhoon.org.cn) | 正向 | ||
| 大风 | 反映大风的影响程度,风速越高,影响越大 | 中国气象局热带气旋资料中心(tcdata.typhoon.org.cn) | 正向 | ||
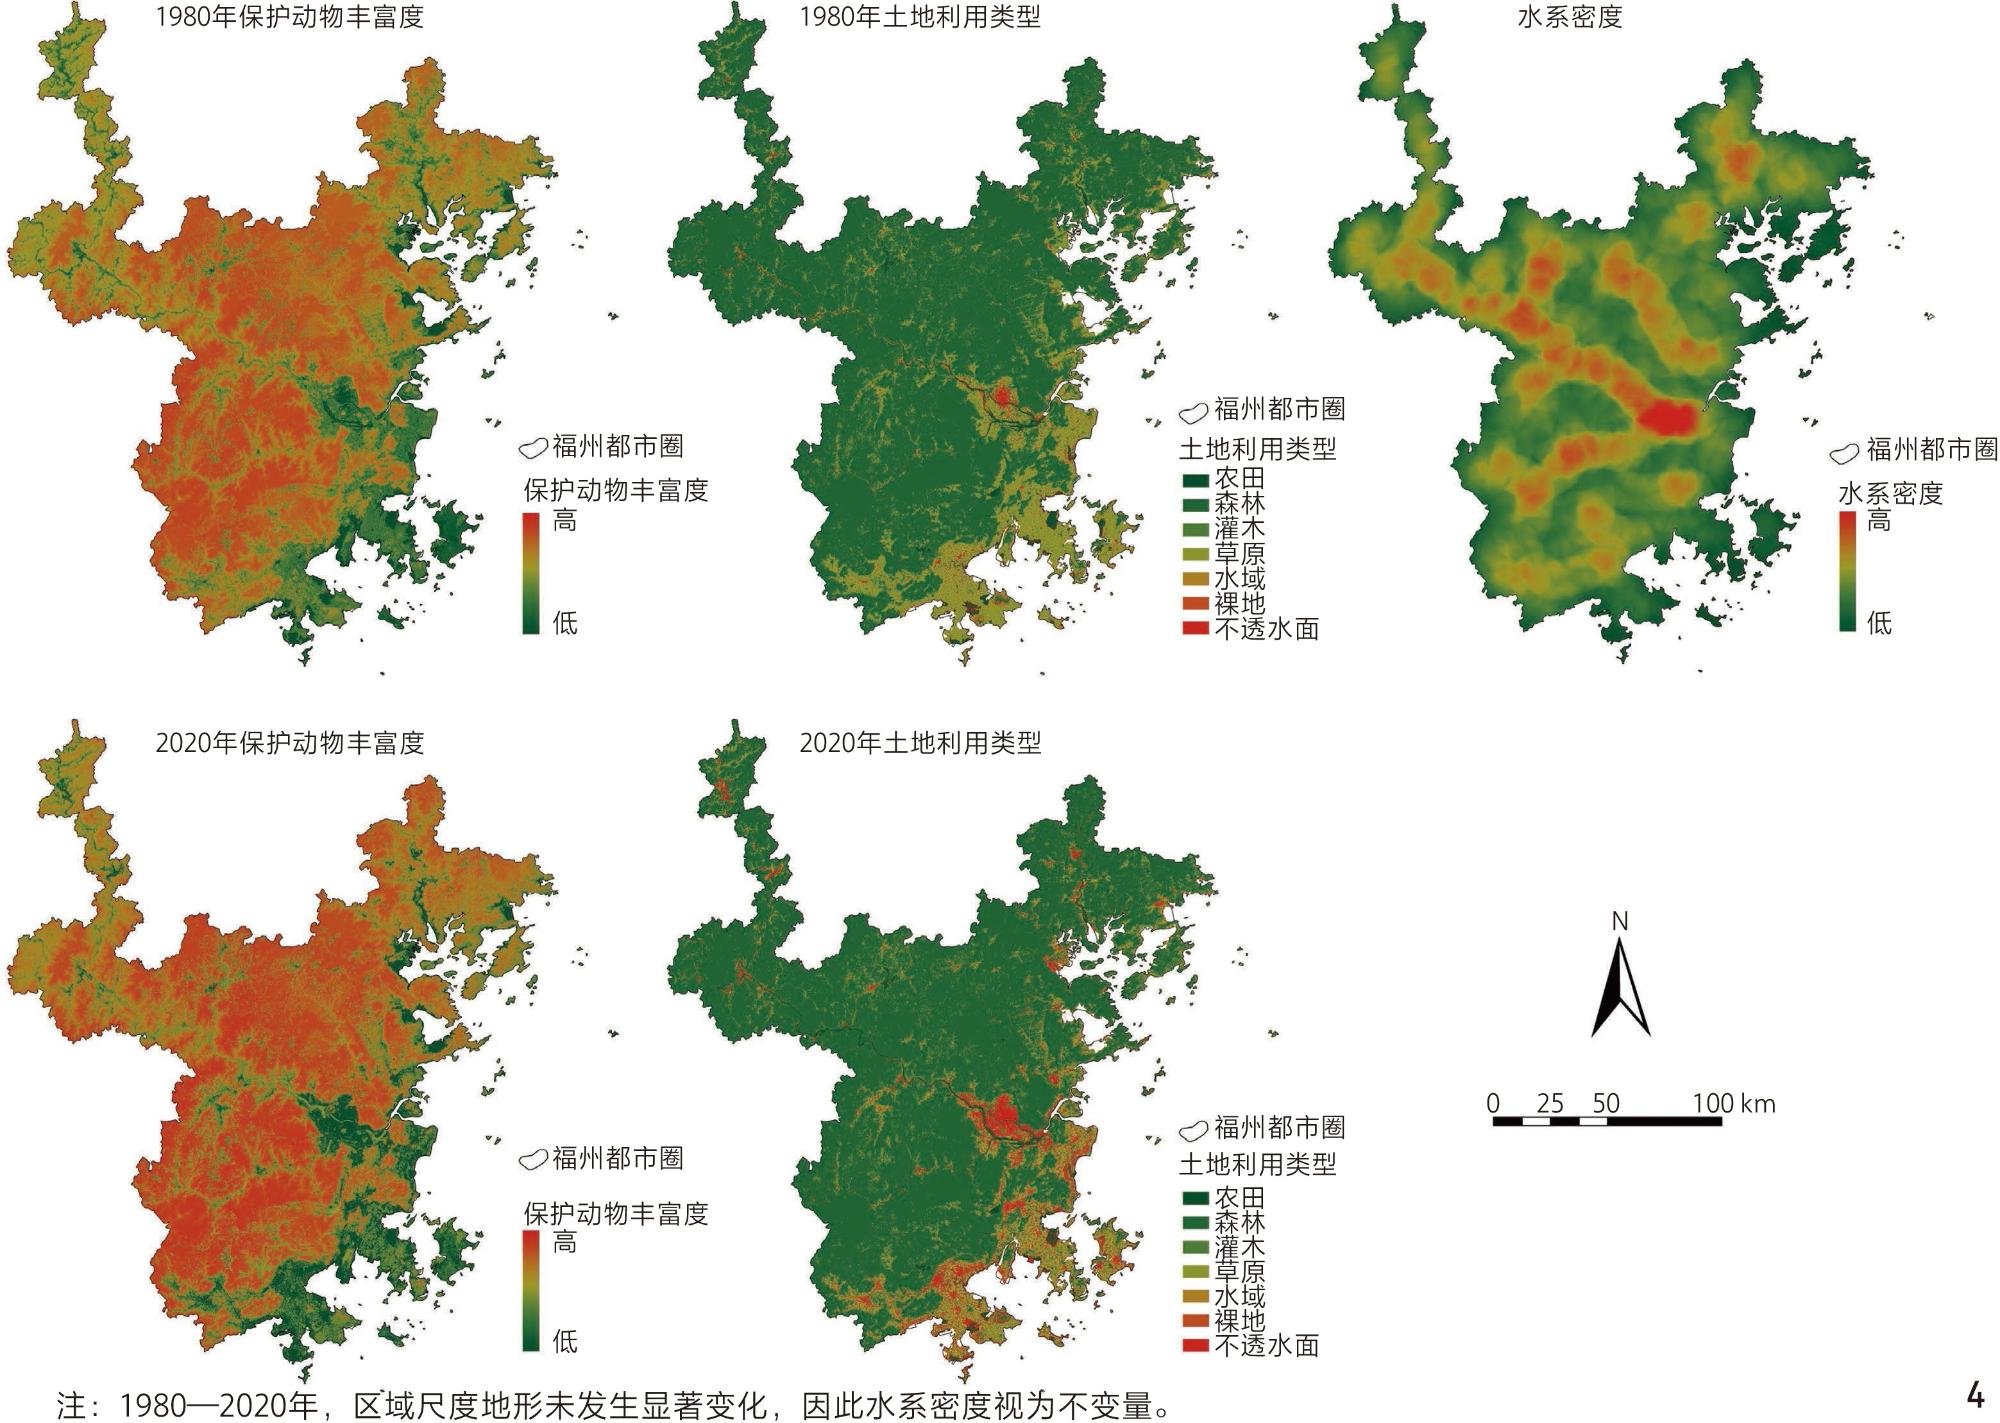
| 暴露度 | 保护动物丰富度 | 表示重点保护野生动物物种数量,数值越高,潜在暴露风险越大[32] | 科学数据资源库(Science Data Bank, doi.org/10.57760/ sciencedb.20221) | 正向 | |
| 土地利用类型 | 反映地表物理属性,其中自然覆盖为正向,人工硬化地表为负向[28] | Zenodo数据库(zenodo.org/records/15853565) | 正向、 负向 | ||
| 水系密度 | 反映区域的河网密度,数值越高,暴露程度越大[14] | 地理空间数据云(www.gscloud.cn/search) | 正向 | ||
| 脆弱性 | 生态脆 弱性 | 距海岸线距离 | 衡量风暴潮风险,距离海岸线越近,生态脆弱性越大[2] | 中国地图(审图号GS〔2024〕0650号) | 负向 |
| 坡度 | 反映地形的倾斜程度,坡度越大,雨水汇流速度越快,脆弱性越大[2] | 地理空间数据云(www.gscloud.cn/search) | 正向 | ||
| 高程 | 反映地形的高低起伏,海拔越低、地形越陡峭,脆弱性越大[2] | 地理空间数据云(www.gscloud.cn/search) | 正向 | ||
| 湿地覆盖率 | 反映自然的蓄洪缓冲能力,湿地覆盖率越大,生态脆弱性越小[33] | 2020年全球30 m精细地表覆盖产品(data.casearth.cn/sdo/detail/ 5fbc7904819aec1ea2dd7061) | 负向 | ||
| 树木覆盖度 | 反映树木覆盖情况,植被覆盖度越高,脆弱性越小[33] | Zenodo数据库(zenodo.org/records/11047923) | 负向 | ||
| 社会经济脆弱性 | 人口密度 | 反映人口集中程度,数值越大,脆弱度越小[13] | 《2020中国人口普查 分县资料》 | 负向 | |
| GDP | 反映区域经济实力和财政能力,数值越高,脆弱度越小[13] | 国家青藏高原科学数据中心平台(data.tpdc.ac.cn) | 负向 | ||
| 道路密度 | 衡量灾后救援和物资运输的可达性,数值越高,社会经济脆弱度越小[14] | OpenStreetMap平台(www.openstreetmap.org) | 负向 | ||
表3 风灾危险性、暴露度和脆弱性评估指标权重计算结果Tab. 3 Indicator weights calculation for wind hazard, exposure, and vulnerability assessment |
| 维度 | 权重 | 指标层 | 权重 | ||
| 1980年 | 2018年 | 1980年 | 2020年 | ||
| 危险性 | 0.594 0 | 0.618 0 | 台风 | 0.631 2 | 0.631 2 |
| 阵风 | 0.134 4 | 0.134 4 | |||
| 大风 | 0.234 4 | 0.234 4 | |||
| 暴露度 | 0.125 0 | 0.127 0 | 保护动物丰富度 | 0.169 9 | 0.297 2 |
| 土地利用类型 | 0.171 2 | 0.207 3 | |||
| 水系密度 | 0.658 9 | 0.495 5 | |||
| 脆弱度 | 0.281 0 | 0.255 0 | 距海岸线距离 | 0.017 4 | 0.018 6 |
| 坡度 | 0.135 2 | 0.148 6 | |||
| 高程 | 0.139 3 | 0.370 5 | |||
| 湿地覆盖率 | 0.342 8 | 0.008 8 | |||
| 树木覆盖度 | 0.010 4 | 0.005 6 | |||
| 人口密度 | 0.165 0 | 0.144 5 | |||
| GDP | 0.004 7 | 0.132 1 | |||
| 道路密度 | 0.185 2 | 0.171 3 | |||
1、以自然保护地为单元,优化“危险性-暴露度-脆弱性”风灾风险评估框架,构建具有可推广性的自然保护地风险制图方法。
2、揭示了1980—2020年福州都市圈风灾风险空间格局与演变特征,提出功能分区优化、监测预警机制提升和试点先行策略,为自然保护地功能区划与风险管控提供技术指导。
| [1] |
ALLAN R P, SODEN B J. Atmospheric Warming and the Amplification of Precipitation Extremes[J]. Science, 2008, 321(5895): 1481-1484.
|
| [2] |
WANG Z K, XIA N, ZHAO X, et al. Comprehensive Risk Assessment of Typhoon Disasters in China’s Coastal Areas Based on Multi-source Geographic Big Data[J]. Science of the Total Environment, 2024, 926:171815.
|
| [3] |
张鹏, 张云霞, 汪洋, 等. 1978—2020年中国台风灾害灾情时空分布格局及影响因素分析[J]. 热带地理, 2024, 44(6): 1047-1063.
ZHANG P, ZHANG Y X, WANG Y, et al. Analysis of Temporal-Spatial Patterns and Impact Factors of Typhoon Disaster Losses in China from 1978 to 2020[J]. Tropical Geography, 2024, 44(6): 1047-1063.
|
| [4] |
ELSNER J B. Continued Increases in the Intensity of Strong Tropical Cyclones[J]. Bulletin of the American Meteorological Society, 2020, 101(8): E1301-E1303.
|
| [5] |
KOSSIN J P. A Global Slowdown of Tropical-Cyclone Translation Speed[J]. Nature, 2018, 558(7708): 104-107.
|
| [6] |
GROSS J E, WOODLEY S, WELLING L A, et al. Adapting to Climate Change: Guidance for Protected Area Managers and Planners[M]. Gland: IUCN, 2016.
|
| [7] |
SHAN K Y, YU X P. Variability of Tropical Cyclone Landfalls in China[J]. Journal of Climate, 2021, 34(23): 9235-9247.
|
| [8] |
国家防灾减灾救灾委员会办公室 应急管理部发布2024年全国自然灾害基本情况[EB/OL].(2025-01-17)[2025-09-16].https://www.mem.gov.cn/xw/yjglbgzdt/202501/t20250117_516032.shtml.
National Disaster Prevention, Mitigation and Relief Commission Office and Ministry of Emergency Management Release Basic Information on National Natural Disasters in 2024[EB/OL]. (2025-01-17) [2025-09-16]. https://www.mem.gov.cn/xw/yjglbgzdt/202501/t20250117_516032.shtml.
|
| [9] |
MURAKAMI H, COOKE W F, MIZUTA R, et al. Robust Future Projections of Global Spatial Distribution of Major Tropical Cyclones and Sea Level Pressure Gradients[J]. Communications Earth & Environment, 2024, 5:479.
|
| [10] |
LIU G B, JIANG S L, ZHENG M L, et al. A Global ERA5-Based Tropical Cyclone Wind Field Dataset Enhanced by Integrated Parametric Correction Methods[J]. Scientific Data, 2025, 12:1429.
|
| [11] |
ZHANG Q, WU L G, LIU Q F. Tropical Cyclone Damages in China 1983−2006[J]. Bulletin of the American Meteorological Society, 2009, 90(4): 489-496.
|
| [12] |
DU J, XIANG X Y, ZHAO B Y, et al. Impact of Urban Expansion on Land Surface Temperature in Fuzhou, China Using Landsat Imagery[J]. Sustainable Cities and Society, 2020, 61:102346.
|
| [13] |
ZHANG C X, YIN K D, SHI X R, et al. Risk Assessment for Typhoon Storm Surges Using Geospatial Techniques for the Coastal Areas of Guangdong, China[J]. Ocean & Coastal Management, 2021, 213:105880.
|
| [14] |
QI J D, HE B J, CAO Y, et al. Risk Assessment of Terrestrial Protected Areas to Extreme Wind Hazards: A Case Study in Queensland, Australia[J]. Landscape and Urban Planning, 2023, 240:104888.
|
| [15] |
FOX S, AGYEMANG F, HAWKER L, et al. Author Correction: Integrating Social Vulnerability into High-Resolution Global Flood Risk Mapping[J]. Nature Communications, 2025, 16:1456.
|
| [16] |
FOX S, AGYEMANG F, HAWKER L, et al. Integrating Social Vulnerability into High-Resolution Global Flood Risk Mapping[J]. Nature Communications, 2024, 15:3155.
|
| [17] |
NANDAM V, PATEL P L. Comprehensive Analysis of Data Aggregation Techniques for Flood Vulnerability and Bivariate Flood Risk Mapping of a Coastal Urban Floodplain[J]. International Journal of Disaster Risk Reduction, 2025, 119:105330.
|
| [18] |
SENOUCI A, BARD P Y, BECK E, et al. Mapping Seismic Vulnerability at Urban Scale: Discussion on Relevant Cartography Representations and Smoothing for Urban Planning Purposes on the Oran Case Study[J]. Soil Dynamics and Earthquake Engineering, 2018, 115:545-563.
|
| [19] |
LI Z F, WU Z Y, LU X, et al. Efficient Seismic Risk Analysis of Gravity Dams via Screening of Intensity Measures and Simulated Non-parametric Fragility Curves[J]. Soil Dynamics and Earthquake Engineering, 2022, 152:107040.
|
| [20] |
ELMARAKBY E, ELKADI H. Prioritising Urban Heat Island Mitigation Interventions: Mapping a Heat Risk Index[J]. Science of the Total Environment, 2024, 948:174927.
|
| [21] |
KOOPMANS M, SCHWAAB J, VICEDO-CABRERA A M, et al. Mapping Heat-Related Risks in Swiss Cities Under Different Urban Tree Scenarios[J]. City and Environment Interactions, 2024, 24:100175.
|
| [22] |
GOPINATH G, AMBILI G K, GREGORY S J, et al. Drought Risk Mapping of South-Western State in the Indian Peninsula: A Web Based Application[J]. Journal of Environmental Management, 2015, 161:453-459.
|
| [23] |
NHAMO L, MAGIDI J, MPANDELI S, et al. Drought and Flood Risk Mapping Using a GIS-Based Multi-criteria Decision Method: A Case of the Olifants Basin, South Africa[J]. Next Sustainability, 2025, 6:100100.
|
| [24] |
NAVARRO-CARRIÓN J T, LEÓN-CADENA P, RAMON-MORTE A. Open Data Repositories and Geo Small Data for Mapping the Wildfire Risk Exposure in Wildland Urban Interface (WUI) in Spain: A Case Study in the Valencian Region[J]. Remote Sensing Applications: Society and Environment, 2021, 22:100500.
|
| [25] |
BORISOVA B, TODOROVA E, IHTIMANSKI I, et al. Wildfire Risk Assessment and Mapping: An Approach for Natura 2000 Forest Sites[J]. Trees, Forests and People, 2024, 16:100532.
|
| [26] |
SIVRIKAYA F, DEMIREL D. Fire Risk Mapping Using Machine Learning Method and Remote Sensing in the Mediterranean Region[J]. Advances in Space Research, 2025, 75(7): 5402-5419.
|
| [27] |
NAING P M, NITIVATTANANON V, BABEL M S, et al. Mapping and Prioritization of Effective Adaptation Measures for Integrated Flood and Drought Risks in the Bangkok Metropolitan Region[J/OL]. Natural Hazards Research, 1-32[2025-09-16]. https://www.sciencedirect.com/science/article/pii/S2666592125000629?via%3Dihub.
|
| [28] |
HOQUE M A, PRADHAN B, AHMED N, et al. Tropical Cyclone Risk Assessment Using Geospatial Techniques for the Eastern Coastal Region of Bangladesh[J]. Science of the Total Environment, 2019, 692:10-22.
|
| [29] |
CARRÃO H, NAUMANN G, BARBOSA P. Mapping Global Patterns of Drought Risk: An Empirical Framework Based on Sub-national Estimates of Hazard, Exposure and Vulnerability[J]. Global Environmental Change, 2016, 39:108-124.
|
| [30] |
Climate Change 2022: Impacts, Adaptation and Vulnerability[EB/OL]. [2025-12-20]. https://www.ipcc.ch/report/sixth-assessment-report-working-group-ii/.
|
| [31] |
王英姿. 福州都市圈自然保护地空间分布特征分析[J]. 福建林业科技, 2024, 51(3): 110-117.
WANG Y Z. Spatial Distribution Characteristics and Overlapping Relationship Analysis of Protected Areas in Fuzhou Metropolitan Area[J]. Journal of Fujian Forestry Science and Technology, 2024, 51(3): 110-117.
|
| [32] |
MI C R, SONG K, MA L, et al. Optimizing Protected Areas to Boost the Conservation of Key Protected Wildlife in China[J]. The Innovation, 2023, 4(3): 100424.
|
| [33] |
FLEMING C S, REGAN S D, FREITAG A, et al. Indicators and Participatory Processes: A Framework for Assessing Integrated Climate Vulnerability and Risk as Applied in Los Angeles County, California[J]. Natural Hazards, 2023, 115(3): 2069-2095.
|
| [34] |
SHAH M A R, RENAUD F G, ANDERSON C C, et al. A Review of Hydro-meteorological Hazard, Vulnerability, and Risk Assessment Frameworks and Indicators in the Context of Nature-Based Solutions[J]. International Journal of Disaster Risk Reduction, 2020, 50:101728.
|
| [35] |
ALAM A, SAMMONDS P, AHMED B. Cyclone Risk Assessment of the Cox’s Bazar District and Rohingya Refugee Camps in Southeast Bangladesh[J]. Science of the Total Environment, 2020, 704:135360.
|
| [36] |
LIU F T, XU E Q, ZHANG H Q. An Improved Typhoon Risk Model Coupled with Mitigation Capacity and Its Relationship to Disaster Losses[J]. Journal of Cleaner Production, 2022, 357:131913.
|
| [37] |
PING J Y, ZHOU J, HUANG K, et al. Modeling the Typhoon Disturbance Effect on Ecosystem Carbon Storage Dynamics in a Subtropical Forest of China’s Coastal Region[J]. Ecological Modelling, 2021, 455:109636.
|
| [38] |
LIN K C, HAMBURG S P, TANG S L, et al. Typhoon Effects on Litterfall in a Subtropical Forest[J]. Canadian Journal of Forest Research, 2003, 33(11): 2184-2192.
|
| [39] |
LIU Y J, CHEN J. Future Global Socioeconomic Risk to Droughts Based on Estimates of Hazard, Exposure, and Vulnerability in a Changing Climate[J]. Science of the Total Environment, 2021, 751:142159.
|
| [40] |
李秋蓉, 廖凌云. 基于生态系统服务簇分析的福州都市圈生态保护空缺识别研究[J]. 园林, 2025, 42(1): 14-22.
LI Q R, LIAO L Y. Identification of Ecological Protection Gaps in Fuzhou Metropolitan Area Based on Ecosystem Service Bundles Analysis[J]. Landscape Architecture Academic Journal, 2025, 42(1): 14-22.
|
| [41] |
YAN F, SHAN K Y, ZHAO H K, et al. Growing Threat of Tropical Cyclone Disasters in Inland Areas of East China[J]. Geophysical Research Letters, 2024, 51(23): e2024GL111877.
|
| [42] |
ZHANG W Y, LU B, LIAO L Y. Spatially Explicit Drivers of Habitat Degradation in Coastal Megacities Based on MGWR-GCCM: Evidence from Fuzhou, China[J]. Journal of Environmental Management, 2025, 391:126551.
|
| [43] |
ZHANG X, CHEN G S, CAI L X, et al. Impact Assessments of Typhoon Lekima on Forest Damages in Subtropical China Using Machine Learning Methods and Landsat 8 OLI Imagery[J]. Sustainability, 2021, 13(9): 4893.
|
| [44] |
赵智聪, 彭琳. 国家公园分区规划演变及其发展趋势[J]. 风景园林, 2020, 27(6): 73-80.
ZHAO Z C, PENG L. The Evolution and Development Trend of National Park Zoning Plan[J]. Landscape Architecture, 2020, 27(6): 73-80.
|
/
| 〈 |
|
〉 |