
Evaluation of Cultural Ecosystem Services of Urban Green Space Based on Participatory Geographic Information System (PGIS): A Case Study of the Core Area of Beijing
|
WANG Siyuan, Ph.D., is an associate professor in the School of Landscape Architecture, Beijing Forestry University. Her research focuses on landscape planning and design, and theory of landscape architecture |
Received date: 2023-07-10
Revised date: 2024-05-20
Online published: 2025-12-17
Copyright
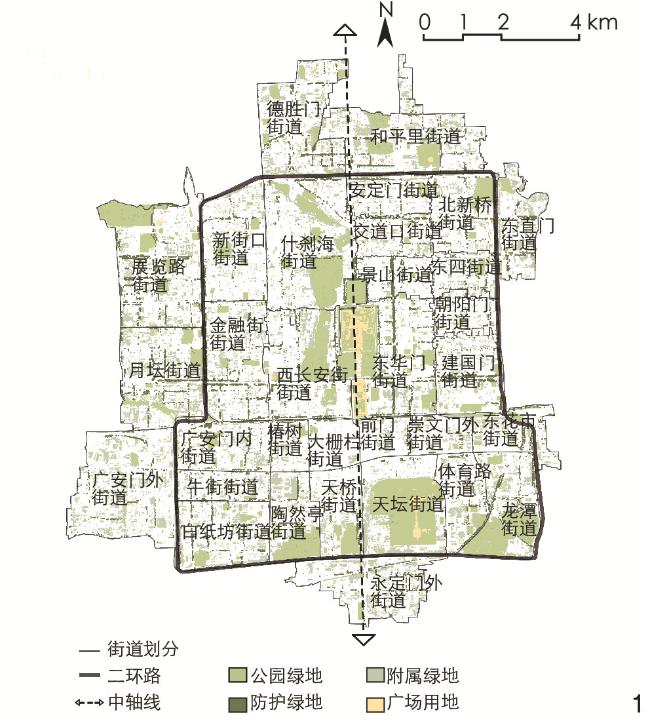
The report to the 20th National Congress of the CPC proposed to “build cultural confidence and strength and secure new successes in developing socialist culture”. At present, China’s urban construction and development model has gradually changed from the traditional rough model emphasizing resource competition and material to the new model emphasizing urban cultural soft power and urban spirit. In the core area of Beijing, a city with a long history of urban and capital construction, the distribution of cultural resources is highly representative in terms of historical, cultural, and social values. In order to promote the cultural function construction and cultural service system improvement of urban green spaces, and enhance the well-being of residents, this research evaluates and studies the cultural ecosystem services (CES) in the core area.
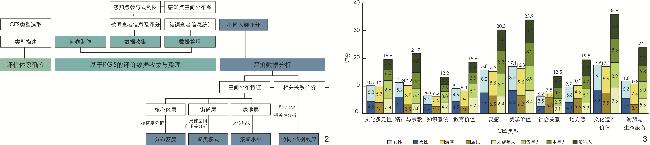
This research utilizes the participatory geographic information system (PGIS) for data collection, which mainly consists of three steps: Questionnaire preparation, data collection, and data organization. The questionnaire includes three parts: basic information of the respondents (identity, gender, and age), CES scores of the core area, and plotting of CES perception points. This research distributes questionnaires synchronously online and offline to cover different age and identity groups for evaluation data collection. A total of 332 valid questionnaires are collected, with a total of 4,154 CES perception points plotted. These perception points are recorded in ArcGIS to complete the spatial placement of CES perception points. Additionally, the research uses the kernel density and the local indicators of spatial association (LISA) methods provided by the ArcGIS platform to analyze the density distribution of various CES perception points in the core area of Beijing, clustering patterns of different sub-districts, and clustering levels of different urban green spaces. Pearson correlation coefficient is used to evaluate the correlation between different types of CES perception and explore possible trade-offs and synergistic relationships.
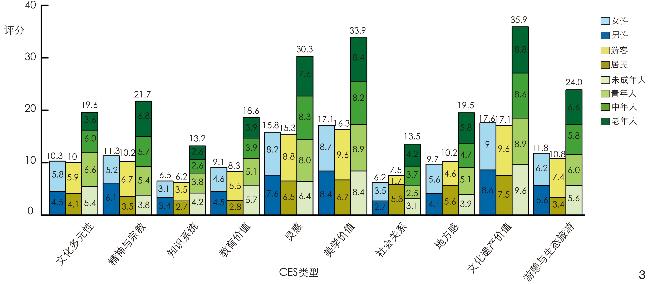
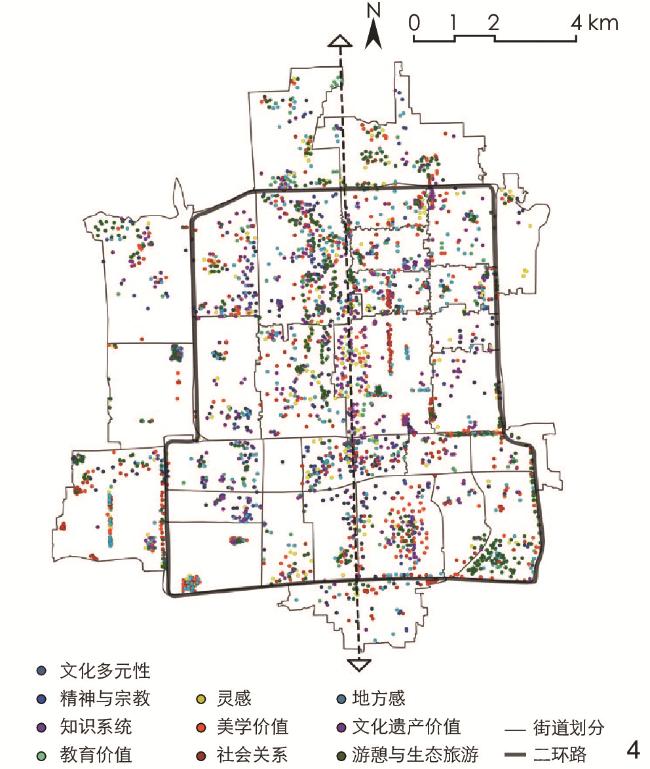
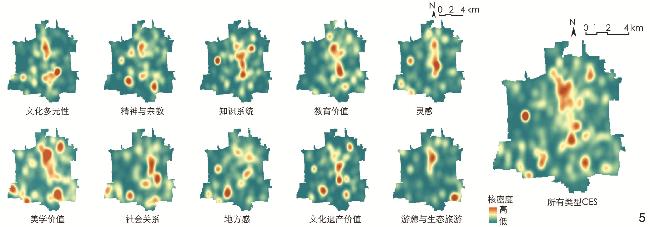
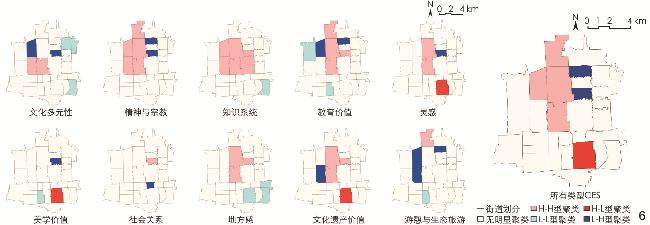
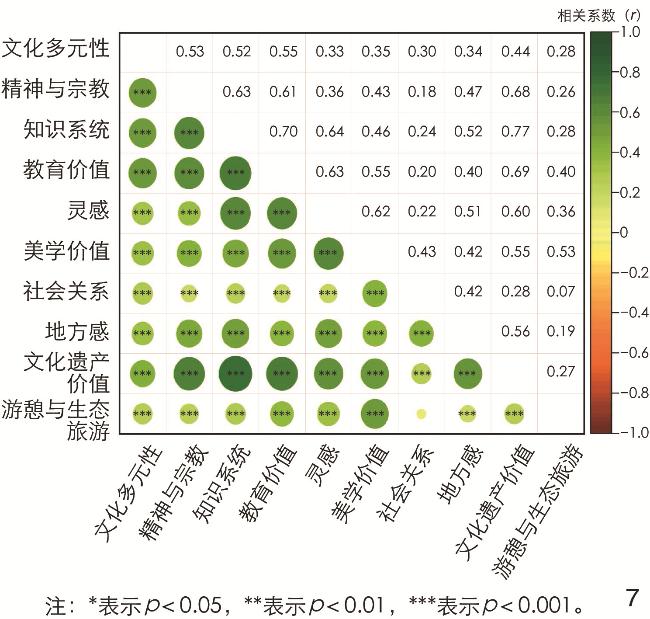
This research finds that: 1) There exist differences in the ratings of cultural services in the core area among respondents of different ages, genders, and identities. Specifically, the three types of CES perception of “inspiration”, “aesthetic value”, and “cultural heritage value” are rated higher overall, while the two types of CES perception of “knowledge system” and “social relationship” are rated lower overall. 2) There exist differences in the spatial distribution of CES perception points in terms of density, clustering pattern, and clustering level. The high-density areas of CES perception points are arranged in a dispersed manner; the clustering patterns of CES perception points vary in different sub-districts. The CES perception points located on both sides of the central axis in the sub-districts mostly exhibit H-H and L-H clustering patterns, while Tiantan sub-districts mostly exhibits H-L clustering pattern. In different types of urban green spaces, the concentration level of CES perception points varies. The concentration level of CES perception points in park green spaces and affiliated green spaces is relatively balanced, while that in protective green spaces and square land varies greatly. 3) There exists a correlation between CES perception points, indicating a synergistic effect among various CES perceptions. Specifically, the positive correlation between “cultural heritage value” and other types of CES perception is most significant, while the correlation between “cultural diversity”, “social relations”, “recreation and ecotourism” and other types of CES perception is relatively low.
The differences in spatial distribution of different types of CES perception points reflect the historical and cultural accumulation as well as urban development status of different parts of the core area of Beijing. Currently, the spatial distribution of various types of CES contradicts with the old city pattern of the core area of Beijing that is composed of the chessboard road network and historical water systems, indicating that the cultural resources in existing urban green spaces have not been fully explored. This may provide the following insights for the future protection and landscape optimization of the core area of Beijing. 1) In high-density built-up areas, the construction of point-shaped green spaces at the sub-district and community levels should consider incorporating the CES needs of residents and tourists into the decision-making of green space layout and landscape form, in order to better enhance the perception of less perceptible CES types such as “locality”, “social relationships” and “aesthetics”, avoid homogenization, and improve the efficiency of CES supply. 2) The solution to the lack of linear and circular distribution of CES in the core area is to transform the chessboard-shaped road network into a landscape shade, and restore and create the Second Ring Road and other historical water system patterns. With the development of technology and the increasing attention of the academic community to public participation, the PGIS method for CES evaluation can depict more detailed and accurate public cognitive portraits, while meeting the data needs of spatial analysis and research. In the future, it is urgent to build a CES perception and evaluation platform through new technologies, collect and archive CES perception data with multiple time dimensions, spatial levels, and population types, and conduct dynamic tracking research on CES in specific areas, in order to provide guidance for improving the quality and sustainable development of urban green space in the core area of Beijing.
Xuan LIU , Siyuan WANG . Evaluation of Cultural Ecosystem Services of Urban Green Space Based on Participatory Geographic Information System (PGIS): A Case Study of the Core Area of Beijing[J]. Landscape Architecture, 2024 , 31(7) : 131 -136 . DOI: 10.3724/j.fjyl.202307100311
表1 CES评价体系Tab. 1 CES evaluation system |
| CES类型 | 描述 |
| 文化多元性 | 在哪里感受到多元文化的并存与交融 |
| 精神与宗教 | 在哪里感受到神圣的、宗教的或源自生态系统的其他形式的精神灵感 |
| 知识系统 | 认为哪里展现了北京老城发展的文化脉络 |
| 教育价值 | 在哪里可以获取知识 |
| 灵感 | 在哪里获得了文学艺术创作的丰富灵感,哪里激发了新思想、想法或创造性表达 |
| 美学价值 | 在哪里发现或感受到美或美学价值 |
| 社会关系 | 会选择在哪里与亲属朋友会面并进行互动 |
| 地方感 | 对哪里具有独特情感、想法或记忆,并产生心理依恋 |
| 文化遗产价值 | 哪里的景观具有重要意义 |
| 游憩与 生态旅游 | 希望在哪里度过闲暇时光 |
表2 不同类型城市绿地中CES感知点的区位熵指数Tab. 2 Location entropy index of CES perception points in different types of urban green spaces |
| CES类型 | 区位熵指数 | |||
| 公园绿地 | 防护绿地 | 附属绿地 | 广场用地 | |
| 文化多元性 | 0.78 | 2.19 | 1.32 | 0.08 |
| 精神与宗教 | 1.04 | 0.67 | 0.87 | 1.71 |
| 知识系统 | 1.10 | 0.14 | 0.91 | 1.64 |
| 教育价值 | 0.94 | 0.13 | 1.37 | 1.24 |
| 灵感 | 0.99 | 1.50 | 0.76 | 1.59 |
| 美学价值 | 0.93 | 1.81 | 0.94 | 0.87 |
| 社会关系 | 0.85 | 0.06 | 1.79 | 0.22 |
| 地方感 | 0.68 | 2.49 | 1.44 | 0.27 |
| 文化遗产价值 | 1.11 | 0.12 | 0.75 | 2.49 |
| 游憩与生态旅游 | 1.22 | 0.73 | 0.71 | 0.15 |
文中图表均由作者绘制。
| [1] |
COSTANZA R, D’ARGE R, DE GROOT R, et al. The Value of the World’s Ecosystem Services and Natural Capital[J]. Nature, 1997, 387: 253-260.
|
| [2] |
Millennium Ecosystem Assessment. Ecosystems and Human Well-Being: Wetlands and Water[M]. Washington: World Resources Institute, 2005.
|
| [3] |
EADENS L M, JACOBSON S K, STEIN T V, et al. Stakeholder Mapping for Recreation Planning of a Bahamian National Park[J]. Society and Natural Resources, 2009, 22(2): 111-127.
|
| [4] |
罗琦, 甄霖, 杨婉妮, 等. 生态治理工程对锡林郭勒草地生态系统文化服务感知的影响研究[J]. 自然资源学报, 2020, 35(1): 119-129.
LUO Q, ZHEN L, YANG W N, et al. The Influence of Ecological Restoration Projects on Cultural Ecosystem Services in the Xilin Gol Grassland[J]. Journal of Natural Resources, 2020, 35(1): 119-129.
|
| [5] |
王敏, 邱明, 汪洁琼, 等. 基于重要性—绩效表现分析的上海苏州河滨水空间文化性生态系统服务供需关系分析与优化[J]. 风景园林, 2019, 26(10): 107-112.
WANG M, QIU M, WANG J Q, et al. The Supply-Demand Relation Analysis and Improvements Based on Importance-Performance Analysis of Cultural Ecosystem Services in Waterfront Areas Along the Suzhou Creek in Shanghai[J]. Landscape Architecture, 2019, 26(10): 107-112.
|
| [6] |
INIESTA-ARANDIA I, GARCÍA-LLORENTE M, AGUILERA P A, et al. Socio-cultural Valuation of Ecosystem Services: Uncovering the Links Between Values, Drivers of Change, and Human Well-Being[J]. Ecological Economics, 2014, 108: 36-48.
|
| [7] |
NAHUELHUAL L, CARMONA A, LOZADA P, et al. Mapping Recreation and Ecotourism as a Cultural Ecosystem Service: An Application at the Local Level in Southern Chile[J]. Applied Geography, 2013, 40: 71-82.
|
| [8] |
RICHARDS D R, FRIESS D A. A Rapid Indicator of Cultural Ecosystem Service Usage at a Fine Spatial Scale: Content Analysis of Social Media Photographs[J]. Ecological Indicators, 2015, 53: 187-195.
|
| [9] |
SHERROUSE B C, SEMMENS D J. Validating a Method for Transferring Social Values of Ecosystem Services Between Public Lands in the Rocky Mountain Region[J]. Ecosystem Services, 2014, 8: 166-177.
|
| [10] |
朱亚茹, 高峻, 邴振华, 等. 基于参与式制图方法的景观服务评估与空间结构研究[J]. 地球信息科学学报, 2020, 22(5): 1106-1119.
ZHU Y R, GAO J, BING Z H, et al. Using Participatory Mapping to Assess Landscape Services in Jiuzhaigou National Reserve[J]. Journal of Geo-information Science, 2020, 22(5): 1106-1119.
|
| [11] |
郑善文, 马默衡, 李海龙, 等. 居民福祉视角下城市中心区生态空间文化服务评价: 以北京为例[J]. 城市发展研究, 2021, 28(4): 21-27.
ZHENG S W, MA M H, LI H L, et al. Evaluation of Eco-spatial Culture Ecosystem Service in Urban Central District: Case Study of Beijing[J]. Urban Development Studies, 2021, 28(4): 21-27.
|
| [12] |
韩依纹, 戴菲. 城市绿色空间的生态系统服务功能研究进展: 指标、方法与评估框架[J]. 中国园林, 2018, 34(10): 55-60.
HAN Y W, DAI F. Review of Study on Ecosystem Services Function of Urban Green Spaces: Indicators, Methods and Assessment Framework[J]. Chinese Landscape Architecture, 2018, 34(10): 55-60.
|
| [13] |
中华人民共和国住房和城乡建设部.城市绿地分类标准: CJJ/T85-2017[S].北京: 中国建筑工业出版社, 2017.
Ministry of Housing and Urban-Rural Development of the People’s Republic of China. Standard for Classification of Urban Green Space: CJJ/T85-2017[S]. Beijing: China Architecture & Building Press, 2017.
|
| [14] |
姜芊孜, 王广兴, 梁雪原, 等. 基于网络评论数据分析的城市公园生态系统文化服务感知研究[J]. 景观设计学(中英文), 2022, 10(5): 32-51.
JIANG Q Z, WANG G X, LIANG X Y, et al. Research on the Perception of Cultural Ecosystem Services in Urban Parks via Analyses of Online Comment Data[J]. Landscape Architecture Frontiers, 2022, 10(5): 32-51.
|
/
| 〈 |
|
〉 |