
Association and Interaction Between Built Environment and Outdoor Jogging Based on Crowdsourced Geographic Information
|
YANG Wei (Tujia), Ph.D. is an associate professor in the School of Management Science and Real Estate, Chongqing University. His research focuses on trajectory big data mining, behavior health, urban computing, and GeoAI |
|
HU Jie, Master, is an assistant research fellow in the Committee of Housing and Urban-Rural Development of Rongchang District, Chongqing. Her research focuses on trajectory data analysis, urban planning and design |
|
LIU Yong, Ph.D., is a professor in the School of Management Science and Real Estate, Chongqing University. His research focuses on land resource management, urban ecology, and urban geography |
Received date: 2023-10-12
Online published: 2025-12-15
Copyright
[Objective] Outdoor jogging has been gaining popularity worldwide thanks to its various health, social and environmental benefits. Optimizing the design of urban built environment is an effective way to promote outdoor jogging activities for urban residents. To achieve this, it is necessary to clarify the association and interaction between urban built environment and outdoor jogging activities. However, the existing research mainly focuses on the independent effects of single factors on jogging activities, while neglecting the interactive effects between built environment factors and the spatio-temporal differences in their impacts. To this end, this research aims to analyze the association and interaction between urban built environment and jogging behavior, so as to provide a scientific basis for creating a human-friendly living environment.
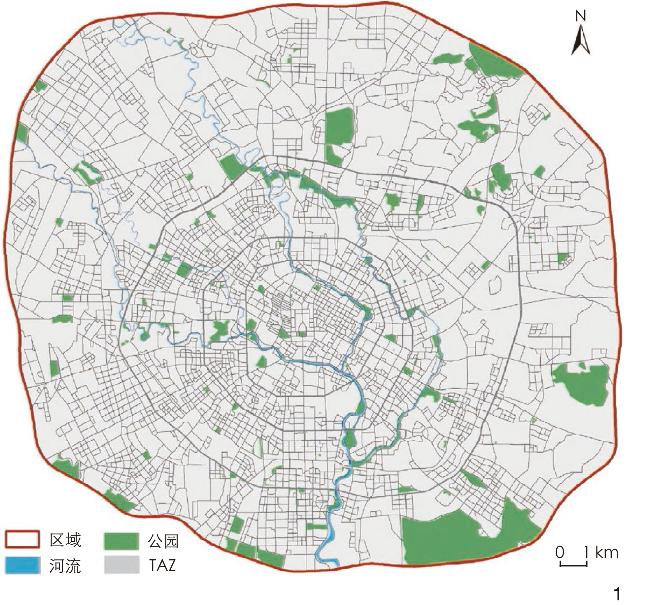
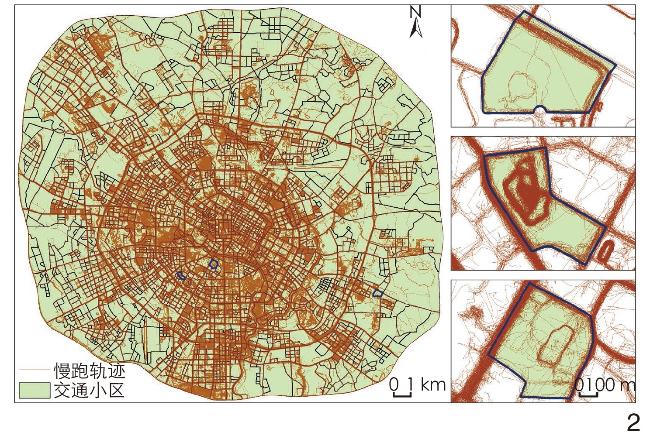
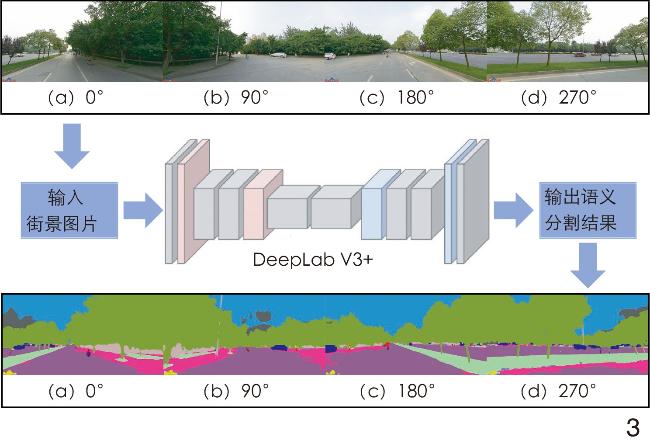
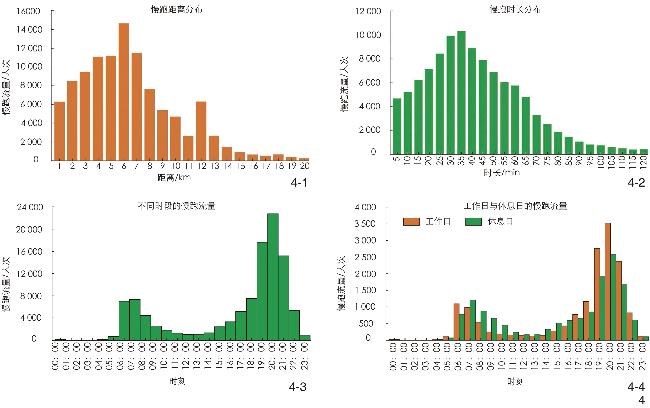
[Methods] Firstly, this research utilizes crowdsourced geographic information to measure outdoor jogging activities and urban built environments at a large scale. Specifically, jogging flow is calculated with jogging GPS trajectory data collected from the Edooon sport app. Eight built environment factors selected from the three dimensions of attractiveness, vibrancy and accessibility are calculated using multi-source spatial data, such as Baidu street view images, point of interest (POI) data and road data. Secondly, the Geographic Detector model is employed to investigate the associations and interactions between built environment factors and jogging behaviors. Thirdly, jogging flow is categorized into three types (morning peak, night peak and off-peak) at hourly scale, two types (weekdays and weekends) at daily scale, and four types (residential, commercial, industrial and recreational) based on land use type. Then, the variations in the aforesaid associations and interactions are explored and analyzed from the perspective of different time and different land use types with the Geographic Detector model.
[Results] Empirical analysis is conducted with real jogging-related GPS trajectory data recorded by the sports app of 9,860 users in Chengdu City, China. Results show that population density, land use mix, and density of public transit station are core factors determining the spatial distribution of outdoor jogging. Across different time scales, the eight built environment factors, including green view index (GVI), normalized difference vegetation index (NDVI), park density, population density, land use mix, retail store density, road intersection density and bus stop density, have a significant impact on jogging activities. The explanatory power of different built environment factors varies significantly across different land use types. For example, the impact of park density on jogging is significantly greater in recreational land than in industrial or commercial land. Nevertheless, for industrial land, only three indicators, namely population density, land use mix, and accessibility, have significant impacts on outdoor jogging. Significantly, the explanatory power of interacted built environment factors for jogging flow is greater than that of single factors. This indicates that the differences in spatial distribution of jogging flow result from the combined effects of multiple built environment factors. The interaction between population density and land use mix explains the spatial variation of jogging activities to an extent of 50%. The interactive effects of some environmental factors on jogging may change over time and land use types. For instance, during morning peak period, outdoor jogging is more affected by the interaction of park density, GVI, and land use diversity in Chengdu. In contrast, outdoor jogging during the evening peak period is mainly affected by the interaction of population density, bus stop density, and land use diversity. The core interacting factors affecting the distribution of jogging flow in residential and commercial areas are population density and land use mix. In contrast, the core interacting factors in recreational and industrial areas are land use mix and park density. The interactive effects between population density/land use mix and other built environment factors may be synergistically enhanced, and the explanatory power of these core interaction factors varies over space and time. For example, after the interaction of two built environment factors, the explanatory power may increase by more than 10% in commercial land, 20% in industrial land, while only around 7% in residential land. These differential impacts will help planners formulate targeted design strategies for environmental intervention.
[Conclusion] This research utilizes crowdsourced geographic information and a geographic detector model to establish multiple detection models, identifying the dominant built environment factors affecting outdoor jogging activities and quantitatively measuring the interactive effects of different built environment factors. Crowdsourced geographic information provides a new, extensive, and cost-effective means for measuring human activities and built environment characteristics. The interactive effects of multiple built environment factors on outdoor jogging activities are greater than those of single factors, exhibiting both dual-factor enhancement and nonlinear enhancement effects. Moreover, the interactive effects of built environment factors on outdoor jogging vary with time and land use types. This variability reflects the behavioral decisions of urban residents under the constraints of multiple scenarios, such as time (e.g., leisure time, commuting time), space (e.g., location), infrastructure (e.g., transportation infrastructure, sports facilities), and environment (e.g., visual environment, safety). A systematic analysis of the interactions between built environment and outdoor jogging may support health-oriented urban design.
YANG Wei , HU Jie , LIU Yong . Association and Interaction Between Built Environment and Outdoor Jogging Based on Crowdsourced Geographic Information[J]. Landscape Architecture, 2024 , 31(4) : 44 -52 . DOI: 10.3724/j.fjyl.202310120460
表1 指标分类及其信息描述Tab. 1 Indicator classification and description |
| 类别 | 指标名称 | 解释说明 | |
|---|---|---|---|
| 因变量 | 慢跑流量 | TAZ内慢跑轨迹数量 | |
| 自变量 | 吸引力 | GVI(X 1) | TAZ 1 km缓冲区内街景采样点的绿视率均值 |
| NDVI(X 2) | TAZ 1 km缓冲区内NDVI均值 | ||
| 公园密度(X 3) | TAZ 1 km缓冲区内单位面积公园数量 | ||
| 活力度 | 人口密度(X 4) | TAZ 1 km缓冲区内单位面积手机用户数量 | |
| 土地利用混合度(X 5) | TAZ 1 km缓冲区内居住、工业、商业、休闲娱乐4类POI的信息熵 | ||
| 零售店密度(X 6) | TAZ 1 km缓冲区内单位面积零售店POI数量 | ||
| 可达性 | 道路交叉口密度(X 7) | TAZ 1 km缓冲区内单位面积道路交叉口数量 | |
| 公交站密度(X 8) | TAZ 1 km缓冲区内单位面积公交站数量 | ||
表2 交互探测中的因子关系Tab. 2 The relation of factor in interaction detection |
| 因子关系 | 交互作用 |
|---|---|
| $ q ( {x}_{\text{1}}\cap {x}_{2} ) < Min\left\{q ( {x}_{1} ) ,q ( {x}_{2} )\right\} $ | 非线性减弱 |
| $ \begin{array}{c} Min\left\{q ( {x}_{1} ) ,q ( {x}_{2} )\right\} < q ( {x}_{\text{1}}\cap {x}_{2} ) < \\ Max\left\{q ( {x}_{1} ) ,q ( {x}_{2} )\right\} \end{array}$ | 单因子非线性 减弱 |
| $ q ( {x}_{\text{1}}\cap {x}_{2} ) > Max\left\{q ( {x}_{1} ) ,q ( {x}_{2} )\right\} $ | 双因子增强 |
| $ q ( {x}_{\text{1}}\cap {x}_{2} )=Max\left\{q ( {x}_{1} ) ,q ( {x}_{2} )\right\} $ | 独立 |
| $ q ( {x}_{\text{1}}\cap {x}_{2} ) > q ( {x}_{1} )+q ( {x}_{2} ) $ | 非线性增强 |
表3 建成环境因子与慢跑总流量的因子探测结果Tab. 3 Factor detection results between built environment factors and total jogging flow |
| 指标类型 | 指标 | q值 | p值 |
|---|---|---|---|
| 吸引力 | GVI | 0.1135 | 0 |
| NDVI | 0.0829 | 0 | |
| 公园密度 | 0.2468 | 0 | |
| 活力度 | 人口密度 | 0.4230 | 0 |
| 土地利用混合度 | 0.4149 | 0 | |
| 零售店密度 | 0.2534 | 0 | |
| 可达性 | 道路交叉口密度 | 0.1978 | 0 |
| 公交站密度 | 0.3757 | 0 |
表4 建成环境因子与慢跑总流量的交互探测结果Tab. 4 Interaction detection results between built environment factors and total jogging flow |
| 因子 | X 1 | X 2 | X 3 | X 4 | X 5 | X 6 | X 7 | X 8 |
|---|---|---|---|---|---|---|---|---|
| X 1 | 0.113 5 | |||||||
| X 2 | 0.223 9 | 0.082 9 | ||||||
| X 3 | 0.314 2 | 0.301 8 | 0.246 8 | |||||
| X 4 | 0.481 8 | 0.431 6 | 0.466 4 | 0.423 0 | ||||
| X 5 | 0.473 9 | 0.436 1 | 0.486 5 | 0.498 8 | 0.414 9 | |||
| X 6 | 0.383 8 | 0.283 4 | 0.387 2 | 0.456 1 | 0.498 1 | 0.253 4 | ||
| X 7 | 0.332 6 | 0.234 0 | 0.363 9 | 0.452 1 | 0.491 3 | 0.306 7 | 0.197 8 | |
| X 8 | 0.4439 | 0.394 2 | 0.431 2 | 0.466 4 | 0.486 5 | 0.387 2 | 0.363 9 | 0.375 7 |
表5 不同时间段下的因子探测结果Tab. 5 Factor detection results at different periods |
| 指标类型 | 指标 | 早高峰 | 晚高峰 | 非高峰 | 工作日 | 休息日 |
|---|---|---|---|---|---|---|
| 吸引力 | GVI | 0.1163 | 0.1093 | 0.1025 | 0.1160 | 0.1045 |
| NDVI | 0.0462 | 0.0946 | 0.0790 | 0.0873 | 0.0686 | |
| 公园密度 | 0.2182 | 0.2602 | 0.2039 | 0.2482 | 0.2408 | |
| 活力度 | 人口密度 | 0.3179 | 0.4725 | 0.3859 | 0.4364 | 0.3820 |
| 土地利用混合度 | 0.3245 | 0.4521 | 0.3605 | 0.4226 | 0.3857 | |
| 零售店密度 | 0.1830 | 0.2910 | 0.2126 | 0.2626 | 0.2254 | |
| 可达性 | 道路交叉口密度 | 0.1420 | 0.2405 | 0.1476 | 0.2048 | 0.1761 |
| 公交站密度 | 0.2560 | 0.4382 | 0.3180 | 0.3896 | 0.3322 |
表6 不同时间段下的因子交互结果(部分)Tab. 6 Factor interaction results at different periods (partial) |
| 早高峰 | 晚高峰 | 非高峰 | 工作日 | 休息日 | |||||||||
|---|---|---|---|---|---|---|---|---|---|---|---|---|---|
| 交互 | q值 | 交互 | q值 | 交互 | q值 | 交互 | q值 | 交互 | q值 | ||||
| X 3∩X 5 | 0.401 9 | X 4∩X 5 | 0.549 8 | X 5∩X 7 | 0.455 6 | X 4∩X 5 | 0.510 7 | X 5∩X 7 | 0.469 1 | ||||
| X 1∩X 5 | 0.394 2 | X 5∩X 8 | 0.535 1 | X 5∩X 6 | 0.447 7 | X 5∩X 6 | 0.506 2 | X 5∩X 6 | 0.466 6 | ||||
| X 5∩X 6 | 0.392 5 | X 5∩X 6 | 0.534 9 | X 4∩X 5 | 0.446 4 | X 5∩X 7 | 0.496 4 | X 4∩X 5 | 0.460 7 | ||||
| X 5∩X 7 | 0.388 5 | X 5∩X 7 | 0.526 4 | X 5∩X 8 | 0.431 2 | X 1∩X 4 | 0.494 5 | X 3∩X 5 | 0.458 6 | ||||
表7 不同土地利用类型下的因子探测结果Tab. 7 Factor detection results under different land use types |
| 指标类型 | 指标 | 居住 | 商业 | 工业 | 休闲娱乐 |
|---|---|---|---|---|---|
| 吸引力 | GVI | 0.1306 | 0.1965 | 0.0237 | 0.1069 |
| NDVI | 0.0753 | 0.1399 | 0.0692 | 0.1042 | |
| 公园密度 | 0.2065 | 0.2585 | 0.1192 | 0.3958 | |
| 活力度 | 人口密度 | 0.4061 | 0.5097 | 0.3206 | 0.5075 |
| 土地利用混合度 | 0.4026 | 0.4234 | 0.3546 | 0.4994 | |
| 零售店密度 | 0.2175 | 0.3797 | 0.1393 | 0.3000 | |
| 可达性 | 道路交叉口密度 | 0.1810 | 0.2311 | 0.1936 | 0.2737 |
| 公交站点密度 | 0.3605 | 0.4509 | 0.3037 | 0.4949 |
表8 不同土地利用类型下的因子交互结果(部分)Tab. 8 Factor interaction results under different land use types (partial) |
| 居住 | 商业 | 工业 | 休闲娱乐 | |||||||
|---|---|---|---|---|---|---|---|---|---|---|
| 交互 | q值 | 交互 | q值 | 交互 | q值 | 交互 | q值 | |||
| X 4∩X 5 | 0.477 6 | X 4∩X 5 | 0.636 4 | X 3∩X 5 | 0.539 1 | X 3∩X 5 | 0.642 6 | |||
| X 3∩X 5 | 0.477 5 | X 5∩X 6 | 0.620 2 | X 1∩X 5 | 0.527 8 | X 1∩X 5 | 0.629 7 | |||
| X 5∩X 6 | 0.477 4 | X 5∩X 8 | 0.619 6 | X 2∩X 5 | 0.520 0 | X 4∩X 5 | 0.606 1 | |||
| X 1∩X 4 | 0.466 5 | X 1∩X 4 | 0.618 4 | X 5∩X 6 | 0.473 8 | X 1∩X 4 | 0.603 6 | |||
文中图表均由作者绘制。
| [1] |
姜玉培, 甄峰, 王文文, 等. 城市建成环境对居民身体活动的影响研究进展与启示[J]. 地理科学进展, 2019, 38 (3): 357-369.
JIANG Y P, ZHEN F, WANG W W, et al. Influence of Urban Built Environment on Residents’ Physical Activity: Review and Implications[J]. Progress in Geography, 2019, 38 (3): 357-369.
|
| [2] |
BARNEET A, SHAW J E, MARTINO E, et al. Associations of Neighbourhood Environmental Attributes and Socio-economic Status with Health-Related Quality of Life in Urban Mid-aged and Older Adults: Mediation by Physical Activity and Sedentary Behavior[J]. Cities, 2023, 142: 104538.
|
| [3] |
张延吉, 陈小辉, 赵立珍, 等. 城市建成环境对居民体力活动的影响: 以福州市的经验研究为例[J]. 地理科学, 2019, 39 (5): 779-787.
ZHANG Y J, CHEN X H, ZHAO L Z, et al. The Impact of Urban Built Environment on Residents’ Physical Activity: Based on the Empirical Research in Fuzhou City[J]. Scientia Geographica Sinica, 2019, 39 (5): 779-787.
|
| [4] |
DONG L, JIANG H C, LI W J, et al. Assessing Impacts of Objective Features and Subjective Perceptions of Street Environment on Running Amount: A Case Study of Boston[J]. Landscape and Urban Planning, 2023, 235: 104756.
|
| [5] |
LIU Y, LI Y P, YANG W, et al. Exploring Nonlinear Effects of Built Environment on Jogging Behavior Using Random Forest[J]. Applied Geography, 2023, 156: 102990.
|
| [6] |
COOK S. Geographies of Run-Commuting in the UK[J]. Journal of Transport Geography, 2021, 92: 103038.
|
| [7] |
崔喆, 何莲娜, 吴兰若, 等. 用脚投票: 基于个体轨迹的北京市跑步空间绩效评估与诊断研究[J]. 规划师, 2023, 39 (5): 68-75.
CUI Z, HE L N, WU R L, et al. Vote by Foot: Running Space Performance Evaluation and Diagnosis Based on Individual Tracking in Beijing[J]. Planners, 2023, 39 (5): 68-75.
|
| [8] |
黄邓楷, 袁磊. 跑步频率与街区环境特征关联研究: 基于街景图片和公众参与地理信息系统视角[J]. 南方建筑, 2023 (4): 69-78.
HUANG D K, YUAN L. The Correlation between Running Frequency and Environmental Characteristics: A Case Study from the Perspective of Street View Images and Public Participation GIS[J]. South Architecture, 2023 (4): 69-78.
|
| [9] |
HUANG D K, TIAN M, YUAN L. Sustainable Design of Running Friendly Streets: Environmental Exposures Predict Runnability by Volunteered Geographic Information and Multilevel Model Approaches[J]. Sustainable Cities and Society, 2023, 89: 104336.
|
| [10] |
YANG W, HU J, LIU Y, et al. Examining the Influence of Neighborhood and Street-Level Built Environment on Fitness Jogging in Chengdu, China: A Massive GPS Trajectory Data Analysis[J]. Journal of Transport Geography, 2023, 108: 103575.
|
| [11] |
陶印华, 柴彦威, 杨婕. 城市居民健康生活方式研究的时空行为视角[J]. 人文地理, 2021, 36 (1): 22-229.
TAO Y H, CHAI Y W, YANG J. Understanding Healthy Lifestyles for Urban Residents from the Perspective of Space-Time Behaviors[J]. Human Geography, 2021, 36 (1): 22-229.
|
| [12] |
ETTEMA D. Runnable Cities: How Does the Running Environment Influence Perceived Attractiveness, Restorativeness, and Running Frequency?[J]. Environment and Behavior, 2016, 48 (9): 1127-1147.
|
| [13] |
TITZE S, STRONEGGER W, OWEN N. Prospective Study of Individual, Social, and Environmental Predictors of Physical Activity: Women’s Leisure Running[J]. Psychology of Sport and Exercise, 2005, 6 (3): 363-376.
|
| [14] |
赵晓龙, 汤奕子, 卞晴, 等. 基于公众参与地理信息系统的城市绿地体力活动与建成环境特征相关性研究: 以哈尔滨市为例[J]. 风景园林, 2021, 28 (3): 101-106.
ZHAO X L, TANG Y Z, BIAN Q, et al. Identification of Correlation Between Physical Activity of Green Space and Built Environment Characteristics Based on PPGIS: A Case Study of Harbin[J]. Landscape Architecture, 2021, 28 (3): 101-106.
|
| [15] |
来源. 面向绿色基础设施的城市信息学: 纽约市行道树数据收集、分析与公众科学的综合研究[J]. 风景园林, 2021, 28 (1): 17-30.
LAI Y. Urban Informatics for Green Infrastructure: An Integrated Approach for Street Trees Data Collection, Analytics, and Citizen Science in New York City[J]. Landscape Architecture, 2021, 28 (1): 17-30.
|
| [16] |
杨俊, 由浩琳, 张育庆, 等. 从传统数据到大数据+的人居环境研究进展[J]. 地理科学进展, 2020, 39 (1): 166-176.
YANG J, YOU H L, ZHANG Y Q, et al. Research Progress on Human Settlements: From Traditional Data to Big Data[J]. Progress in Geography, 2020, 39 (1): 166-176.
|
| [17] |
NORMAN P, PICKERING C M, CASTLEY G. What can Volunteered Geographic Information Tell Us About the Different Ways Mountain Bikers, Runners and Walkers Use Urban Reserves?[J]. Landscape and Urban Planning, 2019, 185: 180-190.
|
| [18] |
JIANG H C, DONG L, QING B. How Are Macro-scale and Micro-scale Built Environments Associated with Running Activity? The Application of Strava Data and Deep Learning in Inner London[J]. ISPRS International Journal of Geo-Information, 2022, 11 (10): 504.
|
| [19] |
YANG L C, YU B J, LIANG P P, et al. Crowdsourced Data for Physical Activity-Built Environment Research: Applying Strava Data in Chengdu, China[J]. Frontiers in Public Health, 2022, 10: 883177.
|
| [20] |
TIAN Z S, YANG W, ZHANG T, et al. Characterizing the Activity Patterns of Outdoor Jogging Using Massive Multi-aspect Trajectory Data[J]. Computers, Environment and Urban Systems, 2022, 95: 101804.
|
| [21] |
LIU Y, HU J, YANG W, et al. Effects of Urban Park Environment on Recreational Jogging Activity Based on Trajectory Data: A Case of Chongqing, China[J]. Urban Forestry & Urban Greening, 2022, 67: 127443.
|
| [22] |
TABATABAIE S, LITT J S, MULLER B H. Sidewalks, Trees and Shade Matter: A Visual Landscape Assessment Approach to Understanding People’s Preferences for Walking[J]. Urban Forestry & Urban Greening, 2023, 84: 127931.
|
| [23] |
刘晔, 何嘉锐, 王若宇, 等. 城市绿色空间对心理健康的影响: 研究进展与展望[J]. 热带地理, 2023, 43 (9): 1747-1759.
LIU Y, HE J R, WANG R Y, et al. The Impact of Urban Green Space on Mental Wellbeing: Research Progress and Recommendations[J]. Tropical Geography, 2023, 43 (9): 1747-1759.
|
| [24] |
杨振山, 张慧, 丁悦, 等. 城市绿色空间研究内容与展望[J]. 地理科学进展, 2015,34 (1): 18-29.
YANG Z S, ZHANG H, DING Y, et al. Progress and Prospect on Urban Green Space Research[J]. Progress in Geography, 2015,34 (1): 18-29.
|
| [25] |
司睿, 林姚宇, 肖作鹏, 等. 基于街景数据的建成环境与街道活力时空分析: 以深圳福田区为例[J]. 地理科学, 2021, 41 (9): 1536-1545.
SI R, LIN Y Y, XIAO Z P, et al. Spatio-Temporal Analysis of Built Environment and Street Vitality Relationship Based on Street-Level Imagery: A Case Study of Futian District, Shenzhen[J]. Scientia Geographica Sinica, 2021, 41 (9): 1536-1545.
|
| [26] |
YUAN Y, WANG R Y, NIU T, et al. Using Street View Images and a Geographical Detector to Understand How Street-Level Built Environment is Associated with Urban Poverty: A Case Study in Guangzhou[J]. Applied Geography, 2023, 156: 102980.
|
| [27] |
王劲峰, 徐成东. 地理探测器: 原理与展望[J]. 地理学报, 2017, 72 (1): 116-134.
WANG J F, XU C D. Geodetector: Principle and Prospective[J]. Acta Geographic Sinica, 2017, 72 (1): 116-134.
|
| [28] |
周艳, 邵海雁, 靳诚. 基于大数据的厦门岛建成环境对共享单车起讫点分布的影响[J]. 南京师大学报(自然科学版), 2023, 46 (4): 1-12.
ZHOU Y, SHAO H Y, JIN C. The Impact of Built Environment on Distribution of Bike-Sharing in Xiamen Island Based on Big Data[J]. Journal of Nanjing Normal University (Natural Science Edition), 2023, 46 (4): 1-12.
|
| [29] |
高楹, 宋辞, 郭思慧, 等. 接驳地铁站的共享单车源汇时空特征及其影响因素[J]. 地球信息科学学报, 2021, 23 (1): 155-170.
GAO Y, SONG C, GUO S H, et al. Spatial-Temporal Characteristics and Influencing Factors of Source and Sink of Dockless Sharing Bicycles Connected to Subway Stations[J]. Journal of Geo-information Science, 2021, 23 (1): 155-170.
|
| [30] |
罗桑扎西, 甄峰. 基于手机数据的城市公共空间活力评价方法研究: 以南京市公园为例[J]. 地理研究, 2019, 38 (7): 1594-1608.
LUO S Z X, ZHEN F. How to Evaluate Public Space Vitality Based on Mobile Phone Data: An Empirical Analysis of Nanjing’s Parks[J]. Geographical Research, 2019, 38 (7): 1594-1608.
|
| [31] |
LI X, SANTI P, COURTNEY T K, et al. Investigating the Association Between Streetscapes and Human Walking Activities Using Google Street View and Human Trajectory Data[J]. Transactions in GIS, 2018, 22 (4): 1029-1044.
|
| [32] |
LIU K, SIU K W M, GONG X Y, et al. Where do Networks Really Work? The Effects of the Shenzhen Greenway Network on Supporting Physical Activities[J]. Landscape and Urban Planning, 2016, 152: 49-58.
|
| [33] |
YANG W, LI Y P, LIU Y, et al. Environmental Factors for Outdoor Jogging in Beijing: Insights from Using Explainable Spatial Machine Learning and Massive Trajectory Data[J]. Landscape and Urban Planning, 2024, 243: 104969.
|
/
| 〈 |
|
〉 |