
Construction of and Low-Carbon Optimization Strategies for Block-Level Carbon Emission Control Unit
|
LI Wenjie is a master student in the College of Architecture and Urban Planning, Guangzhou University. Her research focuses on carbon emission assessment, and climate adaptive planning and design |
|
ZHENG Yingsheng, Ph.D., is an associate professor in and director of the Department of Architecture, College of Architecture and Urban Planning, Guangzhou University. Her research focuses on carbon emission assessment, and climate adaptive planning and design |
|
ZHANG Qingfang is a master student in the College of Architecture and Urban Planning, Guangzhou University. Her research focuses on carbon emission assessment, and climate adaptive planning and design |
|
ZENG Qiuyun, Master, is a senior engineer in and deputy chief planner of the Urban Design Institute, Guangzhou Urban Planning and Design Company Limited. Her research focuses on carbon emission assessment, climate adaptive planning and design |
Received date: 2024-09-13
Revised date: 2025-02-21
Online published: 2025-12-14
Copyright
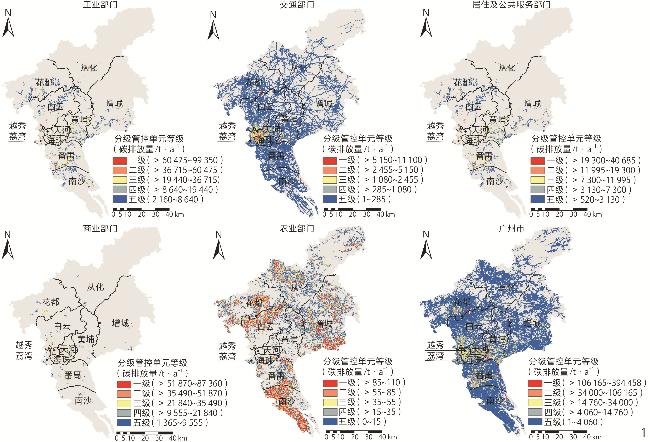
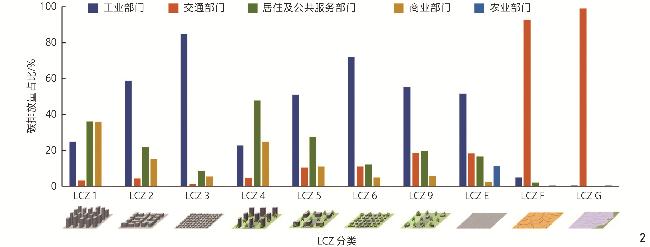
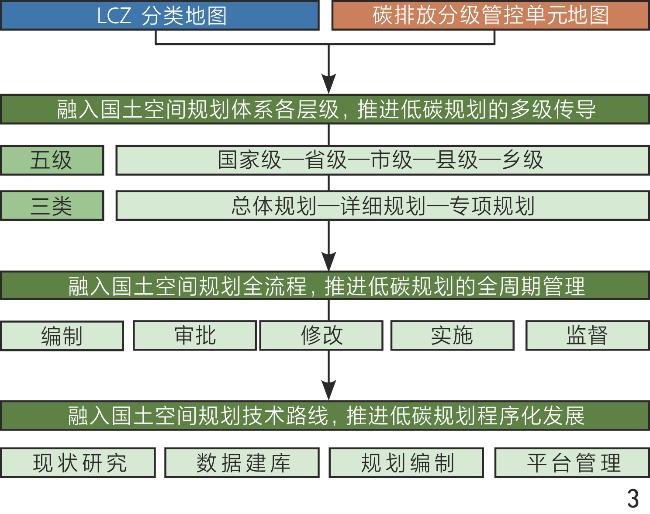
Objective Cities are the primary spatial carriers of human production and living activities, as well as concentrated areas of carbon emissions. Therefore, building low-carbon cities is crucial for advancing the carbon peaking and carbon neutrality goals. Given the spatial heterogeneity of urban morphology and carbon emissions, this research aims to develop fine-scale spatial assessment tools for carbon emissions. The research analyzes the impact of urban morphology on carbon emissions and investigates the integration of emission models with low-carbon planning strategies within the territorial spatial planning framework. The ultimate goal is to provide informational support and a decision-making foundation for low-carbon territorial spatial planning and digital green governance. By understanding the spatial distribution and sources of carbon emissions, urban planners can devise more effective interventions to mitigate urban carbon emissions. The research also addresses the gap between theoretical models and practical applications in urban planning and policymaking, and offers a framework adaptable to diverse urban contexts. Methods Based on the local climate zone (LCZ) framework, the research develops LCZ classification maps and a series of urban morphology analysis maps for Guangzhou. Furthermore, a refined spatial carbon emission assessment map is constructed using a combination of top-down and bottom-up approaches, which involves the following steps. First, by integrating planning data from the ArcGIS geographic information platform, such as data on buildings, streets, terrain, and land use, along with remote sensing and meteorological data, key urban morphology parameters, including building coverage ratio, building volume density, sky view factor, and street aspect ratio, are calculated at a grid scale of 300 m * 300 m. These parameters are then used to develop LCZ classification and urban morphology maps, providing a data foundation for spatial carbon emission modelling. Subsequently, by calculating proxy indicators such as building volume density, road area, agricultural land area, point of interest density, and population density, and combining them with energy consumption data from urban statistical yearbooks, the research spatially distributes carbon emissions across five sectors, namely the industrial, transport, residential and public services, commercial, and agricultural sectors. Based on this, a comprehensive city carbon emission map is generated. Finally, a statistical analysis is conducted to examine the spatial correlations and variations in carbon emissions across different administrative units, and a hotspot analysis is conducted to identify statistically significant carbon emission hotspots and coldspots. Results The findings reveal several key insights. 1) LCZ classification maps and carbon emission maps facilitate the identification of emission hotspots. Central business districts and industrial zones have the highest emissions due to dense construction and high economic activity, whereas suburban and peri-urban areas with more open spaces and vegetation exhibit lower emission levels. 2) The industrial sector contributes the most to carbon emissions, followed by the transport and the residential and public service sectors, and the agricultural sector has a relatively smaller but still significant impact on overall emissions. 3) Industrial carbon emission areas are primarily in peripheral industrial zones, corresponding to LCZ 9 (low-density built-up area) and LCZ 10 (heavy industrial area). Transportation carbon emission areas are mainly in Baiyun and Nansha districts, as well as central urban areas with dense road networks, corresponding to LCZ 9, LCZ 10, LCZ E (bare rock and pavement area), and LCZ F (bare soil area). Carbon emissions from the residential and public services sector and the commercial sector are dominant in central urban areas like Liwan and Yuexiu districts, corresponding to high-density LCZ types. Agricultural carbon emission areas are located in peripheral regions, corresponding to LCZ A&B (dense trees & scattered trees) and LCZ C&D (bush, shrub & low plants). 4) Urban design significantly influences carbon emissions. Areas with well-planned public transportation networks and pedestrian-friendly infrastructure report lower emissions from transportation. Green roofs, urban parks, and water bodies mitigate the urban heat island effect, reducing energy demand for cooling and thereby lowering carbon emissions. 5) There is a strong correlation between the spatial distribution of carbon emissions and urban morphology. High-density areas with concentrated human activity tend to have higher emissions, while areas with lower building density and more green space exhibit reduced emissions. 6) The emission models adopted may provide a practical guidance for urban planners in designing low-carbon cities. Key strategies include expanding green spaces, improving public transportation, and promoting energy-efficient buildings to effectively reduce carbon emissions. Conclusion The carbon emission assessment model based on LCZ effectively translates planning language into actionable insights, thus integrating into the multi-level transmission, full-process implementation, and procedural development of the territorial spatial planning system. This approach offers valuable insights into the digital governance of territorial spatial planning and the transformation towards urban green development. Ultimately, this research contributes to the literature on climate change, built environment, and public health. The research emphasizes the importance of comprehensive urban planning that incorporates both environmental sustainability and public health considerations. As the world continues to grapple with climate change challenges, the research highlights the necessity of interdisciplinary approaches to understanding and managing the complex interactions between the environment, human behaviour, and health outcomes. By leveraging these insights, urban planners and policymakers can work towards creating built environments that are resilient to climate change and promote the well-being of residents.
LI Wenjie , ZHENG Yingsheng , ZHANG Qingfang , ZENG Qiuyun . Construction of and Low-Carbon Optimization Strategies for Block-Level Carbon Emission Control Unit[J]. Landscape Architecture, 2025 , 32(4) : 71 -78 . DOI: 10.3724/j.fjyl.202409130536
| 数据类别 | 数据名称 | 年份 | 数据来源 | |
|---|---|---|---|---|
| 注:受来源限制,同一年份数据难以获取,鉴于城市结构与形态演变较缓,城市形态数据相对稳定,且Zheng等[18]验证了选择相近年份数据进行碳排放空间评估的可行性。 | ||||
| 碳排放量数据 | 统计数据 | 能量消耗统计 | 2021 | 《2021年广州市统计年鉴》[14] |
| 交通流量 | 2021 | 《2021年广州市国民经济和社会发展统计公报》[15] | ||
| 碳排放因子 | 标准煤转换碳排放因子 | 2014 | 杜昱东等[16] | |
| 交通流量转换碳排放因子 | 2011 | 封雅静等[17] | ||
| 碳排放空间评估代理数据 | 土地覆盖类型 | 2017 | 地球大数据科学工程 | |
| 土地利用类型 | 2019 | 鹏城实验室 | ||
| 三维建筑 | 2019 | 高德地图 | ||
| 城市兴趣点 | 2019 | 高德地图 | ||
| 水路、民用机场、铁路、公路等交通网络 | 2022 | OpenStreetMap | ||
| 人口密度分布 | 2021 | 美国宇航局地球观测系统数据与信息系统 | ||
表2 分部门碳排放空间差异化分配方法Tab. 2 Differentiated carbon emission space allocation methods for different sectors |
| 部门 | 空间分配因子计算方法 | 空间分配计算方法 | |
|---|---|---|---|
| 交通 | 公路 | $ {S}_{r}=\dfrac{ {P}_{r}{D}_{r} }{ {\displaystyle\sum} _{}^{}{P}_{r}{D}_{r} } $, | ${E}_{r}={E}_{{\rm{road}}}\times {S}_{r}$, |
| 式中:$ {S}_{r} $为街区 r 的公路碳排放空间分配因子;$ {P}_{r} $为街区 r 的人口 密度;$ {D}_{r} $为街区 r 的路网密度 | 式中:$ {E}_{r} $为街区r 的碳排放量;${E}_{{\rm{road}}}$为公路总碳排放量 | ||
| 水运和空运 | 当${G\bigcap {F}_{p}\ne 0 }$,$ {S}_{p}={1} $, | $ {E}_{r}={E}_{p}\times {S}_{p} $, | |
| 式中:$ {S}_{p} $为设施p (港口或机场)的碳排放空间分配因子;$ G $为街区 空间域;$ {F}_{p} $为设施p (港口或机场)的多边形地理边界 | 式中:$ {E}_{r} $为街区r 的碳排放量;$ {E}_{p} $为设施p (港口或机场)产生的总碳排放量 | ||
| 铁路 | ${S}_{{\rm{railway}}}=\dfrac{\displaystyle\sum {A}_{{\rm{railway}}} }{ {A}_{r} }$, | ${E}_{r}={E}_{{\rm{railways}}}\times \dfrac{ {S}_{{\rm{railway}}} }{\displaystyle\sum {S}_{{\rm{railway}}} }$, | |
| 式中:${S}_{{\rm{railway}}}$为街区r 的铁路排放空间分配因子,$\sum {A}_{{\rm{railway}}}$为街区r 铁路网络覆盖面积,$ {A}_{r} $为街区r 的总面积(300 m×300 m) | 式中:$ {E}_{r} $为街区r 的碳排放量;$ {E}_{railway} $ 为铁路总碳排放量;$\displaystyle\sum {S}_{{\rm{railway}}}$为所有街区铁路碳排放空间分配因子之和 | ||
| 工业、居住及公共服务、商业 | ${\rho }_{r}=\dfrac{ {\displaystyle\sum }_{k=1}^{n}({S}_{k}\times {H}_{k})}{ {A}_{r} }$, | ${E}_{r}={E}_{i}\times \dfrac{ {\rho }_{r} }{\displaystyle\sum {\rho }_{i} }$, | |
| 式中:${\rho }_{r}$为街区r 的建筑体积密度;n为街区的建筑总数;$ {S}_{k} $和$ {H}_{k} $ 分别为建筑k 的占地面积和高度;${\displaystyle\sum }_{k=1}^{n}({S}_{k}\times {H}_{k})$为街区的总建 筑体积;$ {A}_{r} $为街区r 的总面积(300 m×300 m) | 式中:$ {E}_{r} $为街区r 的碳排放量; i 为不同部门,包括工业、居住及公共服务、商业部门;$ {E}_{i} $为部门i 的总碳排放量;$\displaystyle\sum {\rho }_{i}$为部门i 的总建筑体积密度 | ||
| 农业 | ${S}_{{\rm{Agriculture}}}=\dfrac{\displaystyle\sum {A}_{{\rm{agriculture}}} }{ {A}_{r} }$, | ${E}_{r}={E}_{{\rm{agriculture}}}\times \dfrac{ {S}_{{\rm{Agriculture}}} }{\displaystyle\sum {S}_{{\rm{Agriculture}}} }$, | |
| 式中:${S}_{{\rm{Agriculture}}}$为街区r 的农业排放空间分配因子;$\displaystyle\sum {A}_{{\rm{agriculture}}}$ 为街区r 的农业用地面积;$ {A}_{r} $为街区r 的总面积(300 m×300 m) | 式中:$ {E}_{r} $为街区r 的碳排放量;${E}_{{\rm{agriculture}}}$为农业总碳排放量;$\displaystyle\sum{S}_{{\rm{Agriculture}}}$为所有街区农业排放空间分配因子之和 | ||
文中图表均由作者绘制。
| [1] |
中华人民共和国中央人民政府. 习近平出席领导人气候峰会并发表重要讲话[EB/OL].(2021-04-22)[2024-02-20].http://www.gov.cn/xinwen/2021-04/22/content_5601535.htm.
The Central People’s Government of the People’s Republic of China. Xi Jinping Attends the Leaders’ Climate Summit and Delivers an Important Speech[EB/OL].(2021-04-22)[2024-02-20].http://www.gov.cn/xinwen/2021-04/22/content_5601535.htm.
|
| [2] |
STEWART I D, OKE T R. Local Climate Zones for Urban Temperature Studies[J]. Bulletin of the American Meteorological Society, 2012, 93(12):1879-1900.
|
| [3] |
AL-JAGHBEER O, FUNG P L, PAUNU V V, et al. Mapping CO2 Traffic Emissions Within Local Climate Zones in Helsinki[J]. Urban Climate, 2024, 58:102171
|
| [4] |
MOUZOURIDES P, ELEFTHERIOU A, KYPRIANOU A, et al. Linking Local-Climate-Zones Mapping to Multi-resolution-Analysis to Deduce Associative relations at Intra-urban Scales Through an Example of Metropolitan London[J]. Urban Climate, 2019, 30:100505
|
| [5] |
CAI M, REN C, SHI Y, et al. Modeling Spatiotemporal Carbon Emissions for Two Mega-urban Regions in China Using Urban Form and Panel Data Analysis[J]. Science of the Total Environment, 2023, 857:159612
|
| [6] |
DAI H, MISCHKE P, XIE X, et al. Closing the Gap? Top-Down Versus Bottom-Up Projections of China’s Regional Energy Use and CO2 Emissions[J]. Applied Energy, 2016, 162:1355-1373.
|
| [7] |
MUNTEAN M, JANSSENS-MAENHOUT G, SONG S, et al. Trend Analysis from 1970 to 2008 and Model Evaluation of EDGARv4 Global Gridded Anthropogenic Mercury Emissions[J]. Science of the Total Environment, 2014, 494:337-350.
|
| [8] |
GAO F, WU J, XIAO J H, et al. Spatially Explicit Carbon Emissions by Remote Sensing and Social Sensing[J]. Environmental Research, 2023, 221:115257
|
| [9] |
CAI M, SHI Y, REN C. Developing a High-Resolution Emission Inventory Tool for Low-Carbon City Management Using Hybrid Method: A Pilot Test in High-Density Hong Kong[J]. Energy and Buildings, 2020, 226:110376
|
| [10] |
中华人民共和国自然资源部. 国土空间规划城市体检评估规程: TD/T 1063—2021[S]. 北京: 地质出版社, 2021.
Code of Practice for City Examination & Evaluation in Spatial Planning: TD/T 1063−2021[S]. Beijing: Geological Publishing House, 2021.
|
| [11] |
中华人民共和国生态环境部办公厅、自然资源部办公厅. 关于做好国土空间总体规划环境影响评价工作的通知[EB/OL].(2023-01-30)[2024-02-20].https://www.gov.cn/zhengce/zhengceku/2023-01/30/content_5739157.htm.
Office of the Ministry of Ecology and Environment of the People’s Republic of China, Office of the Ministry of Natural Resources of the People’s Republic of China. Notice on Strengthening Environmental Impact Assessment of Territorial Space Planning[EB/OL].(2023-01-30)[2024-02-20].https://www.gov.cn/zhengce/zhengceku/2023-01/30/content_5739157.htm.
|
| [12] |
熊健, 卢柯, 姜紫莹, 等. “碳达峰、碳中和”目标下国土空间规划编制研究与思考[J]. 城市规划学刊, 2021(4):74-80.
XIONG J, LU K, JIANG Z Y, et al. Study and Thoughts on Territorial Spatial Planning Under the Goal of “Carbon Emissions Peak and Carbon Neutrality”[J]. Urban Planning Forum, 2021(4):74-80.
|
| [13] |
中共中央国务院印发《数字中国建设整体布局规划》[J]. 自然资源通讯, 2023(4):6-8.
The Central Committee of the Communist Party of China and the State Council Issued the Overall Layout Plan for Digital China Construction[J]. National Land & Resources Information, 2023(4):6-8.
|
| [14] |
广州市统计局. 2021年广州统计年鉴[M]. 广州: 广州市统计局, 2021.
Guangzhou Municipal Bureau of Statistics. 2021 Guangzhou Statistical Yearbook[M]. Guangzhou: Gazette of the People’s Government of Guangzhou Municipality, 2021.
|
| [15] |
广州市统计局. 2021年广州市国民经济和社会发展统计公报[EB/OL].(2022-03-09)[2024-02-20].https://www.gz.gov.cn/zwgk/sjfb/tjgb/content/mpost_8156569.html.
Guangzhou Municipal Bureau of Statistics. Statistical Bulletin on the National Economic and Social Development of Guangzhou in 2021[EB/OL].(2022-03-09)[2024-02-20].https://www.gz.gov.cn/zwgk/sjfb/tjgb/content/mpost_8156569.html.
|
| [16] |
杜昱东, 刘恋, 王佳斌, 等. 基于碳排放约束的北京市社区生态效率评价[J]. 生态学报, 2023, 43(2):590-602.
DU Y D, LIU L, WANG J B, et al. Evaluation of Community’s Ecological Efficiency in Beijing Based on Carbon Emission Constraint[J]. Acta Ecologica Sinica, 2023, 43(2):590-602.
|
| [17] |
封雅静, 翟亮, 桑会勇, 等. 基于精细单元碳收支核算及变化分类方法[J]. 地球信息科学学报, 2023, 25(3):468-478.
FENG Y J, ZHAI L, SANG H Y, et al. Carbon Budget Accounting and Change Classification Based on Fine Units[J]. Journal of Geo-Information Science, 2023, 25(3):468-478.
|
| [18] |
ZHENG Y S, LI W J, JIANG L J, et al. Spatial Modelling of Street-Level Carbon Emissions with Multi-source Open Data: A Case Study of Guangzhou[J]. Urban Climate, 2024, 55:101974
|
| [19] |
ZHENG Y S, REN C, XU Y, et al. GIS-Based Mapping of Local Climate Zone in the High-Density City of Hong Kong[J]. Urban Climate, 2018, 24:419-448.
|
| [20] |
郑颖生, 李文婕, 曾秋韵, 等. 岭南高密度城市高温适应规划设计策略: 局地气候分区框架的应用[J]. 规划师, 2023, 39(6):93-98.
ZHENG Y S, LI W J, ZENG Q Y, et al. Heat Adaptive Urban Planning and Design Strategies for High-Density Cities in Southern China: The Application of Local Climate Zone Framework[J]. Planners, 2023, 39(6):93-98.
|
/
| 〈 |
|
〉 |