
Strategy for Construction and Improvement of 4R Resilience Evaluation Model for Coastal Cities
|
QIN Qixiang, Master, is a senior planner and engineer in Guangzhou Urban Planning & Design Survey Research Institute. His research focuses on urban design |
|
ZHANG Weiping, Bachelor, is a deputy director and senior engineer in Guangzhou Urban Planning & Design Survey Research Institute. His research focuses on urban design |
|
YIN Yasen, Master, is an assistant planner and assistant engineer in Guangzhou Urban Planning & Design Survey Research Institute. His research focuses on landscape planning and design |
Received date: 2024-07-17
Revised date: 2025-01-13
Online published: 2025-12-12
Copyright
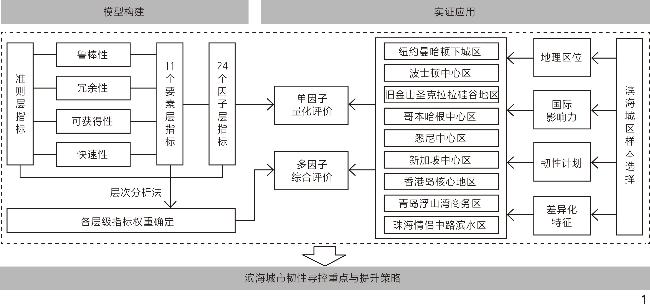
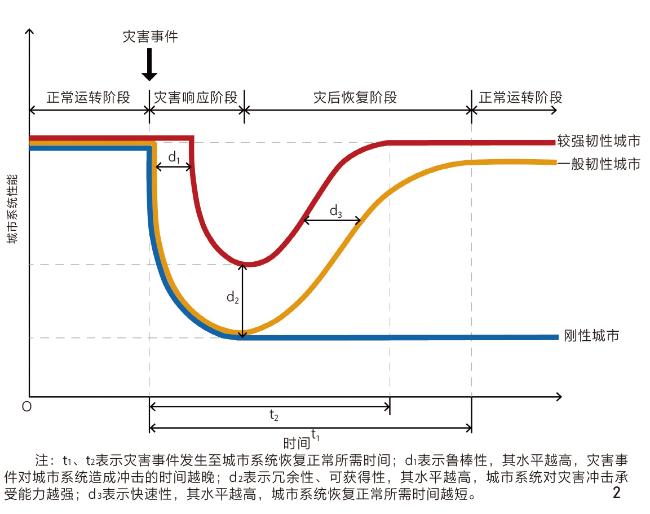
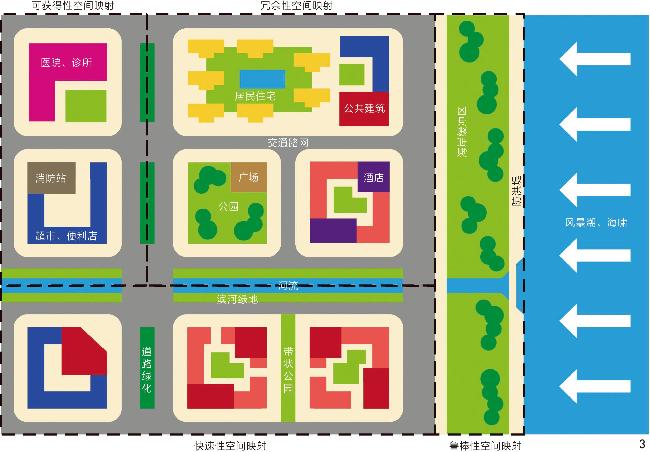
In the context of the normalization of global extreme weather, resilient design has become the focus of urban construction and urban design disciplines. Through literature review, it can be found that storm-flood resilience and sponge city are the core issues in the construction of coastal resilient cities. However, at present, there is still a lack of research on the mapping between the 4R (robustness, redundancy, resourcefulness, and rapidity) resilience characteristics and spatial elements and specific measures in urban design, or the evaluation of the performance of specific resilience strategies under different scenarios. The conduction relationship between urban resilience theory and urban design practice needs to be further rationalized and refined. Based on the perspective of urban design, this research aims to explore the correspondence between urban spatial form and stormwater resilience indicator, and put forward a research framework suitable for resilience evaluation of coastal cities.
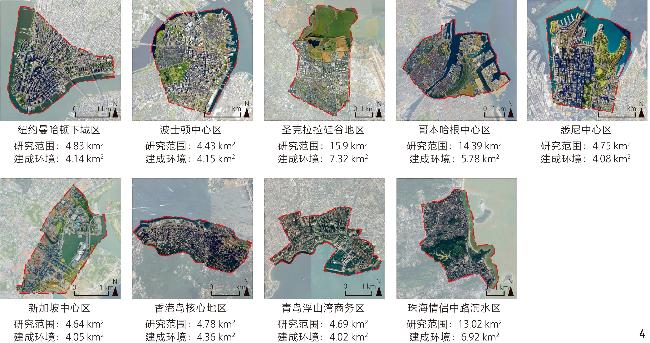
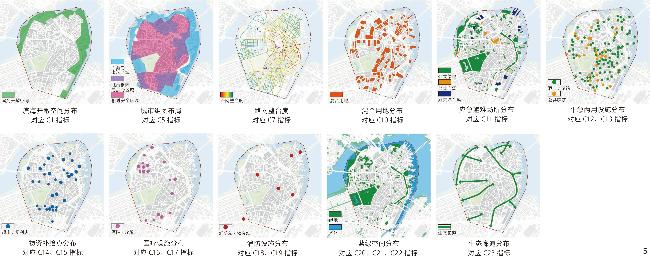
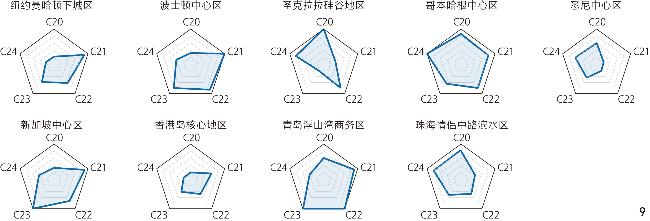
The research uses literature research, empirical research, quantitative analysis and other methods. Based on literature induction and extraction and integration of 4R resilience characteristics, a comprehensive evaluation model with 24 indicators fallen into the four categories of robustness, redundancy, resourcefulness and rapidity is constructed. According to the four principles of typicality, international influence, resilience construction experience and multi-scenario difference, 9 typical coastal city samples at home and abroad are selected in a targeted and differentiated way for a global empirical research. They are the Lower Manhattan of New York City, the central area of Boston, the Silicon Valley area of Santa Clara, the central area of Copenhagen, the central area of Sydney, the central area of Singapore, the core area of Hong Kong Island, the Fushan Bay Business District of Qingdao, and the waterfront area of Zhuhai. Then, this research analyzes how each sample above improves its 4R resilience level through urban spatial form and functional layout.
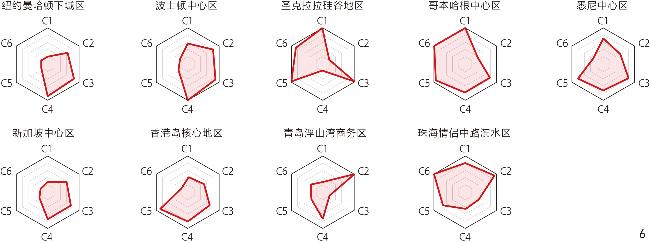
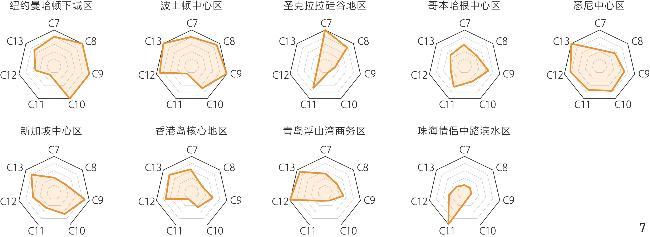
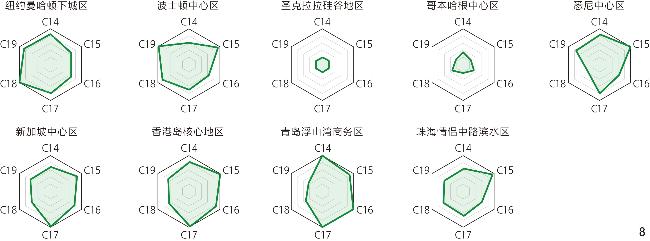
According to the analysis results, Boston is the only sample city scoring above average in all the four categories, showing a high level of overall resilience. For other cities, New York and Sydney excel in redundancy and resourcefulness. The resourcefulness and rapidity of Qingdao and Singapore contribute the most to the overall resilience level. Hong Kong attaches the highest importance to resourcefulness; Copenhagen, Santa Clara and Zhuhai need to focus on their resilience strategies in terms of robustness and rapidity. The reasons leading to the aforesaid results are mainly summarized in the following three aspects. 1) Due to dense population and land shortage, city samples with high development intensity pay more attention to spatial redundancy and resource acquisition during disasters, and their urban core functional areas have achieved full coverage of public services and emergency service facilities to a large extent through encrypted road networks, mixed land use, vertical functional layout and other ways. At the same time, reasonable division of land parcels is also conducive to the construction of green belts and green corridors in urban areas. For example, cities such as Singapore and Boston are significantly higher than other cities of the same type in terms of rapidity indicators. 2) The coastal space of city samples with low development intensity is sufficient, which can withstand and dissolve the impact of stormwater through better shoreline protection and blue-green network. These city samples have the conditions to establish a generous coastal buffer zone, which can prevent coastal storm surge from attacking the urban core area in the first time. In addition, the clear separation of internal clusters through green belt can greatly enhance their retention and filtration of rain and flood. On the contrary, due to the large land scale and low degree of development and construction, city samples with low development intensity are typically featured by relatively poor spatial redundancy and relatively sparse distribution of emergency rescue facilities. 3) There is no significant correlation between the overall performance of 4R resilience and development intensity in coastal cities, and cities with different development intensity can enhance the overall resilience level by strengthening their own advantages or appropriately compensating for weaknesses. In city samples with high development intensity, priority should be given to improving the layout of redundant units and emergency resources, and the robustness and rapidity level should be improved by broadening the coastline and connecting the greenways. In city samples with low development intensity, road network should be properly encrypted and public service facilities should be evenly distributed to ensure better coverage of resource services in the context of ecological city construction.
Through the empirical evaluation of typical coastal city samples, the guidance and control priorities and improvement strategies of coastal cities from the 4R evaluation dimensions are summarized. Coastal cities should consolidate coastal infrastructure combining resistance and buffering, strengthen three-dimensional and complex redundant functional units, build an integrated emergency rescue system spanning from coastal areas to hinterland, and improve the blue-green ecosystem by combining point, line and surface. In the future, China’s coastal cities should shore up the weakness of planning homogeneity, fully learn from excellent coastal urban construction cases at home and abroad, classify and implement policies through 4R resilience evaluation results, formulate a resilience strategy system for coastal cities in line with local environmental characteristics, and integrate such system into specific urban spatial form, functional layout and emergency management.
Key words: landscape architecture; resilient city; 4R; robustness; redundancy; resourcefulness; rapidity
QIN Qixiang , ZHANG Weiping , YIN Yasen . Strategy for Construction and Improvement of 4R Resilience Evaluation Model for Coastal Cities[J]. Landscape Architecture, 2025 , 32(3) : 100 -109 . DOI: 10.3724/j.fjyl.202407170390
表1 城市韧性评价相关文献归纳分析[4-8]Table 1 Research and analysis of relevant literature on urban resilience evaluation[4-8] |
| 年份 | 作者 | 主要内容 | 评价维度 | 文献评析 |
| 2021 | 朱诗尧[8] | 对城市抗涝韧性的度量与提升策略研究 | 压力韧性、状态韧性、响应韧性 | 评价维度侧重于社会层面,未深入涉及城市空间 |
| 2022 | 王峤等[5] | 以天津市为例,基于应对暴雨内涝的目标,开展城市建成环境韧性等级区划研究 | 坚固性、冗余性、资源可调配性、快速性 | 评价体系最完善成熟,但研究对象主要针对一般内涝城市,而非典型滨海城市 |
| 2022 | 王鑫等[7] | 以深汕特别合作区为例,开展水敏性城市研究,提出滨海地区绿色韧性空间评估方法 | 城市安全、生态安全、景观环境 | 详细介绍了韧性指标筛选方法,但未提出具体评价指标 |
| 2023 | 汪洁琼等[6] | 基于应对雨洪挑战的目标,对城市滨水码头区蓝绿空间耦合设计开展系统性研究 | 环境支撑、空间可变、风险管理 | 重点聚焦城市滨河区蓝绿空间,未深入考虑功能冗余与应急服务 |
| 2023 | 陈碧琳等[4] | 以深圳红树湾片区为例,基于洪涝韧性导向,分析高密度沿海城市适应性转型规划经验 | 景观生态空间、街道网络、街区与建筑 | 评价体系与研究对象最为契合,但对滨海岸线空间考虑较为薄弱 |
表2 滨海城市4R韧性评价模型及指标说明[4, 6-7, 10-11, 14-25]Table 2 4R resilience evaluation model and relevant indicators[4, 6-7, 10-11, 14-25] |
| 准则层 | 要素层 | 因子层 | 指标说明 | 单位 | 正负性 | 参考文献 | 全局权重 |
| A1鲁棒性 | B1岸线防护 | C1滨海开敞空间宽度 | 建成区与海岸线之间缓冲区域的平均宽度 | m | 正 | [6] | 0.056 |
| C2堤顶相对高度 | 堤顶相对海平面的平均高差 | m | 正 | [4][14] | 0.051 | ||
| C3岸线结构 | 堤岸特殊设计结构对洪水冲击力的抵消作用 | 正 | [6][15] | 0.034 | |||
| C4岸线坚固性 | 堤岸表面材质的坚固程度 | 正 | [15][16] | 0.036 | |||
| B2地形防护 | C5布局合理性 | 海啸淹没风险区之外的建成区面积与建成区总面积的比值 | 正 | [17][18] | 0.045 | ||
| B3景观防护 | C6防浪植被 | 沿岸防浪防潮植被覆盖区域长度与岸线总长度的比值 | 正 | [10] | 0.029 | ||
| A2冗余性 | B4道路连通 | C7路网密度 | 单位面积内市政道路的总长度 | km/km2 | 正 | [4][11] | 0.043 |
| C8路网整合度 | 市政交通网络体系的平均整合度 | 正 | [11][19] | 0.047 | |||
| B5功能复合 | C9建筑功能多样性 | 建成区建筑功能的香农多样性指数 | 正 | [20] | 0.040 | ||
| C10混合用地 | 混合用地面积与城市建设用地总面积的比值 | 正 | [7] | 0.026 | |||
| B6空间灵活 | C11应急避难场所 | 公共绿地、广场等开敞空间面积与建成区总面积的比值 | 正 | [10][21] | 0.036 | ||
| C12平急两用设施密度 | 单位用地面积内酒店、旅馆、公共建筑等可转化为平急两用设施的数量 | 处/km2 | 正 | [22] | 0.038 | ||
| C13平急两用设施耦合度 | 城市组团与平急两用设施的平均最近邻距离 | m | 负 | [22] | 0.040 | ||
| A3可获得性 | B7物资补给 | C14物资补给点密度 | 单位用地面积内超市、便利店等物资补给点的数量 | 处/km2 | 正 | [6][7] | 0.044 |
| C15物资补给点耦合度 | 城市组团与物资补给点的平均最近邻距离 | m | 负 | [6] | 0.047 | ||
| B8医疗服务 | C16医疗设施密度 | 单位用地面积内医院、诊所等医疗设施的数量 | 处/km2 | 正 | [10][23] | 0.045 | |
| C17医疗设施耦合度 | 城市组团与医疗设施的平均最近邻距离 | m | 负 | [23] | 0.046 | ||
| B9消防救援 | C18消防设施密度 | 单位用地面积内消防设施的数量 | 处/km2 | 正 | [21][24] | 0.039 | |
| C19消防设施耦合度 | 城市组团与消防设施的平均最近邻距离 | m | 负 | [24] | 0.042 | ||
| A4快速性 | B10蓝绿空间 | C20蓝绿空间面积 | 蓝绿空间面积与研究范围总面积的比值 | 正 | [4][25] | 0.053 | |
| C21蓝绿空间结构 | 所有蓝绿空间几何中心到最邻近斑块距离的平均值 | m | 负 | [7] | 0.044 | ||
| C22蓝绿空间耦合度 | 城市组团与蓝绿空间分布的耦合程度 | m | 负 | [6] | 0.048 | ||
| C23排水廊道密度 | 单位面积内地面生态排水廊道的总长度 | km/km2 | 正 | [23] | 0.032 | ||
| B11地表覆盖 | C24地表下渗能力 | 透水下垫面面积与城市开敞空间下垫面总面积的比值 | 正 | [10] | 0.040 |
表3 典型滨海城市样本详细信息Table 3 Details about typical coastal city samples |
| 序号 | 滨海城市 | 地理区位 | 最新国际影响力 | 韧性城市建设文件 | |||
| 称号 | 数据来源 | 文件名称 | 发布年份 | ||||
| 1 | 纽约 | 北美东海岸 | 2023全球城市竞争力第1名 | 《2023第二十二届全球(国家)城市竞争力排行榜》 | 《一个更强大、更有韧性的纽约》 | 2013 | |
| 2 | 波士顿 | 北美东海岸 | 2023全球最佳城市第2名 | 《2023年全球城市指数报告》(Global Cities Index 2023) | 《波士顿滨海城市洪灾韧性设计导则》(Coastal Flood Resilience Design Guidelines) | 2019 | |
| 3 | 旧金山 | 北美西海岸 | 2023全球最佳城市第1名 | 《2023年全球城市指数报告》(Global Cities Index 2023) | 《海平面上升行动计划》(San Francisco Sea Level Rise Action Plan) | 2016 | |
| 4 | 哥本哈根 | 北欧波罗的海门户 | 2023全球最宜居城市第2名 | 《2023年全球最宜居城市》(The World ’s Most Liveable Cities in 2023) | 《气候适应规划》(Copenhagen Climate Adaptation Plan) | 2011 | |
| 5 | 悉尼 | 澳大利亚东海岸 | 2023全球最宜居城市第4名 | 《2023年全球最宜居城市》(The World ’s Most Liveable Cities in 2023) | 《韧性悉尼:2018年城市韧性战略》(Resilient Sydney: A Strategy for City Resilience 2018) | 2018 | |
| 6 | 新加坡 | 亚洲马来半岛南端 | 2023全球城市竞争力第6名 | 《2023第二十二届全球(国家)城市竞争力排行榜》 | 《一个韧性的新加坡》 | 2019 | |
| 7 | 香港 | 亚洲珠三角沿岸 | 2023全球最佳城市第9名 | 《2023年全球城市指数报告》(Global Cities Index 2023) | 《香港韧性城市建设初步评估报告》 | 2017 | |
| 8 | 青岛 | 亚洲黄海沿岸 | 2023全球最具幸福感城市第7名 | 《2023第二十二届全球(国家)城市竞争力排行榜》 | 《青岛市适应气候变化规划》 | 2020 | |
| 9 | 珠海 | 亚洲珠三角沿岸 | 2023中国十佳宜居城市第1名 | 《2023第二十二届全球(国家)城市竞争力排行榜》 | 《珠海韧性城市发展:防洪措施建议》 | 2020 | |
表4 4R韧性评价指标原始数据Table 4 Raw data of 4R resilience evaluation indicators |
| 滨海城市样本 | C1 | C2 | C3 | C4 | C5 | C6 | C7 | C8 | C9 | C10 | C11 | C12 | C13 | C14 | C15 | C16 | C17 | C18 | C19 | C20 | C21 | C22 | C23 | C24 | C25 | C26 |
| 纽约曼哈顿下城区 | 142.1 | 2.4 | 4.3 | 4.5 | 0.90% | 11.1 | 60.00% | 40.20% | 18.3 | 177.7 | 1.3 | 78.60% | 17.70% | 16.6 | 127.5 | 8.9 | 196.5 | 4.1 | 300.9 | 1.4 | 431.0 | 19.30% | 155.1 | 89.5 | 1.8 | 15.30% |
| 波士顿中心区 | 191.0 | 2.7 | 4.5 | 5.0 | 1.30% | 15.8 | 64.40% | 42.90% | 17.9 | 163.9 | 1.3 | 54.20% | 17.30% | 31.8 | 81.1 | 5.8 | 162.3 | 3.9 | 326.9 | 1.2 | 323.2 | 21.60% | 125.8 | 69.9 | 2.5 | 19.50% |
| 圣克拉拉硅谷地区 | 250.0 | 1.5 | 5.0 | 2.0 | 0.30% | 5.4 | 92.90% | 74.30% | 21.1 | 146.5 | 0.8 | 13.40% | 26.60% | 3.6 | 211.4 | 0.6 | 250.0 | 1.1 | 511.2 | 0.2 | 950.2 | 41.70% | 298.6 | 77.8 | 0.4 | 27.30% |
| 哥本哈根中心区 | 250.0 | 1.9 | 4.2 | 4.2 | 0.30% | 5.4 | 88.90% | 80.40% | 14.4 | 85.9 | 1.1 | 37.80% | 25.10% | 10.3 | 168.6 | 2.2 | 245.0 | 2.1 | 499.1 | 0.4 | 940.2 | 37.40% | 168.6 | 74.7 | 2.0 | 31.10% |
| 悉尼中心区 | 209.2 | 2.2 | 4.2 | 4.0 | 1.90% | 20.8 | 83.80% | 45.70% | 12.4 | 106.4 | 1.1 | 60.70% | 27.10% | 28.7 | 78.8 | 8.6 | 151.9 | 3.7 | 288.9 | 0.5 | 511.6 | 29.10% | 335.3 | 124.6 | 1.3 | 23.00% |
| 新加坡中心区 | 153.5 | 2.3 | 4.0 | 4.0 | 1.20% | 17.6 | 62.50% | 41.00% | 11.8 | 76.1 | 1.2 | 50.50% | 21.90% | 19.3 | 113.9 | 6.8 | 172.7 | 4.8 | 228.9 | 0.8 | 593.5 | 22.40% | 147.5 | 81.6 | 3.2 | 19.30% |
| 香港岛核心地区 | 173.5 | 2.1 | 3.8 | 4.2 | 5.00% | 53.1 | 88.30% | 41.20% | 15.5 | 72.0 | 1.0 | 32.40% | 16.40% | 24.6 | 116.5 | 8.7 | 156.4 | 5.3 | 237.2 | 0.9 | 565.2 | 18.40% | 227.9 | 102.8 | 1.2 | 14.50% |
| 青岛浮山湾商务区 | 151.3 | 3.2 | 2.0 | 4.0 | 0.90% | 11.2 | 67.00% | 50.40% | 13.3 | 76.8 | 1.0 | 18.60% | 18.10% | 35.8 | 95.8 | 10.9 | 170.4 | 6.5 | 223.4 | 0.7 | 771.1 | 30.30% | 154.8 | 60.8 | 3.3 | 19.00% |
| 珠海情侣中路滨水区 | 223.2 | 3.0 | 2.8 | 3.0 | 1.00% | 15.4 | 81.20% | 83.20% | 8.5 | 47.1 | 0.8 | 13.50% | 32.30% | 12.2 | 204.9 | 6.9 | 163.6 | 3.7 | 332.1 | 1.1 | 632.9 | 35.80% | 277.3 | 100.2 | 1.6 | 26.30% |
| 最大值(Max) | 250.0 | 3.2 | 5.0 | 5.0 | 5.00% | 53.1 | 92.90% | 83.20% | 21.1 | 177.7 | 1.3 | 78.60% | 32.30% | 35.8 | 211.4 | 10.9 | 250.0 | 6.5 | 511.2 | 1.4 | 950.2 | 41.70% | 335.3 | 124.6 | 3.3 | 31.10% |
| 最小值(Min) | 142.1 | 1.5 | 2.0 | 2.0 | 0.30% | 5.4 | 60.00% | 40.20% | 8.5 | 47.1 | 0.8 | 13.40% | 16.40% | 3.6 | 78.8 | 0.6 | 151.9 | 1.1 | 223.4 | 0.2 | 323.2 | 18.40% | 125.8 | 60.8 | 0.4 | 14.50% |
表5 滨海城市4R韧性综合评价结果Table 5 Comprehensive evaluation results of 4R resilience of coastal cities |
| 滨海城市样本 | 鲁棒性 | 冗余性 | 可获得性 | 快速性 | 加权计算结果 |
| 注:***表示评价结果大于平均值,**表示评价结果接近平均值,*表示评价结果低于平均值。 | |||||
| 纽约曼哈顿下城区 | 2.33* | 3.80*** | 3.94*** | 2.55* | 3.20*** |
| 波士顿中心区 | 3.13** | 4.03*** | 3.91*** | 3.35*** | 3.63*** |
| 圣克拉拉硅谷地区 | 3.51*** | 2.57* | 1.00* | 3.33*** | 2.56* |
| 哥本哈根中心区 | 3.96*** | 2.61* | 1.41* | 4.20*** | 2.98* |
| 悉尼中心区 | 3.25*** | 3.57*** | 3.70*** | 2.00* | 3.18*** |
| 新加坡中心区 | 2.29* | 2.95** | 3.78*** | 3.29*** | 3.07** |
| 香港岛核心地区 | 2.92** | 2.68* | 4.15*** | 1.87* | 2.95* |
| 青岛浮山湾商务区 | 2.54* | 2.79* | 4.07*** | 3.87*** | 3.30*** |
| 珠海情侣中路滨水区 | 3.65*** | 1.72* | 3.41*** | 3.06** | 2.94* |
| 平均值 | 3.06 | 2.97 | 3.26 | 3.06 | 3.08 |
表6 滨海城市4R韧性导控重点Table 6 Priorities in guide and control of 4R resilience of coastal cities |
| 4R韧性 | 中高开发强度滨海城市导控重点 | 低开发强度滨海城市导控重点 | |||
| 主要 | 次要 | 主要 | 次要 | ||
| 鲁棒性 | 堤顶相对高度、岸线结构、岸线坚固性 | 岸线宽度、布局合理性、防浪植被占比 | 岸线宽度、布局合理性、防浪植被占比 | 堤顶相对高度、岸线结构、岸线坚固性 | |
| 冗余性 | 用地功能多样性、混合用地占比、平急两用设施密度、平急两用设施耦合度、应急避难场所占比 | 路网密度、路网整合度 | 路网密度、路网整合度、应急避难场所占比 | 用地功能多样性、混合用地占比、平急两用设施密度、平急两用设施耦合度 | |
| 可获得性 | 物资补给点密度、医疗设施密度、消防设施密度 | 物资补给点耦合度、医疗设施耦合度、消防设施耦合度 | 物资补给点耦合度、医疗设施耦合度、消防设施耦合度 | 物资补给点密度、医疗设施密度、消防设施密度 | |
| 快速性 | 排水廊道密度、蓝绿空间结构 | 蓝绿空间耦合度、蓝绿空间面积、地表下渗能力 | 蓝绿空间面积、蓝绿空间结构、蓝绿空间耦合度 | 排水廊道密度、地表下渗能力 | |
文中图表均由作者绘制。
| [1] |
田健, 曾穗平, 曾坚, 等. 基于智慧—韧性理念的滨海城市雨洪灾害防控规划方法[J]. 西部人居环境学刊, 2022, 37(6): 66-72.
TIAN J, ZENG S P, ZENG J, et al. Planning Method of Coastal City Rain Flood Disaster Prevention and Control Based on the Concept of Intelligence-Resilience[J]. Journal of Human Settlements in West China, 2022, 37(6): 66-72.
|
| [2] |
UN-HABITAT. What Is Resilience?[EB/OL]. (2023-12-04)[2024-02-01]. https://unhabitat.org/cn/node/3774.
|
| [3] |
北京市人民政府.“北京市贯彻落实党的二十大精神”系列主题新闻发布会(第十二场): “北京市韧性城市建设”专场[EB/OL].(2023-12-27)[2024-03-25]. https://www.beijing.gov.cn/shipin/Interviewlive/1012.html.
Beijing Municipal People’s Government. “Beijing Implements the Spirit of the Party’s 20 Congresses” Series of Themed Press Conference (12th): “Beijing’s Resilient City Construction” Special Session[EB/OL]. (2023-12-27)[2024-03-25]. https://www.beijing.gov.cn/shipin/Interviewlive/1012.html.
|
| [4] |
陈碧琳, 李颖龙. 洪涝韧性导向下高密度沿海城市适应性转型规划评估: 以深圳红树湾片区为例[J]. 城市规划学刊, 2023(4): 77-86.
CHEN B L, LI Y L. Flood-Resilience-Oriented Adaptive Transformative Planning and Assessment of High-Density Coastal Cities: The Case of the Mangrove Bay Area, Shenzhen[J]. Urban Planning Forum, 2023(4): 77-86.
|
| [5] |
王峤, 李含嫣, 臧鑫宇. 应对暴雨内涝的城市建成环境韧性等级区划研究: 以天津市中心城区为例[J]. 建筑学报, 2022(S2): 201-207.
WANG Q, LI H Y, ZANG X Y. A Study on the Resilience Rating of Urban Built Environment in Response to Heavy Rainfall Flooding Tianjin Central City as an Example[J]. Architectural Journal, 2022(S2): 201-207.
|
| [6] |
汪洁琼, 沈桐羽, 王敏, 等. 应对雨洪挑战的城市滨水码头区蓝绿空间耦合设计研究[J]. 园林, 2023, 40(3): 47-54.
WANG J Q, SHEN T Y, WANG M, et al. Green-Blue Spatial Coupling Design Research of Urban Docklands in Response to Flooding Challenge[J]. Landscape Architecture Academic Journal, 2023, 40(3): 47-54.
|
| [7] |
王鑫, 栾博, 祝明建, 等. 滨海地区绿色韧性空间评估方法与规划范式优化: 以深汕特别合作区韧性水敏性城市为例[J]. 城市观察, 2022(5): 97-110,162-163.
WANG X, LUAN B, ZHU M J, et al. Spatial Assessment Method and Planning Paradigm Optimization of Resilient Green Space in Coastal Areas: A Case Study of the Resilient Water-Sensitive City in the Shenzhen-Shanwei Special Cooperation Zone[J]. Urban Insight, 2022(5): 97-110,162-163.
|
| [8] |
朱诗尧.城市抗涝韧性的度量与提升策略研究: 以长三角区域城市为例[D].南京: 东南大学, 2021.
ZHU S Y. Evaluation and Improvement Strategy of Urban Flood Resilience an Example of Cities in Yangtze River Delta[D]. Nanjing: Southeast University, 2021.
|
| [9] |
NAHIDUZZAMAN K M, ALDOSARY A S, RAHMAN M T. Flood Induced Vulnerability in Strategic Plan Making Process of Riyadh City[J]. Habitat International, 2015, 49: 375-385.
|
| [10] |
耿煜周, 曾坚. 基于韧性理念的城市水系承洪优化策略: 以漳州市九十九湾流域为例[J]. 现代城市研究, 2022, 37(8): 72-78.
GENG Y Z, ZENG J. Optimization Strategy of Urban Water System Flood Bearing Function Based on the Concept of Resilience: A Case Study of Jiushijiuwan Watershed in Zhangzhou[J]. Modern Urban Research, 2022, 37(8): 72-78.
|
| [11] |
王峤, 李含嫣, 臧鑫宇, 等. 类型与等级双重限定下的雨涝韧性评估与优化[J]. 南方建筑, 2023(12): 1-10.
WANG Q, LI H Y, ZANG X Y, et al. Assessment and Optimization of Stormwater Resilience via Classification and Grading[J]. South Architecture, 2023(12): 1-10.
|
| [12] |
ZHU S, LI D, HUANG G, et al. Enhancing Urban Flood Resilience: A Holistic Framework Incorporating Historic Worst Flood to Yangtze River Delta, China[J]. International Journal of Disaster Risk Reduction, 2021, 61: 102355.
|
| [13] |
BRUNEAU M, CHANG S E, EGUCHI R T, et al. A Framework to Quantitatively Assess and Enhance the Seismic Resilience of Communities[J]. Earthquake Spectra, 2003, 19(4): 733-752.
|
| [14] |
李阳力.水生态韧性评价与规划研究: 以天津市为例[D].天津: 天津大学, 2021.
LI Y L. Research on Evaluation and Planning of Water Ecosystem Resilience: A Case Study of Tianjin[D]. Tianjin: Tianjin University, 2021.
|
| [15] |
孙丽辉, 曾娇娇, 李连盼. 基于韧性城市理念的珠海市沿海防风浪潮堤岸提升策略[J]. 园林, 2020, 37(9): 40-45.
SUN L H, ZENG J J, LI L P. Resilient Cities with Its Upgrading Strategy for Coastal Embankment in Zhuhai[J]. Landscape Architecture Academic Journal, 2020, 37(9): 40-45.
|
| [16] |
CAO F, XU X, ZHANG C, et al. Evaluation of Urban Flood Resilience and Its Space-Time Evolution: A Case Study of Zhejiang Province, China[J]. Ecological Indicators, 2023, 154: 110643.
|
| [17] |
LIU R, CHEN Y, WU J, et al. Assessing Spatial Likelihood of Flooding Hazard Using Naïve Bayes and GIS: A Case Study in Bowen Basin, Australia[J]. Stochastic Environmental Research and Risk Assessment, 2016, 30(6): 1575-1590.
|
| [18] |
刘刚, 张娟, 金娇, 等. 韧性景观理念下的城市滨海空间规划设计策略研究: 以青岛城阳区滨海绿道为例[J]. 建筑与文化, 2023(11): 132-134.
LIU G, ZHANG J, JIN J, et al. Research on Urban Coastal Space Planning and Design Strategy Under the Concept of Resilient Landscape: A Case Study of Coastal Greenway in Chengyang District, Qingdao[J]. Architecture & Culture, 2023(11): 132-134.
|
| [19] |
XU W, XIE Y, YU Q, et al. An Evaluation of Factors Influencing the Resilience of Flood-Affected Communities in China[J]. Hydrology, 2023, 10(2): 35.
|
| [20] |
栗玉鸿, 邹亮, 李利, 等. 推动海绵城市建设系统提升城市雨洪韧性[J]. 西部人居环境学刊, 2022, 37(1): 22-26.
LI Y H, ZOU L, LI L, et al. Improving Urban Stormwater Resilience by Promoting Sponge City Construction System[J]. Journal of Human Settlements in West China, 2022, 37(1): 22-26.
|
| [21] |
LUO Y, CHEN X, YAO L. Flood Disaster Resilience Evaluation of Chinese Regions: Integrating the Hesitant Fuzzy Linguistic Term Sets with Prospect Theory[J]. Natural Hazards, 2021, 105(1): 667-690.
|
| [22] |
洪琰. 以广州知识城广场为样本的公共建筑群体韧性设计策略初探[J]. 南方建筑, 2022(12): 9-17.
HONG Y. Primary Discussion on Resilience Design of Public Building Group Based on Guangzhou Knowledge City Square[J]. South Architecture, 2022(12): 9-17.
|
| [23] |
ZHANG H, YANG J, LI L, et al. Measuring the Resilience to Floods: A Comparative Analysis of Key Flood Control Cities in China[J]. International Journal of Disaster Risk Reduction, 2021, 59: 102248.
|
| [24] |
陈为公, 张娜, 张友森, 等. 基于DEMATEL-ISM的城市灾害韧性影响因素研究[J]. 灾害学, 2021, 36(1): 1-6.
CHEN W G, ZHANG N, ZHANG Y S, et al. Study on Influencing Factors of Urban Disaster Resilience Based on DEMATEL-ISM[J]. Journal of Catastrophology, 2021, 36(1): 1-6.
|
| [25] |
李可欣, 李超骕. 多维度视角下城市形态与气候韧性的关联[J]. 城乡规划, 2021(3): 20-27.
LI K X, LI C S. Exploring the Linkages of Urban Form and Climate Resilience from a Multi-dimensional Perspective[J]. Urban and Rural Planning, 2021(3): 20-27.
|
/
| 〈 |
|
〉 |