
Research on the Influence of Evolution of Landscape Patterns of Blue-Green Space on the Cooling Effect in the Central Urban Area of Xi’an
|
KONG Weiying is a master student in the College of Landscape Architecture, Northeast Forestry University. Her research focuses on urban ecosystem services |
|
LIU Yizhuo is a master student in the College of Landscape Architecture, Northeast Forestry University. Her research focuses on ecological restoration, and urban ecosystem services |
|
DONG Sicun is a master student in the College of Landscape Architecture, Northeast Forestry University. Her research focuses on urban ecosystem services |
|
HU Yuandong (Tujia), Ph.D., is an associate professor in the College of Landscape Architecture, Northeast Forestry University. His research focuses on regional landscape planning and ecological restoration, and urban ecosystem services |
Received date: 2024-08-21
Revised date: 2025-03-09
Online published: 2025-12-10
Copyright
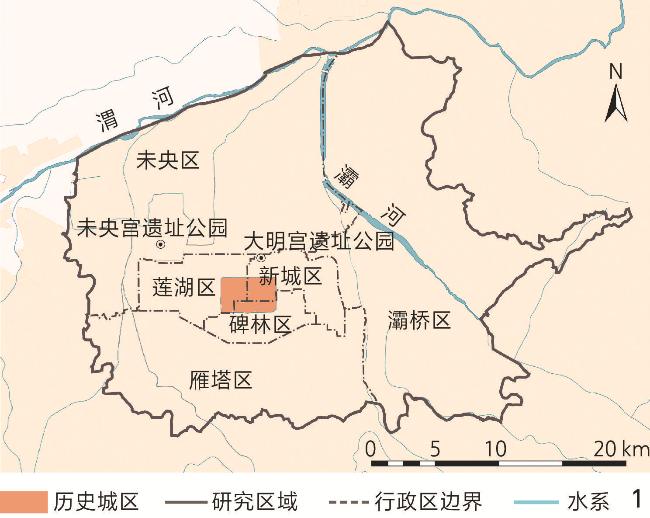
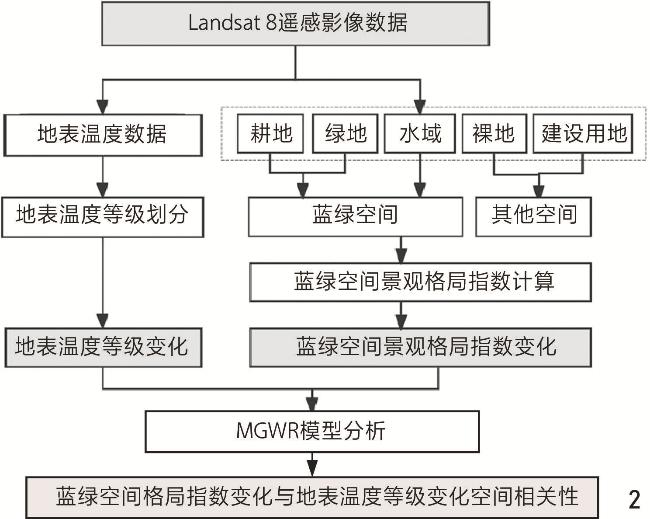
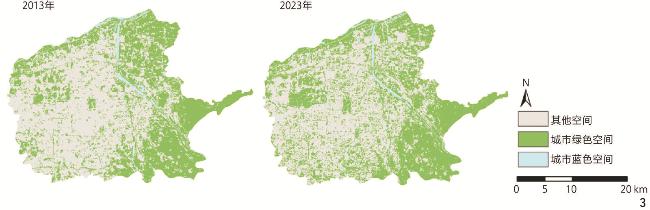
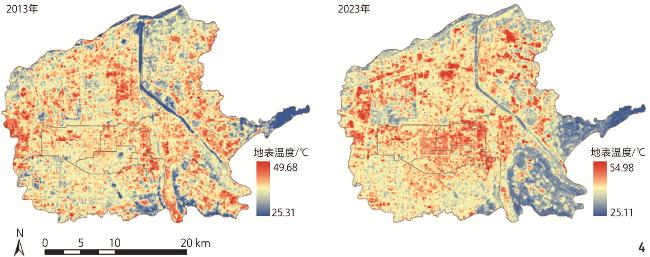
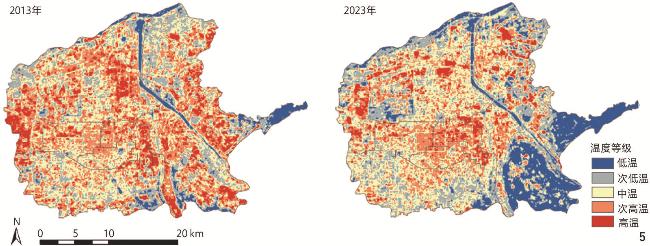
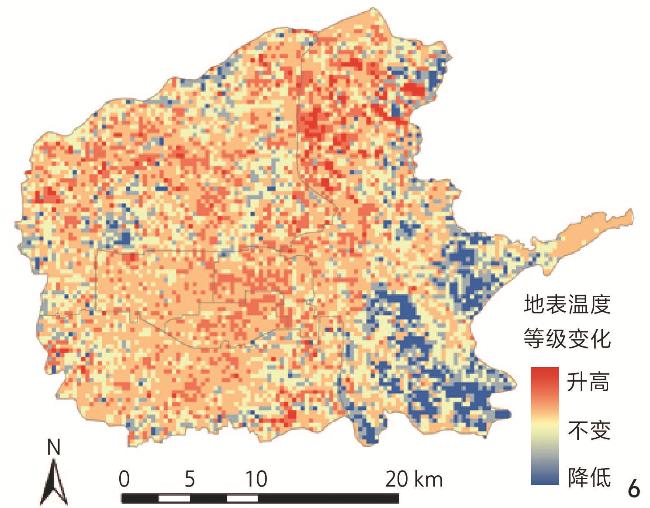
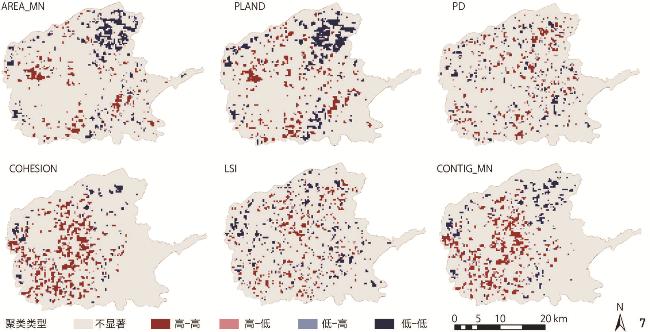
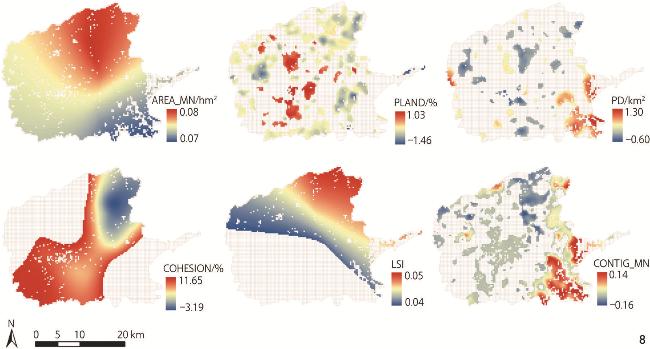
[Objective] In the contemporary global context, urban areas are increasingly confronted with the dual pressures of global climate change and rapid urbanization. These pressures have led to a significant rise in urban temperature, thereby amplifying the importance of blue-green spaces in mitigating the urban heat island (UHI) effect. Blue-green spaces, which include natural water bodies, parks, green corridors, and other vegetated areas, play a crucial role in regulating urban microclimates. As cities enter an era of stock development, where the focus shifts from expansion to optimization of existing resources, the strategic configuration of these spaces has become a cornerstone for enhancing urban thermal environments. Understanding the cooling mechanisms of blue-green spaces at various spatial scales is essential for improving urban thermal comfort and guiding the planning and construction of urban blue-green infrastructure. [Methods] This research focuses on the central urban area of Xi’an, a city that has experienced substantial urban growth over the past decade. By employing a combination of spatial autocorrelation analysis and a multi-scale geographically weighted regression (MGWR) model, the research examines the change characteristics of blue-green spaces and their impact on land surface temperature from 2013 to 2023. The findings reveal the spatial heterogeneity of cooling effects and offer tailored optimization strategies for blue-green spaces across diverse urban contexts. The research methodology involves selecting six representative landscape indices to evaluate the changes in blue-green space patterns in the central urban area of Xi’an. These indices are carefully chosen to capture the nuances of spatial configuration, fragmentation, and connectivity of blue-green spaces. Spatial autocorrelation analysis is utilized to identify spatial clustering and patterns extracted from the data collected, while the MGWR model is adopted for a more granular examination of the relationship between landscape indices and land surface temperature levels. This integrated approach not only reveals the factors influencing the cooling effects of blue-green spaces but also highlights their spatial variability across the urban landscape. [Results] The results of the research are both revealing and instructive. 1) The blue-green space patterns in the central urban area of Xi’an underwent significant changes over the research period, reflecting the dynamic interplay between urban development and environmental management. 2) The spatial distribution of land surface temperature exhibits a distinct pattern of being “high in the north and low in the south”. The central area, characterized by dense urban fabric, shows minimal fluctuations in land surface temperature, whereas low-temperature zones are predominantly concentrated in the southern part of Baqiao District. This uneven thermal distribution underscores the complexity of urban heat dynamics and the need for targeted interventions. 3) The relationship between landscape indices and land surface temperature changes displays notable spatial heterogeneity. In high-density urban areas, small and complex blue-green patches demonstrate stronger cooling effects, emphasizing the importance of intricate designs in densely built environments where space is limited but the need for effective cooling is significant. In contrast, suburban areas benefit from avoiding the aggregation of large blue-green patches, which may otherwise hinder effective cooling due to reduced air circulation and increased shading. Near large water bodies, regularly shaped and highly connected blue-green patches are found to be particularly effective in reducing land surface temperature, highlighting the synergistic effects of water and vegetation in enhancing cooling performance and suggesting that integrated blue-green networks can maximize thermal benefits. [Conclusion] The research concludes that the relationship between temperature changes and blue-green space changes in the central urban area of Xi’an is significant and characterized by strong spatial heterogeneity during the period from 2013 to 2023, with the cooling effects of blue-green spaces found varying by their spatial attributes and the characteristics of the surrounding urban environment. These findings highlight the necessity for region-specific optimization strategies to maximize the cooling potential of blue-green spaces. By integrating spatial analysis and regression modeling, the research provides a detailed understanding of the cooling mechanisms of blue-green spaces across diverse urban contexts. The results emphasize the importance of tailoring blue-green space designs to local conditions, considering factors such as urban density, proximity to water bodies, and regional climatic characteristics. This approach enhances the effectiveness of blue-green spaces in mitigating the urban heat island effect and contributes to the creation of more sustainable and thermally comfortable urban environments. The research advocates a holistic and adaptive urban planning strategy, where blue-green spaces are strategically designed and managed to address the unique thermal challenges of different urban areas. This research offers valuable guidance for policymakers and urban planners aiming to optimize blue-green infrastructure and improve urban resilience in the face of climate change and urbanization.
Weiying KONG , Yizhuo LIU , Sichun DONG , Yuandong HU . Research on the Influence of Evolution of Landscape Patterns of Blue-Green Space on the Cooling Effect in the Central Urban Area of Xi’an[J]. Landscape Architecture, 2025 , 32(5) : 78 -85 . DOI: 10.3724/j.fjyl.202408210473
| 温度等级 | 温度区间 |
| 注:T S 为地表温度;$\;{\text{μ}} $为西安中心城区地表温度的平均值;std为标准差。 | |
| 高温 | T S>std+ $\;{\text{μ}} $ |
| 次高温 | $\;{\text{μ}} $ +0.5std<T S≤$\;{\text{μ}} $ +std |
| 中温 | $\;{\text{μ}} $ −0.5std≤T S≤$\;{\text{μ}} $ +0.5std |
| 次中温 | $\;{\text{μ}} $ −std≤T S<$\;{\text{μ}} $ −0.5std |
| 低温 | T S<$\;{\text{μ}} $ −std |
图4 2013、2023年西安中心城区地表温度空间分布Fig. 4 Spatial distribution of land surface temperature in the central urban area of Xi’an in 2013 and 2023 |
表2 2013、2023年西安中心城区蓝绿空间景观格局指数Tab. 2 Landscape pattern index of blue-green space in the central urban area of Xi’an in 2013 and 2023 |
| 年份 | AREA_MN/hm2 | PLAND/% | PD/km2 | COHESION/% | LSI | CONTIG_MN |
| 2013 | 20.871 | 44.116 | 2.114 | 99.507 | 58.747 | 0.776 |
| 2023 | 16.361 | 48.312 | 2.953 | 99.332 | 72.105 | 0.749 |
表3 2013—2023年地表温度等级变化和蓝绿空间景观格局指数变化的全局莫兰指数分析结果Tab. 3 Analysis results based on Global Moran’s I of surface temperature grades change and landscape pattern index change of blue-green space from 2013 to 2023 |
| 变化指标 | z得分 | p值 | Moran’s I |
| 地表温度等级 | 101.65 | <0.001 | 0.74 |
| AREA_MN | 48.03 | <0.001 | 0.35 |
| PLAND | 66.14 | <0.001 | 0.48 |
| PD | 23.87 | <0.001 | 0.17 |
| COHESION | 48.57 | <0.001 | 0.35 |
| LSI | 35.46 | <0.001 | 0.26 |
| CONTIG_MN | 38.23 | <0.001 | 0.28 |
文中图表均由作者绘制,其中
| [1] |
AKBARI H, CARTALIS C, KOLOKOTSA D, et al. Local Climate Change and Urban Heat Island Mitigation Techniques: The State of the Art[J]. Journal of Civil Engineering and Management, 2016, 22(1): 1-16.
|
| [2] |
CHAKRABORTY T, LEE X. A Simplified Urban-Extent Algorithm to Characterize Surface Urban Heat Islands on a Global Scale and Examine Vegetation Control on Their Spatiotemporal Variability[J]. International Journal of Applied Earth Observation and Geoinformation, 2019, 74: 269-280.
|
| [3] |
ELLENA M, BREIL M, SORIANI S. The Heat-Health Nexus in the Urban Context: A Systematic Literature Review Exploring the Socio-economic Vulnerabilities and Built Environment Characteristics[J]. Urban Climate, 2020, 34: 100676
|
| [4] |
ULPIANI G. On the Linkage Between Urban Heat Island and Urban Pollution Island: Three-Decade Literature Review Towards a Conceptual Framework[J]. Science of the Total Environment, 2021, 751: 141727
|
| [5] |
CHEN X, XU Y, YANG J, et al. Remote Sensing of Urban Thermal Environments Within Local Climate Zones: A Case Study of Two High-Density Subtropical Chinese Cities[J]. Urban Climate, 2020, 31: 100568
|
| [6] |
苏王新, 常青, 刘筱, 等. 城市蓝绿基础设施降温效应研究综述[J]. 生态学报, 2021, 41(7): 2902-2917.
SU W X, CHANG Q, LIU X, et al. Cooling Effect of Urban Green and Blue Infrastructure: A Systematic Review of Empirical Evidence[J]. Acta Ecologica Sinica, 2021, 41(7): 2902-2917.
|
| [7] |
YU Z, YANG G, ZUO S, et al. Critical Review on the Cooling Effect of Urban Blue-Green Space: A Threshold-Size Perspective[J]. Urban Forestry & Urban Greening, 2020, 49: 126630
|
| [8] |
黄铎, 易芳蓉, 汪思哲, 等. 国土空间规划中蓝绿空间模式与指标体系研究[J]. 城市规划, 2022, 46(1): 18-31.
HUANG D, YI F R, WANG S Z, et al. Blue-Green Space Pattern and Indicator System in Territorial Planning[J]. City Planning Review, 2022, 46(1): 18-31.
|
| [9] |
QIU X, KIL S H, JO H K, et al. Cooling Effect of Urban Blue and Green Spaces: A Case Study of Changsha, China[J]. International Journal of Environmental Research and Public Health, 2023, 20(3): 2613
|
| [10] |
刘焱序, 彭建, 王仰麟. 城市热岛效应与景观格局的关联: 从城市规模、景观组分到空间构型[J]. 生态学报, 2017, 37(23): 7769-7780.
LIU Y X, PENG J, WANG Y L. Relationship Between Urban Heat Island and Landscape Patterns: From City Size and Landscape Composition to Spatial Configuration[J]. Acta Ecologica Sinica, 2017, 37(23): 7769-7780.
|
| [11] |
袁旸洋, 张佳琦, 汤思琪, 等. 基于文献计量分析的城市蓝绿空间生态效益研究综述与展望[J]. 园林, 2023, 40(4): 59-67.
YUAN Y Y, ZHANG J Q, TANG S Q, et al. Progress and Review of Research on Urban Blue-Green Space Based on Bibliometric Analysis[J]. Landscape Architecture Academic Journal, 2023, 40(4): 59-67.
|
| [12] |
苏王新, 常青. 城市热缓解的基于自然的解决方案与实施路径: 以北京市为例[J]. 风景园林, 2022, 29(6): 26-32.
SU W X, CHANG Q. Nature-Based Solutions for Urban Heat Mitigation and Implementation Path Thereof: A Case Study of Beijing[J]. Landscape Architecture, 2022, 29(6): 26-32.
|
| [13] |
DEILAMI K, KAMRUZZAMAN M, LIU Y. Urban Heat Island Effect: A Systematic Review of Spatio-Temporal Factors, Data, Methods, and Mitigation Measures[J]. International Journal of Applied Earth Observation and Geoinformation, 2018, 67: 30-42.
|
| [14] |
DU C, SONG P, WANG K, et al. Investigating the Trends and Drivers Between Urbanization and the Land Surface Temperature: A Case Study of Zhengzhou, China[J]. Sustainability, 2022, 14(21): 13845
|
| [15] |
FOTHERINGHAM A S, CHARLTON M, BRUNSDON C. The Geography of Parameter Space: An Investigation of Spatial Non-stationarity[J]. International Journal of Geographical Information Systems, 1996, 10(5): 605-627.
|
| [16] |
SU S, XIAO R, ZHANG Y. Multi-scale Analysis of Spatially Varying Relationships Between Agricultural Landscape Patterns and Urbanization Using Geographically Weighted Regression[J]. Applied Geography, 2012, 32(2): 360-375.
|
| [17] |
HU J, ZHANG J, LI Y. Exploring the Spatial and Temporal Driving Mechanisms of Landscape Patterns on Habitat Quality in a City Undergoing Rapid Urbanization Based on GTWR and MGWR: The Case of Nanjing, China[J]. Ecological Indicators, 2022, 143: 109333
|
| [18] |
FOTHERINGHAM A S, YANG W, KANG W. Multi-scale Geographically Weighted Regression (MGWR)[J]. Annals of the American Association of Geographers, 2017, 107(6): 1247-1265.
|
| [19] |
沈中健, 曾坚, 梁晨. 闽南三市绿地景观格局与地表温度的空间关系[J]. 生态学杂志, 2020, 39(4): 1309-1317.
SHEN Z J, ZENG J, LIANG C. Spatial Relationship of Greenspace Landscape Pattern with Land Surface Temperature in Three Cities of Southern Fujian[J]. Chinese Journal of Ecology, 2020, 39(4): 1309-1317.
|
| [20] |
谭凝, 陈天, 李阳力. 天津市城市蓝绿空间景观格局与热环境的关联研究[J]. 西部人居环境学刊, 2023, 38(2): 115-120.
TAN N, CHEN T, LI Y L. Study on the Relationship Between Landscape Pattern of Urban Green and Blue Space and Thermal Environment of Tianjin[J]. Journal of Human Settlements in West China, 2023, 38(2): 115-120.
|
| [21] |
袁旸洋, 张佳琦, 郭蔚, 等. 南京主城区蓝绿空间格局对降温效益的影响及其协同作用研究[J]. 园林, 2023, 40(8): 57-64.
YUAN Y Y, ZHANG J Q, GUO W, et al. Cooling Effects of the Spatial Pattern of Blue-Green Spaces and Their Synergies in Central Area of Nanjing, China[J]. Landscape Architecture Academic Journal, 2023, 40(8): 57-64.
|
| [22] |
宋加颖, 孟丹, 冯鹏, 等. 北京城市副中心及周边区域蓝绿空间景观格局及降温效应评估[J]. 园林, 2024, 41(4): 86-94.
SONG J Y, MENG D, FENG P, et al. Landscape Pattern and Cooling Effect Evaluation of Blue-Green Space in Beijing’s Sub-center and Surrounding Area[J]. Landscape Architecture Academic Journal, 2024, 41(4): 86-94.
|
| [23] |
石炜豪, 曾穗平, 艾合麦提·那麦提. 街区蓝绿空间对热环境影响的空间异质性研究[J]. 风景园林, 2024, 31(10): 98-105.
SHI W H, ZENG S P, NAMAITI A. Research on the Spatial Heterogeneity of the Impact of Blue-Green Space Within Urban Block on Urban Thermal Environment[J]. Landscape Architecture, 2024, 31(10): 98-105.
|
| [24] |
GUO A, YANG J, SUN W, et al. Impact of Urban Morphology and Landscape Characteristics on Spatiotemporal Heterogeneity of Land Surface Temperature[J]. Sustainable Cities and Society, 2020, 63: 102443
|
| [25] |
西安市统计局.西安市统计年鉴2023[M].北京: 中国统计出版社, 2023.
Xi’an Municipal Bureau of Statistics. Xi’an Municipal Statistical Yearbook 2023[M]. Beijing: China Statistics Press, 2023.
|
| [26] |
CHEN S, WANG T. Comparison Analyses of Equal Interval Method and Mean-Standard Deviation Method Used to Delimitate Urban Heat Island[J]. Geo-information Science, 2009, 11(2): 145-150.
|
| [27] |
陈文波, 肖笃宁, 李秀珍. 景观指数分类、应用及构建研究[J]. 应用生态学报, 2002, 13(1): 121-125.
CHEN W B, XIAO D N, LI X Z. Classification, Application, and Creation of Landscape Indices[J]. Chinese Journal of Applied Ecology, 2002, 13(1): 121-125.
|
| [28] |
XIE Q, REN L, YANG C. Regulation of Water Bodies to Urban Thermal Environment: Evidence from Wuhan, China[J]. Frontiers in Ecology and Evolution, 2023, 11: 983567
|
| [29] |
CHEN A, YAO L, SUN R, et al. How Many Metrics Are Required to Identify the Effects of the Landscape Pattern on Land Surface Temperature?[J]. Ecological Indicators, 2014, 45: 424-433.
|
| [30] |
HE J, SHI Y, XU L, et al. An Investigation on the Impact of Blue and Green Spatial Pattern Alterations on the Urban Thermal Environment: A Case Study of Shanghai[J]. Ecological Indicators, 2024, 158: 111244
|
| [31] |
向炀, 周志翔. 蓝绿空间景观格局对城市热岛的影响[J]. 中国园林, 2023, 39(1): 105-110.
XIANG Y, ZHOU Z X. Influence of Blue-Green Spatial Landscape Pattern on Urban Heat Island[J]. Chinese Landscape Architecture, 2023, 39(1): 105-110.
|
| [32] |
MAIMAITIYIMING M, GHULAM A, TIYIP T, et al. Effects of Green Space Spatial Pattern on Land Surface Temperature: Implications for Sustainable Urban Planning and Climate Change Adaptation[J]. ISPRS Journal of Photogrammetry and Remote Sensing, 2014, 89: 59-66.
|
| [33] |
ZHOU W, HUANG G, CADENASSO M L. Does Spatial Configuration Matter? Understanding the Effects of Land Cover Pattern on Land Surface Temperature in Urban Landscapes[J]. Landscape and Urban Planning, 2011, 102(1): 54-63.
|
| [34] |
CHEN M, JIA W, YAN L, et al. Quantification and Mapping Cooling Effect and Its Accessibility of Urban Parks in an Extreme Heat Event in a Megacity[J]. Journal of Cleaner Production, 2022, 334: 130252
|
| [35] |
MASOUDI M, TAN P Y. Multi-year Comparison of the Effects of Spatial Pattern of Urban Green Spaces on Urban Land Surface Temperature[J]. Landscape and Urban Planning, 2019, 184: 44-58.
|
| [36] |
奥勇, 王周航, 赵永华, 等. 不同城市化水平下绿地景观要素对温度的影响: 以关中平原城市群为例[J]. 生态学杂志, 2023, 42(11): 2721-2729.
AO Y, WANG Z H, ZHAO Y H, et al. Effect of Green Space Landscape Elements on Temperature Under Different Urbanization Levels: A Case Study of Guanzhong Plain Urban Agglomeration[J]. Chinese Journal of Ecology, 2023, 42(11): 2721-2729.
|
| [37] |
ZHANG Y, ZHAN Y, YU T, et al. Urban Green Effects on Land Surface Temperature Caused by Surface Characteristics: A Case Study of Summer Beijing Metropolitan Region[J]. Infrared Physics & Technology, 2017, 86: 35-43.
|
| [38] |
姜允芳, 黄静. 蓝绿景观结构对城市热岛的减缓效应定量分析[J]. 长江流域资源与环境, 2022, 31(9): 2060-2072.
JIANG Y F, HUANG J. Quantitative Analysis of Mitigation Effect of Urban Blue-Green Spaces on Urban Heat Island[J]. Resources and Environment in the Yangtze Basin, 2022, 31(9): 2060-2072.
|
| [39] |
WANG W, ZHANG B, ZHOU W, et al. The Effect of Urbanization Gradients and Forest Types on Microclimatic Regulation by Trees, in Association with Climate, Tree Sizes and Species Compositions in Harbin City, Northeastern China[J]. Urban Ecosystems, 2019, 22(2): 367-384.
|
| [40] |
GUO G, WU Z, CHEN Y. Complex Mechanisms Linking Land Surface Temperature to Greenspace Spatial Patterns: Evidence from Four Southeastern Chinese Cities[J]. Science of the Total Environment, 2019, 674: 77-87.
|
| [41] |
YU Z, GUO X, JØRGENSEN G, et al. How Can Urban Green Spaces Be Planned for Climate Adaptation in Subtropical Cities?[J]. Ecological Indicators, 2017, 82: 152-162.
|
/
| 〈 |
|
〉 |