
Multi-scenario Dynamic Simulation and Optimization of Urban Ventilation Environment: A Case Study of Taiyuan Metropolitan Area
|
HUANG Junda, Ph.D., Junda is a postdoctoral researcher in the Postdoctoral Research Station on Urban and Rural Planning, College of Architecture and Urban Planning (CAUP), Tongji University. His research focuses on landscape ecological planning, and landscape planning and design |
|
WANG Yuncai, Ph.D., is a tenured professor and doctoral supervisor in the College of Architecture and Urban Planning (CAUP), Tongji University, and an editorial board member of this journal. His research focuses on pattern language and teaching, research and engineering practice of landscape ecology planning and design |
Received date: 2024-09-13
Revised date: 2025-03-07
Online published: 2025-12-10
Copyright
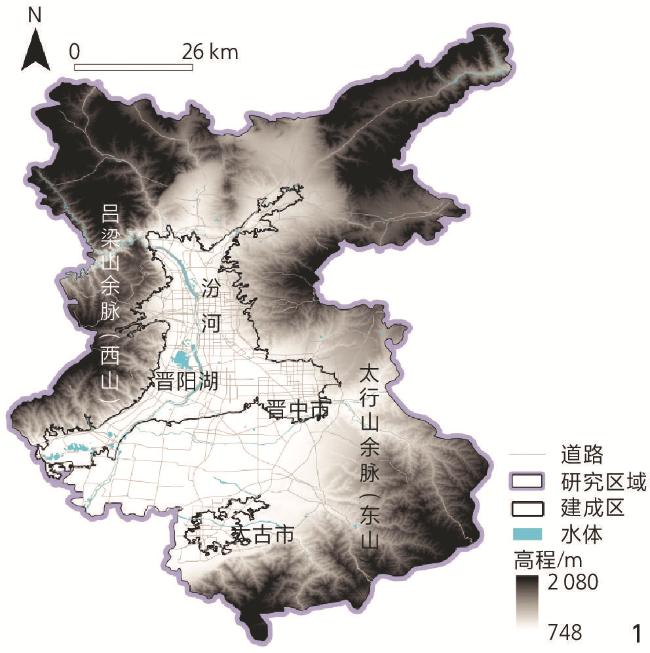
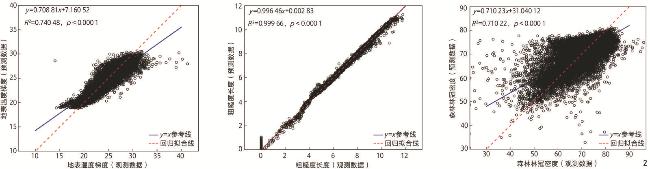
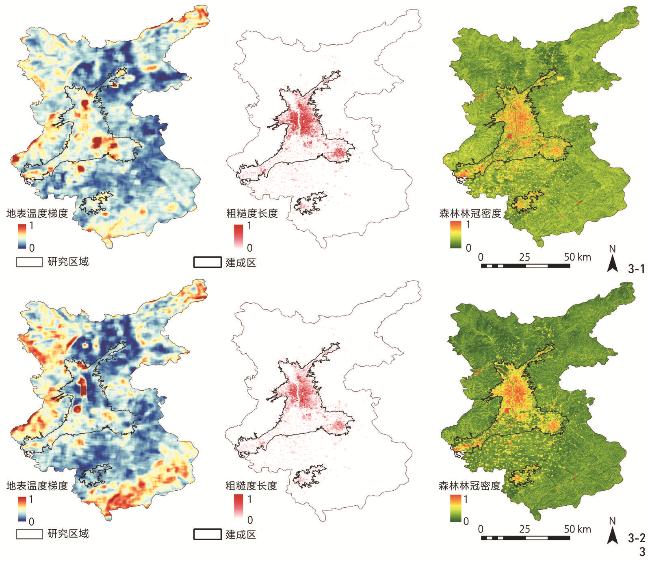
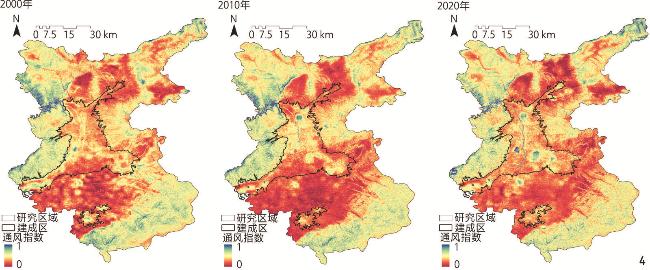
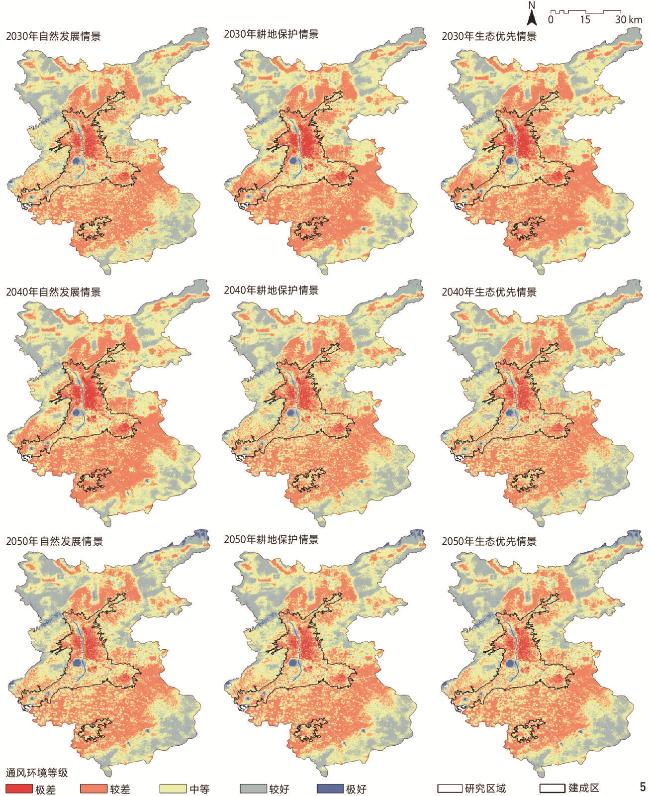
[Objective] In recent decades, China’s rapid urbanization has led to large amounts of energy consumption and carbon dioxide emissions, triggering significant urban heat island effects and air pollution, which seriously threaten the physical and mental health of residents. How to improve the urban human settlement environment has become the focus of urban planning. Urban ventilation, as an important way to deliver fresh and cold air to built-up areas, can effectively improve the comfort level. Although many international scholars have researched the optimization of urban ventilation, the existing research in China mainly focuses on the measurement of the current urban ventilation environment, while neglecting the long-term dynamic changes of the urban ventilation environment in response to different planning objectives in the process of urban development. [Methods] This research proposes a research framework generally applicable to the simulation of future changes in ventilation environment within city – region systems for the first time. Firstly, this research defines five indicators (surface temperature gradient, roughness length, forest canopy density, elevation variation coefficient, and slope) to evaluate the ventilation environment from three dimensions: surface pressure gradient, surface roughness, and surface undulation. Secondly, based on previous research and considering the natural environment and socio-economic development of the research area, DEM, slope, distance to primary roads, distance to secondary roads, distance to tertiary roads, population density, GDP, and building density are selected as driving factors in this research to investigate the transformation pattern of land use types. The data on driving factors and land use types in the research area in 2000 and 2010 are imported into the PLUS model. Three scenarios of natural development, farmland protection and ecological priority are set to simulate the land use types. Then, a prediction model is constructed based on the random forest algorithm. The land use types and ventilation environment of multiple scenarios in 2010 and 2020 are input into the validated prediction model to simulate changes in the future ventilation environment. Finally, depending on the historical trends in ventilation potential and differences across multiple scenarios within the research area, specific applications of the simulation results are proposed for spatial planning and management of metropolitan areas. [Results] Influenced by urban development from 2000 to 2020, the ventilation environment of the Taiyuan metropolitan area varied with time, space, and planning objectives, with a decreasing trend and an increasing trend shown in local areas. Patches of better ventilation environments occurred at the Jinyang Lake, the Fen River, and the Fen River Park. Several potential ventilation corridors were formed on the east and west sides of the built-up area. Under the scenarios of natural development, farmland protection, and ecological priority, the ventilation environment of the research area shows a trend of gradual improvement from 2030 to 2050. Specifically, from 2030 to 2050, the grade of the ventilation environment is gradually improved; from 2040 to 2050, the area of the ventilation environment graded as extremely good or good is significantly increased. Meanwhile, the ventilation environments in different regions show differences in spatial distribution. Under the natural development scenario, there is a significant increase in the area of ventilation environments graded as extremely good or good in 2030. From 2030 to 2040, the area of poorly rated ventilation environments increases between the central urban area and the eastern and western mountainous areas. From 2040 to 2050, the ventilation environment in the above areas gradually improves, and a significant wind corridor with high ventilation potential appears between the eastern mountainous area and the central urban area. The continuous protection of basic farmland effectively limits the encroachment of construction land on farmland. By the end of 2050, a large amount of basic farmland is retained in the north and south plains. From 2030 to 2050, the villages and towns located in the southern plains transform from early isolated islands to a grid-like structure, and the ventilation environment level of the surrounding roads, rivers and other linear spaces gradually increases. Under the ecological priority scenario, water bodies, forests and sparse grasslands are preserved to the maximum extent possible. The area of ventilation environments graded as extremely good increases significantly from 2030 to 2050. These areas are mainly distributed around large water bodies such as the Fen River and the Jinyang Lake. [Conclusion] In this research, a dynamic simulation model of the urban ventilation environment is constructed and the spatial distribution of the ventilation environment under different scenarios is mapped. To cope with a series of urban problems caused by urban sprawl and densification, the trends of the ventilation environment in the Taiyuan metropolitan area are predicted and identified, based on which a series of targeted optimization strategies are proposed. However, this research still has limitations. Since this research uses historical data spanning a period of 10 years, various factors, such as climate change and human activities, may have interfered with the simulation results during this period. Therefore, to improve the simulation accuracy, future research may incorporate more environmental factors into the modeling process to explore the objective laws of the ventilation environment in the process of long time-series changes, which may provide guidance for the construction of local climate adaptive cities.
Junda HUANG , Yuncai WANG . Multi-scenario Dynamic Simulation and Optimization of Urban Ventilation Environment: A Case Study of Taiyuan Metropolitan Area[J]. Landscape Architecture, 2025 , 32(5) : 71 -77 . DOI: 10.3724/j.fjyl.202409130538
表1 城市通风环境评价指标体系Tab. 1 Indicator system for evaluation of urban ventilation environment |
| 维度 | 测度指标 | 计算式 | 式注 | 权重 |
| 地表气压梯度 | 地表温度梯度 | $\mathrm{S}\mathrm{a}=\dfrac{1}{a}{\displaystyle\iint }_{a}^{}\left|Z(x,y)\right|\mathrm{d}x\mathrm{d}y$ | $\mathrm{Sa}$为地表温度梯度;$Z(x,y)$为空间单元$(x,y)$的地表温度;$ \mathrm{d}x\mathrm{d}y $为空间单元$(x,y)$的二次积分;a为空间单元面积,指地表温度数据所覆盖的具体区域范围 | 0.25 |
| 地表粗糙度 | 粗糙度长度 | ${z}_{0}=0.25\times {A}_{{\rm{b}}}\times {H}_{{\rm{b}}}+0.01\times {A}_{0}\times 0.1$ | $ {z}_{0} $为粗糙度长度;${A}_{{\rm{b}}}$为建筑面积;${H}_{{\rm{b}}}$为平均建筑高度;$ {A}_{0} $为开放空间面积 | 0.38 |
| 森林林冠密度 | $\mathrm{F}\mathrm{C}\mathrm{D}=\sqrt{\mathrm{V}\mathrm{D}\times \mathrm{S}\mathrm{S}\mathrm{I}+1}-1$ | $ \mathrm{F}\mathrm{C}\mathrm{D} $为森林林冠密度;$\mathrm{V}\mathrm{D}$为植被密度,通过高级植被指数和裸土指数的主成分分析计算;$\mathrm{S}\mathrm{S}\mathrm{I}$为缩放阴影指数,由冠层阴影指数通过线性变换计算 | 0.24 | |
| 地表起伏度 | 平均高程变异系数 | $ \mathrm{E}\mathrm{V}\mathrm{C}={H}_{\mathrm{s}\mathrm{t}\mathrm{d}}/{H}_{\mathrm{m}\mathrm{e}\mathrm{a}\mathrm{n}} $ | $ \mathrm{E}\mathrm{V}\mathrm{C} $为平均高程变异系数;$ {H}_{\mathrm{s}\mathrm{t}\mathrm{d}} $为高程标准差;$ {H}_{\mathrm{m}\mathrm{e}\mathrm{a}\mathrm{n}} $为平均高程 | 0.11 |
| 平均坡度 | $S=({y}_{2}-{y}_{1})/({x}_{2}-{x}_{1})$ | $ S $为平均坡度;$({x}_{1},{y}_{1})$和$({x}_{2},{y}_{2})$为空间单元中心坐标 | 0.02 |
图5 2030、2040、2050年太原都市区多情景通风环境模拟结果Fig. 5 Results of the multi-scenario ventilation environment simulation of the Taiyuan metropolitan area in 2030, 2040 and 2050 |
表2 多情景下不同等级通风环境的面积统计Tab. 2 Statistics of the area of ventilation environments with different grades under different scenarios |
| 年份 | 情景 | 通风环境等级 | ||||
| 极差 | 较差 | 中等 | 较好 | 极好 | ||
| 2030 | 自然发展情景 | 116.93 | 2 440.11 | 2 764.90 | 1 102.57 | 25.97 |
| 耕地保护情景 | 116.39 | 2 411.26 | 2 778.37 | 1 118.59 | 25.88 | |
| 生态优先情景 | 116.21 | 2 439.54 | 2 776.63 | 1 112.07 | 26.04 | |
| 2040 | 自然发展情景 | 76.99 | 2 189.21 | 2 871.35 | 1 274.87 | 27.39 |
| 耕地保护情景 | 76.78 | 2 174.87 | 2 863.09 | 1 297.85 | 27.23 | |
| 生态优先情景 | 74.50 | 2 145.74 | 2 747.62 | 1 444.49 | 27.52 | |
| 2050 | 自然发展情景 | 67.38 | 2 043.08 | 2 693.98 | 1 568.65 | 77.72 |
| 耕地保护情景 | 67.57 | 2 066.70 | 2 853.01 | 1 401.50 | 62.02 | |
| 生态优先情景 | 65.42 | 1 999.66 | 2 804.63 | 1 510.60 | 70.59 | |
文中图表均由作者绘制。
| [1] |
MARX W, HAUNSCHILD R, BORNMANN L. Heat Waves: A Hot Topic in Climate Change Research[J]. Theoretical and Applied Climatology, 2021, 146(1/2): 781-800.
|
| [2] |
齐羚, 董文辉, 龙欣雨, 等. 基于人群活力的北京市延庆区城市公园风环境评价[J]. 风景园林, 2023, 30(8): 89-96.
QI L, DONG W H, LONG X Y, et al. Evaluation on Wind Environment of Parks in Yanqing District, Beijing Based on Crowd Vitality[J]. Landscape Architecture, 2023, 30(8): 89-96.
|
| [3] |
莫尚剑, 沈守云, 廖秋林. 基于WRF模式的长株潭城市群绿心通风廊道规划策略研究[J]. 中国园林, 2021, 37(1): 80-84.
MO S J, SHEN S Y, LIAO Q L. Landscape Design Strategy of Ventilation Corridor in the Green Heart of CZT Urban Agglomeration Based on WRF Model[J]. Chinese Landscape Architecture, 2021, 37(1): 80-84.
|
| [4] |
王冠, 周宏轩, 王文真, 等. 中微观尺度上城市形态指标与城市通风的关联性研究进展[J]. 生态科学, 2023, 42(1): 252-262.
WANG G, ZHOU H X, WANG W Z, et al. Research Progress on Correlations Between Urban Morphological Parameters and City Ventilation on Mesoscale and Microscale[J]. Ecological Science, 2023, 42(1): 252-262.
|
| [5] |
赵宏宇, 毛博. 基于改善通风和热舒适度的长春市风环境多尺度优化[J]. 西部人居环境学刊, 2020, 35(2): 24-32.
ZHAO H Y, MAO B. Multi-scale Optimization on Urban Wind Environment of Changchun City Based on Improved Ventilation and Thermal Comfort[J]. Journal of Human Settlements in West China, 2020, 35(2): 24-32.
|
| [6] |
WANG W, LUO Y, HUAN C, et al. Exploring the Influence of Building Form Parameters on Three-Dimensional Ventilation Potential in Urban Centers: A Case Study of Nanjing, China[J]. Journal of Urban Management, 2024, 13(2): 262-278.
|
| [7] |
杨佳明, 安睿, 仝照民, 等. 基于多尺度地理加权回归的建成环境对通风潜力的影响研究: 以武汉市主城区为例[J]. 南京师大学报(自然科学版), 2023, 46(4): 29-39.
YANG J M, AN R, TONG Z M, et al. Effect of Built Environment on Ventilation Potential Based on Multi-scale Geographically Weighted Regression: A Case Study of the Main Urban Area of Wuhan[J]. Journal of Nanjing Normal University (Natural Science Edition), 2023, 46(4): 29-39.
|
| [8] |
姜之点, 杨峰. 建筑立体绿化方式和设计高度对三维空间降温潜力的影响[J]. 风景园林, 2023, 30(5): 75-82.
JIANG Z D, YANG F. Influence of Green Building Planting Form and Design Height on Cooling Potential of 3D Space[J]. Landscape Architecture, 2023, 30(5): 75-82.
|
| [9] |
LUO H, WU J. Effects of Urban Growth on the Land Surface Temperature: A Case Study in Taiyuan, China[J]. Environment, Development and Sustainability, 2021, 23(7): 10787-10813.
|
| [10] |
YANG J, HUANG X. The 30 m Annual Land Cover Datasets and Its Dynamics in China from 1990 to 2021[J]. Earth System Science Data, 2022, 13(1): 3907-3925.
|
| [11] |
HE T, WANG K, XIAO W, et al. Global 30 Meters Spatiotemporal 3D Urban Expansion Dataset from 1990 to 2010[J]. Scientific Data, 2023, 10(1): 321
|
| [12] |
KONDO J, YAMAZAWA H. Aerodynamic Roughness over an Inhomogeneous Ground Surface[J]. Boundary-Layer Meteorology, 1986, 35(4): 331-348.
|
| [13] |
SUDER A, SZYMANOWSKI M. Determination of Ventilation Channels in Urban Area: A Case Study of Wrocław (Poland)[J]. Pure and Applied Geophysics, 2014, 171(6): 965-975.
|
| [14] |
GU R, XIE Z, TAKATORI C, et al. To What Extent Can Satellite Cities and New Towns Serve as a Steering Instrument for Polycentric Urban Expansion During Massive Population Growth?: A Comparative Analysis of Tokyo and Shanghai[J]. ISPRS International Journal of Geo-Information, 2023, 12(6): 234
|
| [15] |
KOROSO N H, LENGOIBONI M, ZEVENBERGEN J A. Urbanization and Urban Land Use Efficiency: Evidence from Regional and Addis Ababa Satellite Cities, Ethiopia[J]. Habitat International, 2021, 117: 102437
|
| [16] |
TAO W, JIN Z. Remote Sensing Image Characteristics and Typical Area Analysis of Taiyuan Xishan Ecological Restoration Area[J]. Sensors, 2023, 23(4): 2108
|
| [17] |
KONARSKA J, UDDLING J, HOLMER B, et al. Transpiration of Urban Trees and Its Cooling Effect in a High Latitude City[J]. International Journal of Biometeorology, 2016, 60(1): 159-172.
|
/
| 〈 |
|
〉 |