
Research on Characteristics and Influencing Factors of High Temperature Disaster Risk in Wuhan Based on Local Climate Zone
|
GUO Shujing gained her master degree in Huazhong Agricultural University, and is currently a professional and technical personnel in Xiaogan Territorial Spatial Planning Research Institute. Her research focuses on microclimate effects of green spaces |
|
ZHANG Li, Ph.D., is an associate professor in the College of Horticulture & Forestry Sciences, Huazhong Agricultural University. Her research focuses on microclimate effects of green spaces |
Received date: 2024-05-23
Revised date: 2024-11-18
Online published: 2025-12-07
Copyright
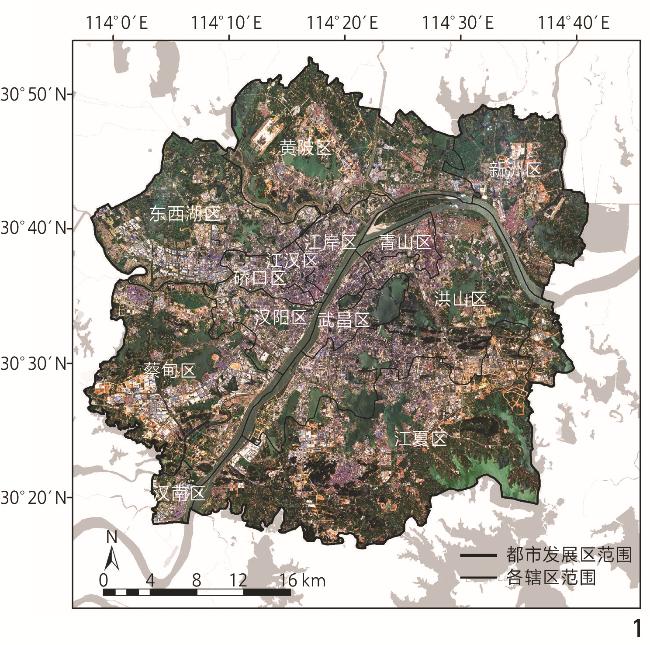
[Objective] Against the background of rapid urbanization and global warming, Wuhan is frequently hit by extreme heat events, which not only poses a serious threat to the health status of local residents, but also brings great losses to socio-economic development. Mapping the high temperature disaster risk in the urban development area of Wuhan and analyzing the high temperature disaster risk and influencing factors thereof at the local scale can provide an important basis for the prevention of high temperature disasters in the city.
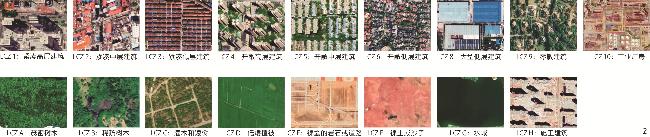
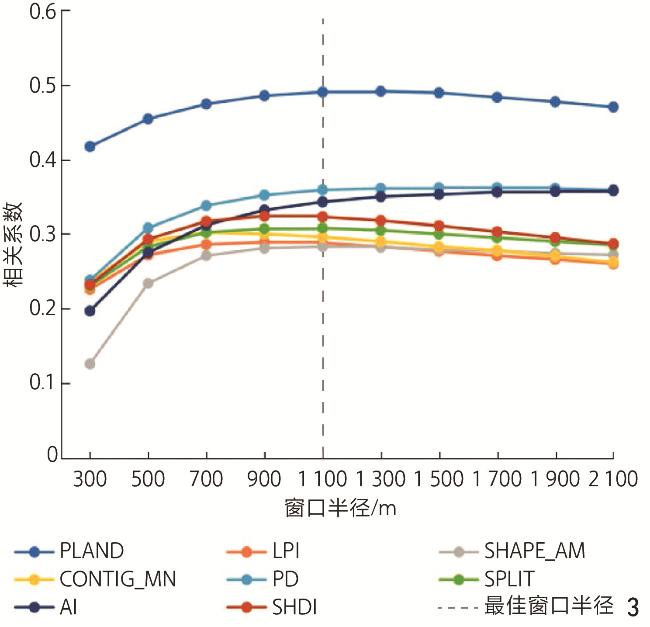
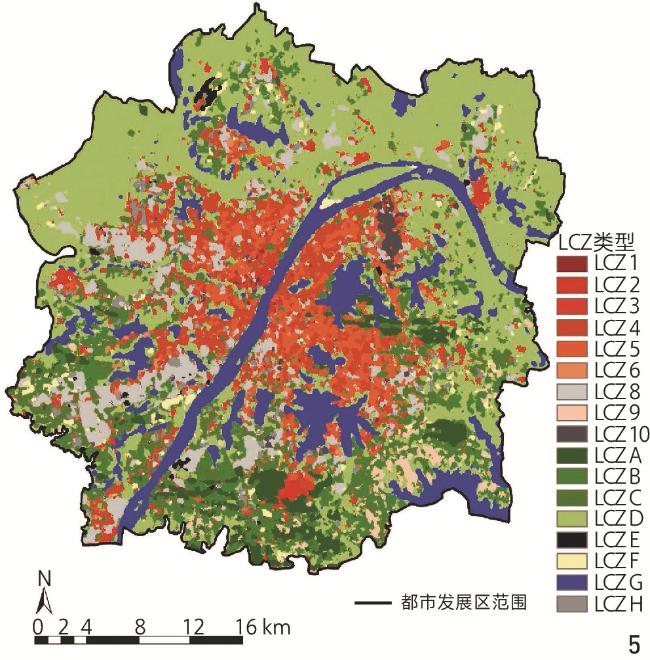
[Methods] Based on the “hazard – exposure – vulnerability” high temperature disaster risk assessment framework proposed by the Intergovernmental Panel on Climate Change, this research constructed an assessment system by utilizing multi-source data, and then pre-processes all relevant indicators to make them dimensionless. Then, a combination of the analytic hierarchy process and principal component analysis is adopted to assign weights to the indicators, with such weights being finally superimposed to obtain the hazard map, exposure map and vulnerability map, respectively. On this basis, a high temperature disaster risk map of the urban development area of Wuhan is synthesized to identify the distribution characteristics of high temperature disaster risk in the research area. Then Landsat 8 remote sensing images are processed with SAGA GIS software, Google Earth Pro software, and Random Forest algorithm to classify the urban development area of Wuhan into 17 local climate zone (LCZ) types based on the remote sensing image classification method of World Urban Database and Access Portal Tools (WUDAPT). With 70% random samples used for drawing and 30% random samples used for checking, LCZ maps that meet the requirements of classification accuracy are obtained and analyzed for site identification at the local scale. The LCZ maps are then superimposed on the high temperature disaster risk map to identify the local-scale characteristics of high temperature disaster risk, analyze the degree of high temperature disaster risk for each LCZ type and the differences in high temperature disaster risk between different LCZ types, and explore the reasons for such differences. Finally, eight types of LCZ landscape pattern indices are preliminarily selected at the type and landscape scale levels, and the optimal research size is obtained using the moving window method in Fragstats 4.2 software. Furthermore, highly correlated LCZ types are screened out under the optimal size, the multicollinearity of all LCZ landscape pattern indices is examined and those with multicollinearity are excluded. Finally, geographically weighted regression (GWR) models are used to explore the effect of LCZ landscape patterns on spatial heterogeneity of high temperature disaster risk.
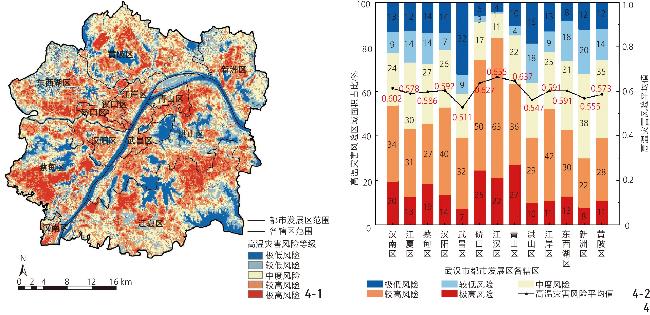
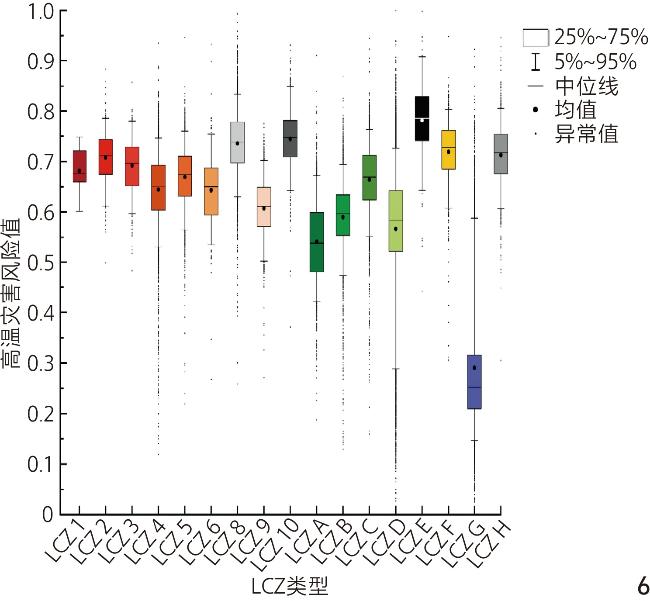
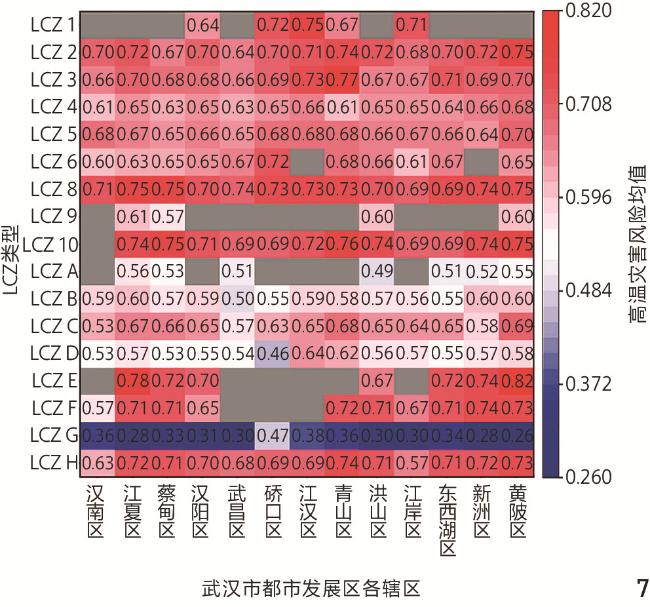
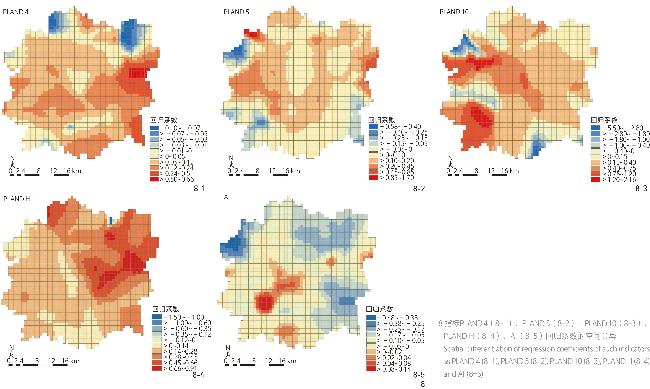
[Results] The characteristics of high temperature disaster risk in each district do not differ much, and the overall spatial presentation of the development center of each district gradually decreases from high to low, with high-risk areas mainly located in the south-central part of Caidian District, the west and north of Jiangxia District, the dense industrial parks in the south of Dongxihu District, the Wuhan Iron and Steel Factory in Qingshan District, and the Tianhe Airport in Huangpi District, and the low-risk areas are mainly in the watershed part. Jianghan, Qiaokou, and Qingshan districts have relatively high average value of high temperature disaster risk due to high population density or dense buildings, while Wuchang and Hongshan districts have relatively low average value of high temperature disaster risk due to the presence of large areas of water and green areas therein. Overlaying the LCZ maps with the normalized high temperature disaster risk maps, it can be seen that, among the building types, sparse built-up area (LCZ 9) has the lowest average value of high temperature disaster risk, and the average value of high temperature disaster risk is significantly higher than that of the other building types in large low-rise buildings (LCZ 8) and heavy industrial buildings (LCZ 10), which are mainly industrial plants and heavy industrial zones with large building area. Among the natural environment types, water area (LCZ G) has the lowest average value of high temperature disaster risk, which indicates that water can effectively mitigate the risk of high temperature disaster; while for bare rock (LCZ E), exposed sand (LCZ F), and construction building (LCZ H) exposed outdoor, they typically have higher values of high temperature disaster risk due to solar radiation for a long time. As to landscape pattern indices, the area percentage of landscape (PLAND) has a higher influence on high temperature disaster risk than aggregation index (AI).
[Conclusion] Based on the research results above, strategies to cope with high temperature disasters are proposed. First, the area of vegetation and water should be increased. Secondly, the building layout should be rationally planned. Meanwhile, anthropogenic heat source emissions should also be controlled. Finally, high temperature service facilities should be improved to enhance the city's coping ability.
Shujing GUO , Li ZHANG . Research on Characteristics and Influencing Factors of High Temperature Disaster Risk in Wuhan Based on Local Climate Zone[J]. Landscape Architecture, 2025 , 32(1) : 105 -113 . DOI: 10.3724/j.fjyl.202405230292
表1 高温灾害风险评估指标体系Tab. 1 Indicator system for assessment of high temperature disaster risk |
| 目标层 | 准则层 | 指标层 | 指标性质 | 层次分析法 权重/% | 主成分分析法 权重/% | 主客观结合法 权重/% | |
| 注:老年人身体机能下降,儿童的免疫系统尚未完全发育成熟,他们均易受到高温影响,是高温热浪敏感人群,因此敏感性POI包括幼儿园、小学、养老院、老年人活动中心;医院有专业医疗设备和医护人员,能够快速响应高温天气下可能出现的突发状况,公园和广场通常拥有大片绿地和树木,能够提供清凉遮阴和休闲娱乐等方面的功能,因此适宜性POI包括医院、公园、广场、风景名胜。 | |||||||
| 武汉市都市 发展区高温 灾害风险 | 危险性(H) | 地表温度 | 正向 | 24.71 | 19.37 | 22.040 | |
| 暴露度(E) | HSI | 正向 | 16.53 | 8.89 | 12.710 | ||
| NDBI | 10.22 | 11.38 | 10.800 | ||||
| 脆弱性(V) | 敏感性 | 敏感性POI核密度 | 正向 | 17.72 | 7.20 | 12.460 | |
| 土地利用类型 | 11.44 | 16.90 | 14.170 | ||||
| 适宜性 | 适宜性POI核密度 | 负向 | 4.72 | 7.39 | 6.055 | ||
| 植被覆盖率 | 7.26 | 14.54 | 10.900 | ||||
| 水域缓冲区 | 7.40 | 14.33 | 10.865 | ||||
表2 景观格局指数描述Tab. 2 Description on landscape pattern indices |
| 景观格局指数 | 描述 |
| 斑块类型面积百分比(PLAND) | 某一斑块类型在整体景观中所占的面积比例 |
| 连续度(CONTIG_MN) | 反映景观组分关系的异质性指数 |
| 斑块密度(PD) | 某一斑块类型在景观中的密度 |
| 斑块破碎化指数(SPLIT) | 景观空间被分割后的破碎化程度 |
| 最大斑块指数(LPI) | 某一单元中最大面积斑块的面积比例 |
| 聚集度指数(AI) | 景观或斑块聚合的程度 |
| 平均形状指数(SHAPE_AM) | 斑块边长与面积的比值 |
| 香农多样性指数(SHDI) | 描述景观的多样性 |
表3 各类型LCZ的PLAND与高温灾害风险值的相关系数Tab. 3 Correlation coefficient between the PLAND values of each type of LCZ and high temperature disaster risk values |
| LCZ类型 | 相关系数 | LCZ类型 | 相关系数 | |
| 注:**表示在0.01级别显著相关。 | ||||
| PLAND 1 | 0.208** | PLAND A | −0.190** | |
| PLAND 2 | 0.166** | PLAND B | −0.059** | |
| PLAND 3 | 0.156** | PLAND C | 0.288** | |
| PLAND 4 | 0.289** | PLAND D | −0.230** | |
| PLAND 5 | 0.294** | PLAND E | 0.223** | |
| PLAND 6 | 0.116** | PLAND F | 0.238** | |
| PLAND 8 | 0.490** | PLAND G | −0.572** | |
| PLAND 9 | −0.035** | PLAND H | 0.356** | |
| PLAND 10 | 0.274** | |||
表4 各类型 LCZ 面积占比Tab. 4 Area proportion of each LCZ type |
| LCZ类型 | 占比/% | LCZ类型 | 占比/% | |
| LCZ 1 | 0.02 | LCZ A | 3.73 | |
| LCZ 2 | 0.70 | LCZ B | 8.54 | |
| LCZ 3 | 0.86 | LCZ C | 6.67 | |
| LCZ 4 | 9.09 | LCZ D | 36.61 | |
| LCZ 5 | 5.77 | LCZ E | 0.35 | |
| LCZ 6 | 0.48 | LCZ F | 1.40 | |
| LCZ 8 | 7.84 | LCZ G | 13.28 | |
| LCZ 9 | 1.58 | LCZ H | 2.24 | |
| LCZ 10 | 0.84 |
表5 各指标GWR模型分析结果Tab. 5 Indicator analysis results from GWR model |
| 指标 | 最小值 | 中位数 | 最大值 | 平均值 | 正值面积占比/% | 负值面积占比/% |
| PLAND 4 | −0.102 | 0.094 | 0.662 | 0.104 | 90.35 | 9.65 |
| PLAND 5 | −0.584 | 0.096 | 1.699 | 0.092 | 85.05 | 14.95 |
| PLAND 8 | 0.114 | 0.262 | 0.525 | 0.269 | 100.00 | 0 |
| PLAND 10 | −5.487 | 0.230 | 2.160 | 0.236 | 86.28 | 13.72 |
| PLAND C | −3.021 | 0.118 | 3.121 | 0.024 | 81.69 | 18.31 |
| PLAND G | −1.013 | −0.478 | −0.263 | −0.496 | 0 | 100.00 |
| PLAND H | −1.498 | 0.246 | 0.909 | 0.295 | 99.80 | 0.20 |
| AI | −0.477 | −0.069 | 0.139 | −0.086 | 12.22 | 87.78 |
| SPLIT | −0.210 | −0.033 | 0.223 | −0.021 | 33.53 | 66.47 |
文中图表均由作者绘制,其中
| [1] |
Intergovernmental Panel on Climate Change (IPCC). Climate Change 2022: Impacts, Adaptation and Vulnerability Working Group II Contribution to the Sixth Assessment Report of the Intergovernmental Panel on Climate Change[R]. Cambridge: Cambridge University Press, 2022.
|
| [2] |
PERKINS S E. A Review on the Scientific Understanding of Heatwaves: Their Measurement, Driving Mechanisms, and Changes at the Global Scale[J]. Atmospheric Research, 2015, 164/165 242-267.
|
| [3] |
苏王新, 常青. 城市热缓解的基于自然的解决方案与实施路径: 以北京市为例[J]. 风景园林, 2022, 29(6): 26-32
SU W X, CHANG Q. Nature-Based Solutions for Urban Heat Mitigation and Implementation Path Thereof: A Case Study of Beijing[J]. Landscape Architecture, 2022, 29(6): 26-32.
|
| [4] |
ALAHMAD B, KHRAISHAH H, ROYÉ D, et al. Associations Between Extreme Temperatures and Cardiovascular Cause-Specific Mortality: Results from 27 Countries[J]. Circulation, 2023, 147(1): 35-46
|
| [5] |
ROMANELLO M, NAPOLI C D, GREEN C, et al. The 2023 Report of the Lancet Countdown on Health and Climate Change: The Imperative for a Health-Centred Response in a World Facing Irreversible Harms[J]. The Lancet, 2023, 402(10419): 2346-2394
|
| [6] |
易睿, 王亚林, 张殷俊, 等. 长江三角洲地区城市臭氧污染特征与影响因素分析[J]. 环境科学学报, 2015, 35(8): 2370-2377
YI R, WANG Y L, ZHANG Y J, et al. Pollution Characteristics and Influence Factors of Ozone in Yangtze River Delta[J]. Acta Scientiae Circumstantiae, 2015, 35(8): 2370-2377.
|
| [7] |
SANTAMOURIS M. Recent Progress on Urban Overheating and Heat Island Research. Integrated Assessment of the Energy, Environmental, Vulnerability and Health Impact. Synergies with the Global Climate Change[J]. Energy and Buildings, 2020, 207 109482
|
| [8] |
盛亮亮, 郝泷, 崔玉环, 等. 城市发展对地表热岛效应的影响及其相互关系研究: 以合肥市和南昌市为例[J]. 大气与环境光学学报, 2023, 18(6): 602-616
SHENG L L, HAO L, CUI Y H, et al. Influence of Urban Development on Surface Heat Island Effect and Its Relationship: A Case of Hefei and Nanchang[J]. Journal of Atmospheric and Environmental Optics, 2023, 18(6): 602-616
|
| [9] |
刘慧民, 马筝悦, 李淼, 等. 基于卫星遥感的城市热岛效应体检评估: 以武汉市为例[J]. 西部人居环境学刊, 2023, 38(6): 38-45
LIU H M, MA Z Y, LI M, et al. Examination and Evaluation of Urban Heat Island Effect Based on Satellite Remote Sensing: Taking Wuhan as an Example[J]. Journal of Human Settlements in West China, 2023, 38(6): 38-45.
|
| [10] |
DOUSSET B, GOURMELON F. Satellite Multi-sensor Data Analysis of Urban Surface Temperatures and Landcover[J]. ISPRS Journal of Photogrammetry and Remote Sensing, 2003, 58(1/2): 43-54.
|
| [11] |
WHO. Public Health Advice on Preventing Health Effects of Heat: New and Updated Information for Different Audiences[M]. Poland: Centre for Environment & Health (BON), 2011.
|
| [12] |
KNOWLTON K, KULKARNI S P, AZHAR G S, et al. Development and Implementation of South Asia’s First Heat-Health Action Plan in Ahmedabad (Gujarat, India)[J]. International Journal of Environmental Research and Public Health, 2014, 11(4): 3473-3492
|
| [13] |
World Meteorological Organization, World Health Organization. Heat Waves and Health: Guidance on Warning System Development[M]. Geneva: WMO, 2015.
|
| [14] |
黄晓军, 王博, 刘萌萌, 等. 中国城市高温特征及社会脆弱性评价[J]. 地理研究, 2020, 39(7): 1534-1547
HUANG X J, WANG B, LIU M M, et al. Characteristics of Urban Extreme Heat and Assessment of Social Vulnerability in China[J]. Geographical Research, 2020, 39(7): 1534-1547
|
| [15] |
李欢欢, 张明顺. 北京市高温热浪健康风险评估框架及应用[J]. 环境与健康杂志, 2020, 37(1): 58-65
LI H H, ZHANG M S. Framework and Application of Health Risk Assessment for Heat Wave in Beijing[J]. Journal of Environment and Health, 2020, 37(1): 58-65.
|
| [16] |
杨梅, 刘瑞, 苟晓娟, 等. 成渝双城经济圈高温热浪时空分析及风险评估[J]. 物探化探计算技术, 2022, 44(3): 392-402
YANG M, LIU R, GOU X J, et al. Spatial-Temporal Analysis and Risk Assessment of Heat Waves in the Chengdu-Chongqing Economic Circle[J]. Computing Techniques for Geophysical and Geochemical Exploration, 2022, 44(3): 392-402
|
| [17] |
CHENG C, FANG X Y, LI M C, et al. Rainstorm and High-Temperature Disaster Risk Assessment of Territorial Space in Beijing, China[J]. Meteorological Applications, 2023, 30(4): e2140
|
| [18] |
STEWART I D, OKE T R. Local Climate Zones for Urban Temperature Studies[J]. Bulletin of the American Meteorological Society, 2012, 93(12): 1879-1900
|
| [19] |
ZHENG Y S, REN C, XU Y, et al. GIS-Based Mapping of Local Climate Zone in the High-density City of Hong Kong[J]. Urban Climate, 2018, 24 419-448
|
| [20] |
XU D, ZHANG Q, ZHOU D, et al. Local Climate Zone in Xi'an City: A Novel Classification Approach Employing Spatial Indicators and Supervised Classification[J]. Buildings, 2023, 13(11): 2806
|
| [21] |
CHEN Y P, HU Y Z. The Urban Morphology Classification Under Local Climate Zone Scheme Based on the Improved Method: A Case Study of Changsha, China[J]. Urban Climate, 2022, 45 101271
|
| [22] |
董慰, 姜润声, 董禹, 等. 气候变化背景下热风险感知与住区居民体力活动的关系研究[J]. 风景园林, 2024, 31(4): 21-28
DONG W, JIANG R S, DONG Y, et al. Relationship Between Heat Risk Perception and Physical Activity of Residents in the Context of Climate Change[J]. Landscape Architecture, 2024, 31(4): 21-28
|
| [23] |
ZHANG L, NIKOLOPOULOU M, GUO S J, et al. Impact of LCZs Spatial Pattern on Urban Heat Island: A Case Study in Wuhan, China[J]. Building and Environment, 2022, 226 109785
|
| [24] |
PRADHESTA Y F, NURJANI E, AARJUDDIN B I. Local Climate Zone Classification for Climate-Based Urban Planning Using Landsat 8 Imagery (A Case Study in Yogyakarta Urban Area)[C]// Institute of Physics. IOP Conference Series: Earth and Environmental Science. Bandung: IOP Publishing Ltd, 2019: 012022.
|
| [25] |
YING L, CAO S S, DU M Y, et al. Local Climate Zone Mapping Using Remote Sensing: A Synergetic Use of Daytime Multi-view Ziyuan-3 Stereo Imageries and Luojia-1 Nighttime Light Data[J]. International Journal of Digital Earth, 2023, 16(1): 3456-3488
|
| [26] |
ZHOU Y, ZHANG G L, JIANG L, et al. Mapping Local Climate Zones and Their Associated Heat Risk Issues in Beijing: Based on Open Data[J]. Sustainable Cities and Society, 2021, 74 103174
|
| [27] |
CHEN G, CHEN Y, TAN X, et al. Assessing the Urban Heat Island Effect of Different Local Climate Zones in Guangzhou, China[J]. Building and Environment, 2023, 244 110770
|
| [28] |
FANG Y, DU X T, ZHAO H Y, et al. Assessment of Green Roofs’ Potential to Improve the Urban Thermal Environment: The Case of Beijing[J]. Environmental Research, 2023, 237, Part 1: 116857.
|
| [29] |
WANG Z, ISHIDA Y, MOCHIDA A. Effective Factors for Reducing Land Surface Temperature in Each Local Climate Zone Built Type in Tokyo and Shanghai[J]. Remote Sensing, 2023, 15(15): 3840
|
| [30] |
YUAN B, ZHOU L, HU F N, et al. Diurnal Dynamics of Heat Exposure in Xi’an: A Perspective from Local Climate Zone[J]. Building and Environment, 2022, 222 109400
|
| [31] |
DAS M, DAS A. Exploring the Pattern of Outdoor Thermal Comfort (OTC) in a Tropical Planning Region of Eastern India During Summer[J]. Urban Climate, 2020, 34 100708
|
| [32] |
LAM C K C, SHOOSHTARIAN S, KENAWY I. Assessment of Urban Physical Features on Summer Thermal Perceptions Using the Local Climate Zone Classification[J]. Building and Environment, 2023, 236 110265
|
| [33] |
LIU L, LIN Y Y, XIAO Y, et al. Quantitative Effects of Urban Spatial Characteristics on Outdoor Thermal Comfort Based on the LCZ Scheme[J]. Building and Environment, 2018, 143 443-460
|
| [34] |
SMITH G P, PERALTA TRIGO O, SARRICOLEA ESPINOSA P, et al. Climate-Sensitive Planning. Opportunities Through the Study of LCZs in Chile[J]. Building and Environment, 2023, 242 110444
|
| [35] |
郑颖生, 王墨, 李建军, 等. 城市高温风险评估与气候适应性规划策略: 以亚热带高密度城市深圳为例[J]. 规划师, 2021, 37(14): 13-19
ZHENG Y S, WANG M, LI J J, et al. Risk Assessment of High Temperature and Adaptive Planning Strategies: Shenzhen Example[J]. Planners, 2021, 37(14): 13-19
|
| [36] |
史志鹏. 局部气候分区视角下地表热环境及热风险评估[D]. 大连: 辽宁师范大学, 2023.
SHI Z P. Land Surface Thermal Environment and Thermal Risk Assessment from the Perspective of Local Climate Zone[D]. Dalian: Liaoning Normal University, 2023.
|
| [37] |
马俊俊, 王春磊, 黄晓红. 基于ASTER数据的地表温度遥感反演与产品检验: 以黑河流域为例[J]. 自然资源遥感, 2023, 35(1): 198-204
MA J J, WANG C L, HUANG X H. The Remote Sensing Inversion and Validation of Land Surface Temperature Based on ASTER Data: A Case Study of the Heihe River Basin[J]. Remote Sensing for Natural Resources, 2023, 35(1): 198-204.
|
| [38] |
王博, 郭鹏, 孟春红, 等. 基于FY-3D微波成像仪的中国陆地区域地表温度反演及验证[J]. 大气科学学报, 2022, 45(1): 112-123
WANG B, GUO P, MENG C H, et al. Retrieval and Verification of Land Surface Temperature in China Based on an FY-3D Microwave Radiation Imager[J]. Transactions of Atmospheric Sciences, 2022, 45(1): 112-123.
|
| [39] |
彭艳启. 湖南省极端温度事件时空变化及灾害风险评估[D]. 长沙: 湖南师范大学, 2021.
PENG Y Q. Study on Temporal and Spatial Changes of Extreme Temperature Events and Disaster Risks Assessment in Hunan Province[D]. Changsha: Hunan Normal University, 2021.
|
| [40] |
LU D S, TIAN H Q, ZHOU G M, et al. Regional Mapping of Human Settlements in Southeastern China with Multisensor Remotely Sensed Data[J]. Remote Sensing of Environment, 2008, 112(9): 3668-3679
|
| [41] |
武彩燕. 蓝色和绿色基础设施对城市地表温度的综合自然缓解效应[D]. 上海: 华东师范大学, 2022.
WU C Y. Integrated Nature-Based Solutions of Green and Blue Infrastructures to Mitigate Urban Land Surface Temperature[D]. Shanghai: East China Normal University, 2022.
|
| [42] |
WANG Y S, OUYANG W L. Investigating the Heterogeneity of Water Cooling Effect for Cooler Cities[J]. Sustainable Cities and Society, 2021, 75 103281
|
| [43] |
何苗, 徐永明, 李宁, 等. 基于遥感的北京城市高温热浪风险评估[J]. 生态环境学报, 2017, 26(4): 635-642
HE M, XU Y M, LI N, et al. Assessing Heat Wave Risk in Beijing by Remote Sensing[J]. Ecology and Environment Sciences, 2017, 26(4): 635-642.
|
| [44] |
王诗圣. 长三角地区高温热浪风险空间分布评估研究[D]. 南京: 南京信息工程大学, 2022.
WANG S S. Study on Spatial Distribution Assessment of High Temperature Heat Wave Risk in Yangtze River Delta Region[D]. Nanjing: Nanjing University of Information Science and Technology, 2022.
|
| [45] |
WU J G. Effects of Changing Scale on Landscape Pattern Analysis: Scaling Relations[J]. Landscape Ecology, 2004, 19(2): 125-138
|
| [46] |
WHITTAKER R H, NIERING W A. Vegetation of the Santa Catalina Mountains, Arizona. V. Biomass, Production, and Diversity Along the Elevation Gradient[J]. Ecology, 1975, 56(4): 771-790
|
| [47] |
朱冬雨, 陈涛, 牛瑞卿, 等. 利用移动窗口遥感生态指数分析矿区生态环境[J]. 武汉大学学报(信息科学版), 2021, 46(3): 341-347
ZHU D Y, CHEN T, NIU R Q, et al. Analyzing the Ecological Environment of Mining Area by Using Moving Window Remote Sensing Ecological Index[J]. Geomatics and Information Science of Wuhan University, 2021, 46(3): 341-347.
|
| [48] |
FOTHERINGHAM A S, BRUNSDON C. Local Forms of Spatial Analysis[J]. Geographical Analysis, 1999, 31(4): 340-358
|
/
| 〈 |
|
〉 |