
基于正射影像数据的绿视率计量方法研究
|
潘子暘/男/浙江农林大学风景园林与建筑学院在读硕士研究生/研究方向为风景园林与植物应用、风景园林规划与设计 |
|
胡路瑶/女/浙江农林大学风景园林与建筑学院在读硕士研究生/研究方向为风景园林资源及其保护利用、风景园林规划与设计 |
|
杨凡/男/博士/浙江农林大学风景园林与建筑学院副教授、硕士生导师/研究方向为植物景观功能及设计应用 |
|
包志毅/男/博士/浙江农林大学风景园林与建筑学院教授、名誉院长、博士生导师/本刊编委/研究方向为植物景观规划设计、园林植物资源和产业化 |
Copy editor: 刘颖
收稿日期: 2025-06-04
网络出版日期: 2026-03-12
基金资助
国家自然科学基金青年科学基金项目“基于AR技术的绿视率心理影响的量化研究——以居住区绿地为例”(31901362)
版权
Research on Measurement Methodology of Green View Index Based on Orthophoto Data
|
PAN Ziyang is a master student in the College of Landscape and Architecture, Zhejiang A&F University. His research focuses on landscape architecture and plant application, and landscape planning and design |
|
HU Luyao is a master student in the College of Landscape and Architecture, Zhejiang A&F University. Her research focuses on landscape resources and their conservation and utilization, and landscape planning and design |
|
YANG Fan, Ph.D., is an associate professor and master supervisor in the College of Landscape and Architecture, Zhejiang A&F University. His research focuses on vegetation landscape function and design application |
|
BAO Zhiyi, Ph.D., is a professor, honorary dean and doctoral supervisor in the College of Landscape and Architecture, Zhejiang A&F University, and an editorial board member of this journal. His research focuses on vegetation landscape planning and design, and vegetation resources and industrialization |
Received date: 2025-06-04
Online published: 2026-03-12
Copyright
针对传统绿视率(green view index, GVI)计量方法效率低、覆盖范围受限的问题,本研究提出一种基于正射影像数据的新型绿视率计量方法,旨在构建半自动化框架,以提升城市绿地可视性评估的效率与适用范围。
基于投影几何原理,构建绿视率与正射影像参数间的数学模型,利用正射影像提取植被空间分布与投影信息,构建三维模型以模拟绿视率场景,结合Python程序实现绿视率的自动识别与计算;最后通过与基于实地相机图像数据源的绿视率进行对比分析,验证该方法的可靠性。
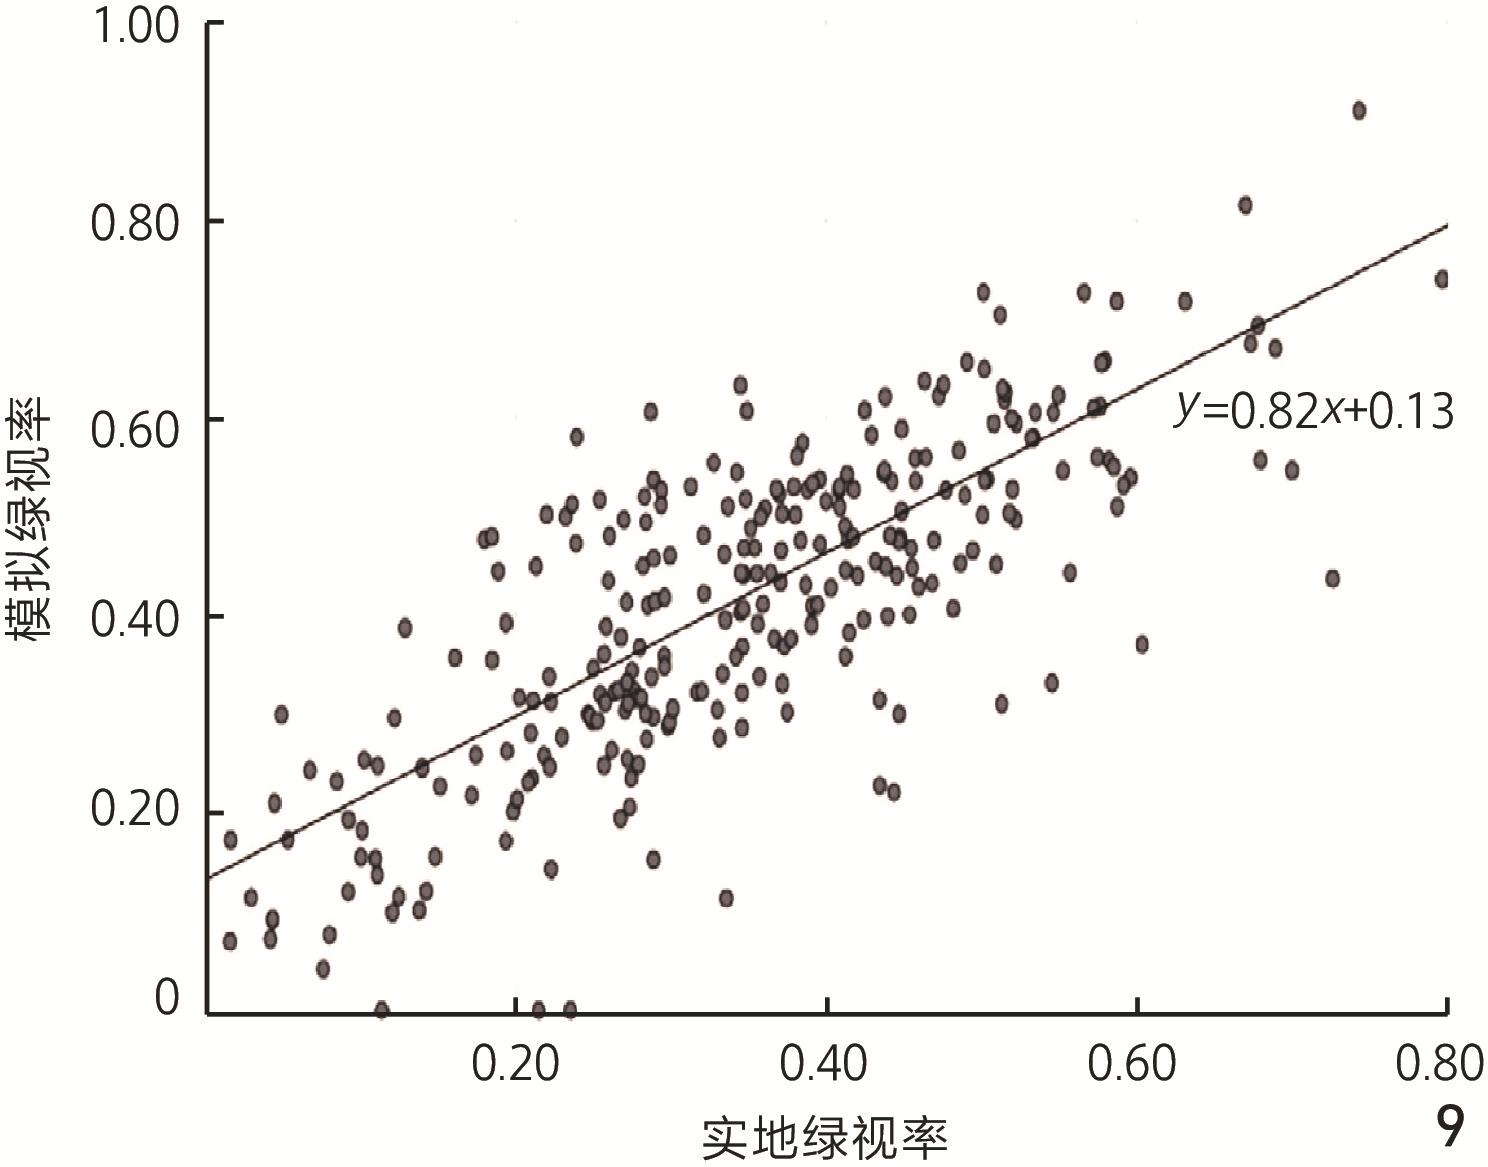
逻辑推导得出基于正射影像数据的绿视率计算式,从理论方面证明了方法的可行性,揭示了绿视率与正射影像中植物阴影的几何参数、太阳高度角、测点与周边绿化的空间距离等要素之间的定量映射关系。对275组实地与模拟绿视率数据的分析表明,两者呈现显著线性关系,模型验证了方法的可靠性。
基于正射影像的绿视率计量方法能够有效表征城市绿地的三维可视性,为绿视率自动化计量提供了可扩展的技术路径,有助于推动城市绿化评价体系向精细化与标准化方向发展。
潘子暘 , 胡路瑶 , 杨凡 , 包志毅 . 基于正射影像数据的绿视率计量方法研究[J]. 风景园林, 2026 , 33(2) : 115 -124 . DOI: 10.3724/j.fjyl.LA20250338
Against the backdrop of accelerating global urbanization, urban green space systems critically enhance ecological quality, mitigate urban heat island effects and air pollution, and improve residents’ physical and mental well-being with substantial physiological and psychological benefits. Under “Beautiful China” strategy, precise urban greening assessment has emerged as a core challenge in landscape architecture. The green view index (GVI), a 3D perceptual metric quantifying visible green vegetation proportion, better fulfills human-centered evaluation needs than traditional 2D indicators like green coverage rate. However, existing methods relying on manual field surveys, LiDAR point clouds, or street view imagery suffer from inefficiency, high costs, viewpoint simulation biases, limited coverage (often restricted to road networks), and high costs, hindering large-scale urban applications. To address interdisciplinary challenges in urban green space evaluation, this study proposes a novel orthophoto-based GVI measurement method to establish a semi-automated framework, overcoming traditional data limitations and significantly enhancing urban green visibility assessment efficiency, spatial coverage, and practical applicability for diverse green space types including enclosed parks and campuses.
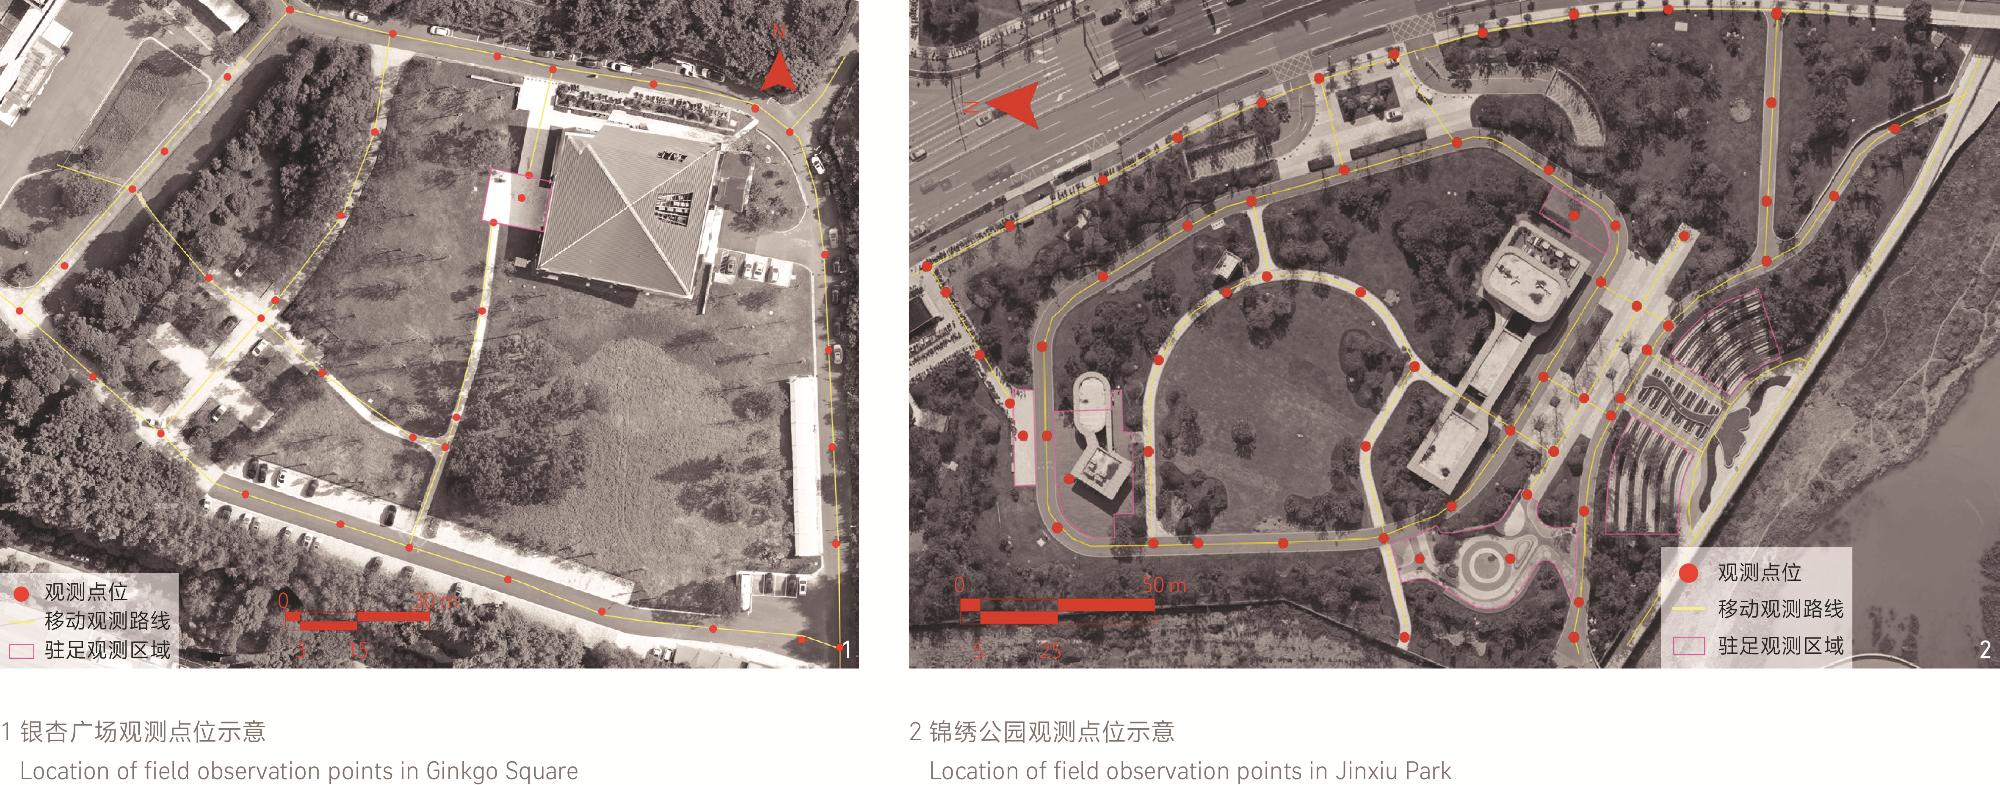
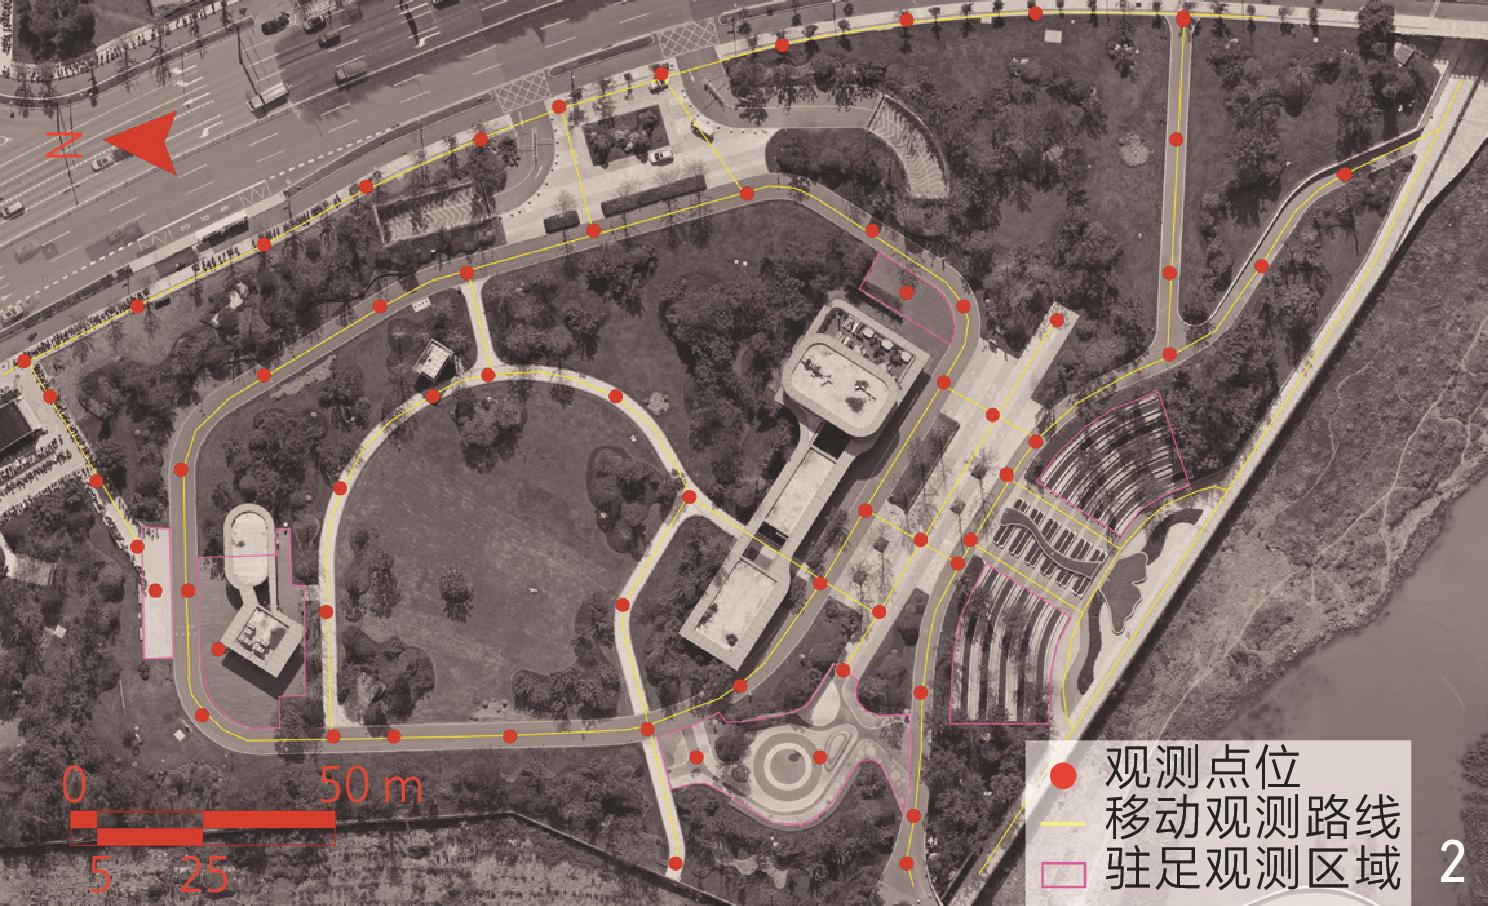
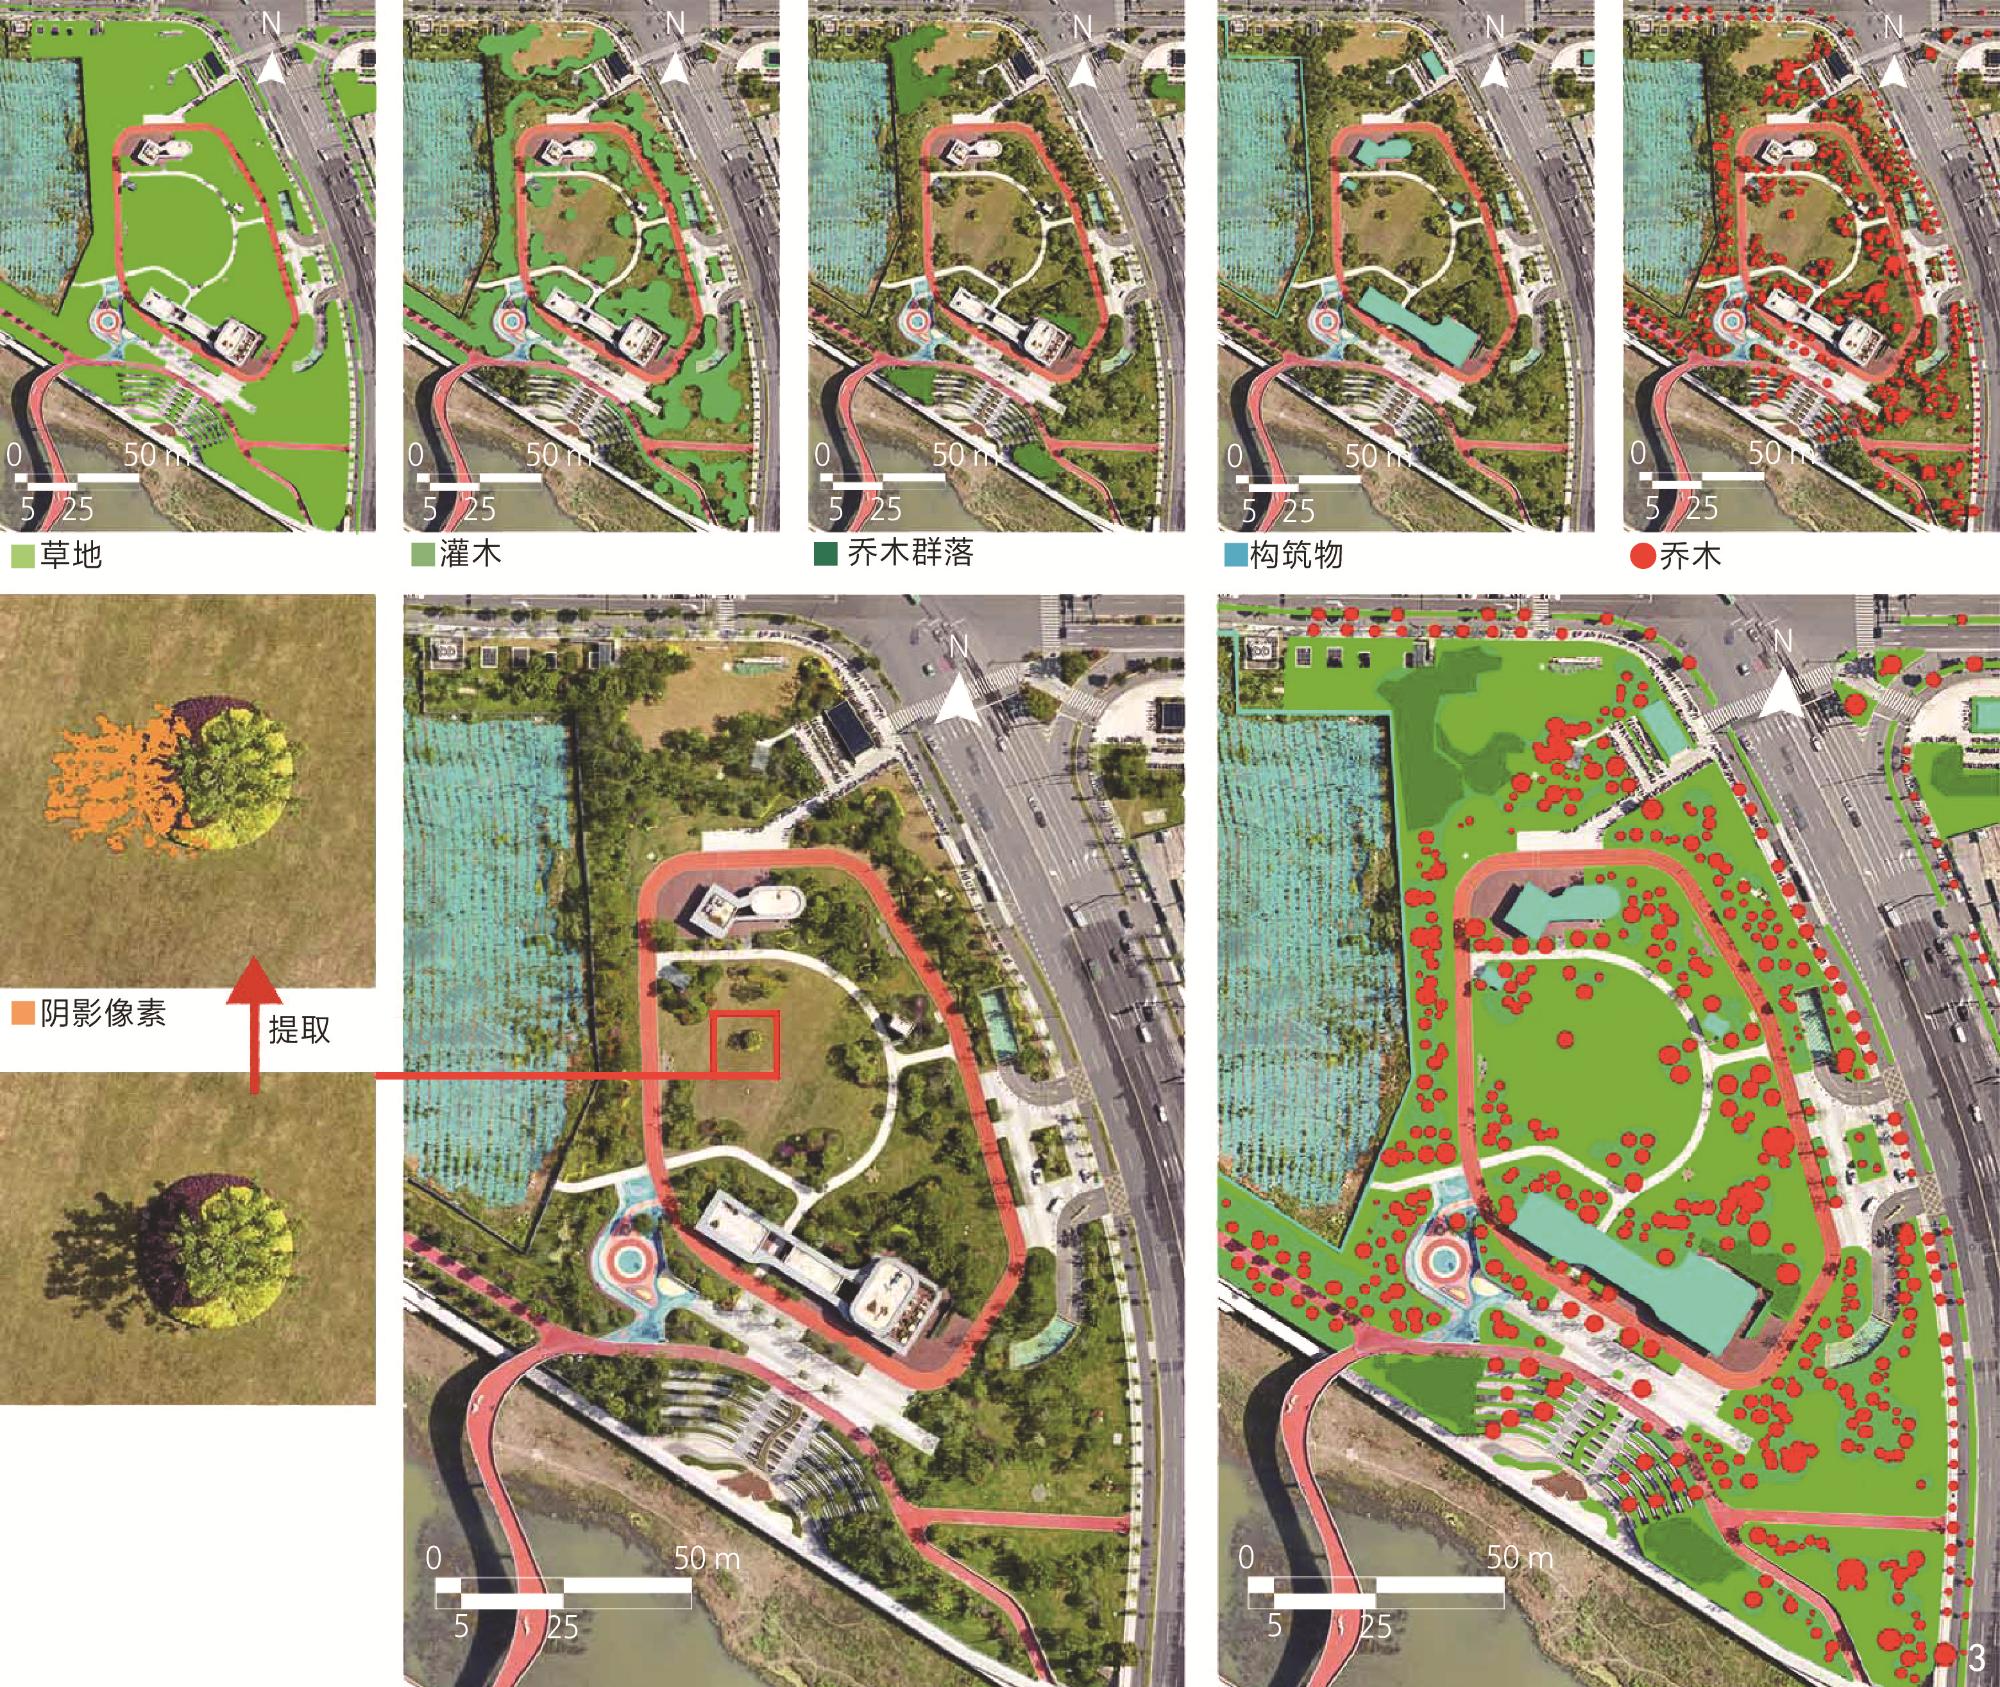
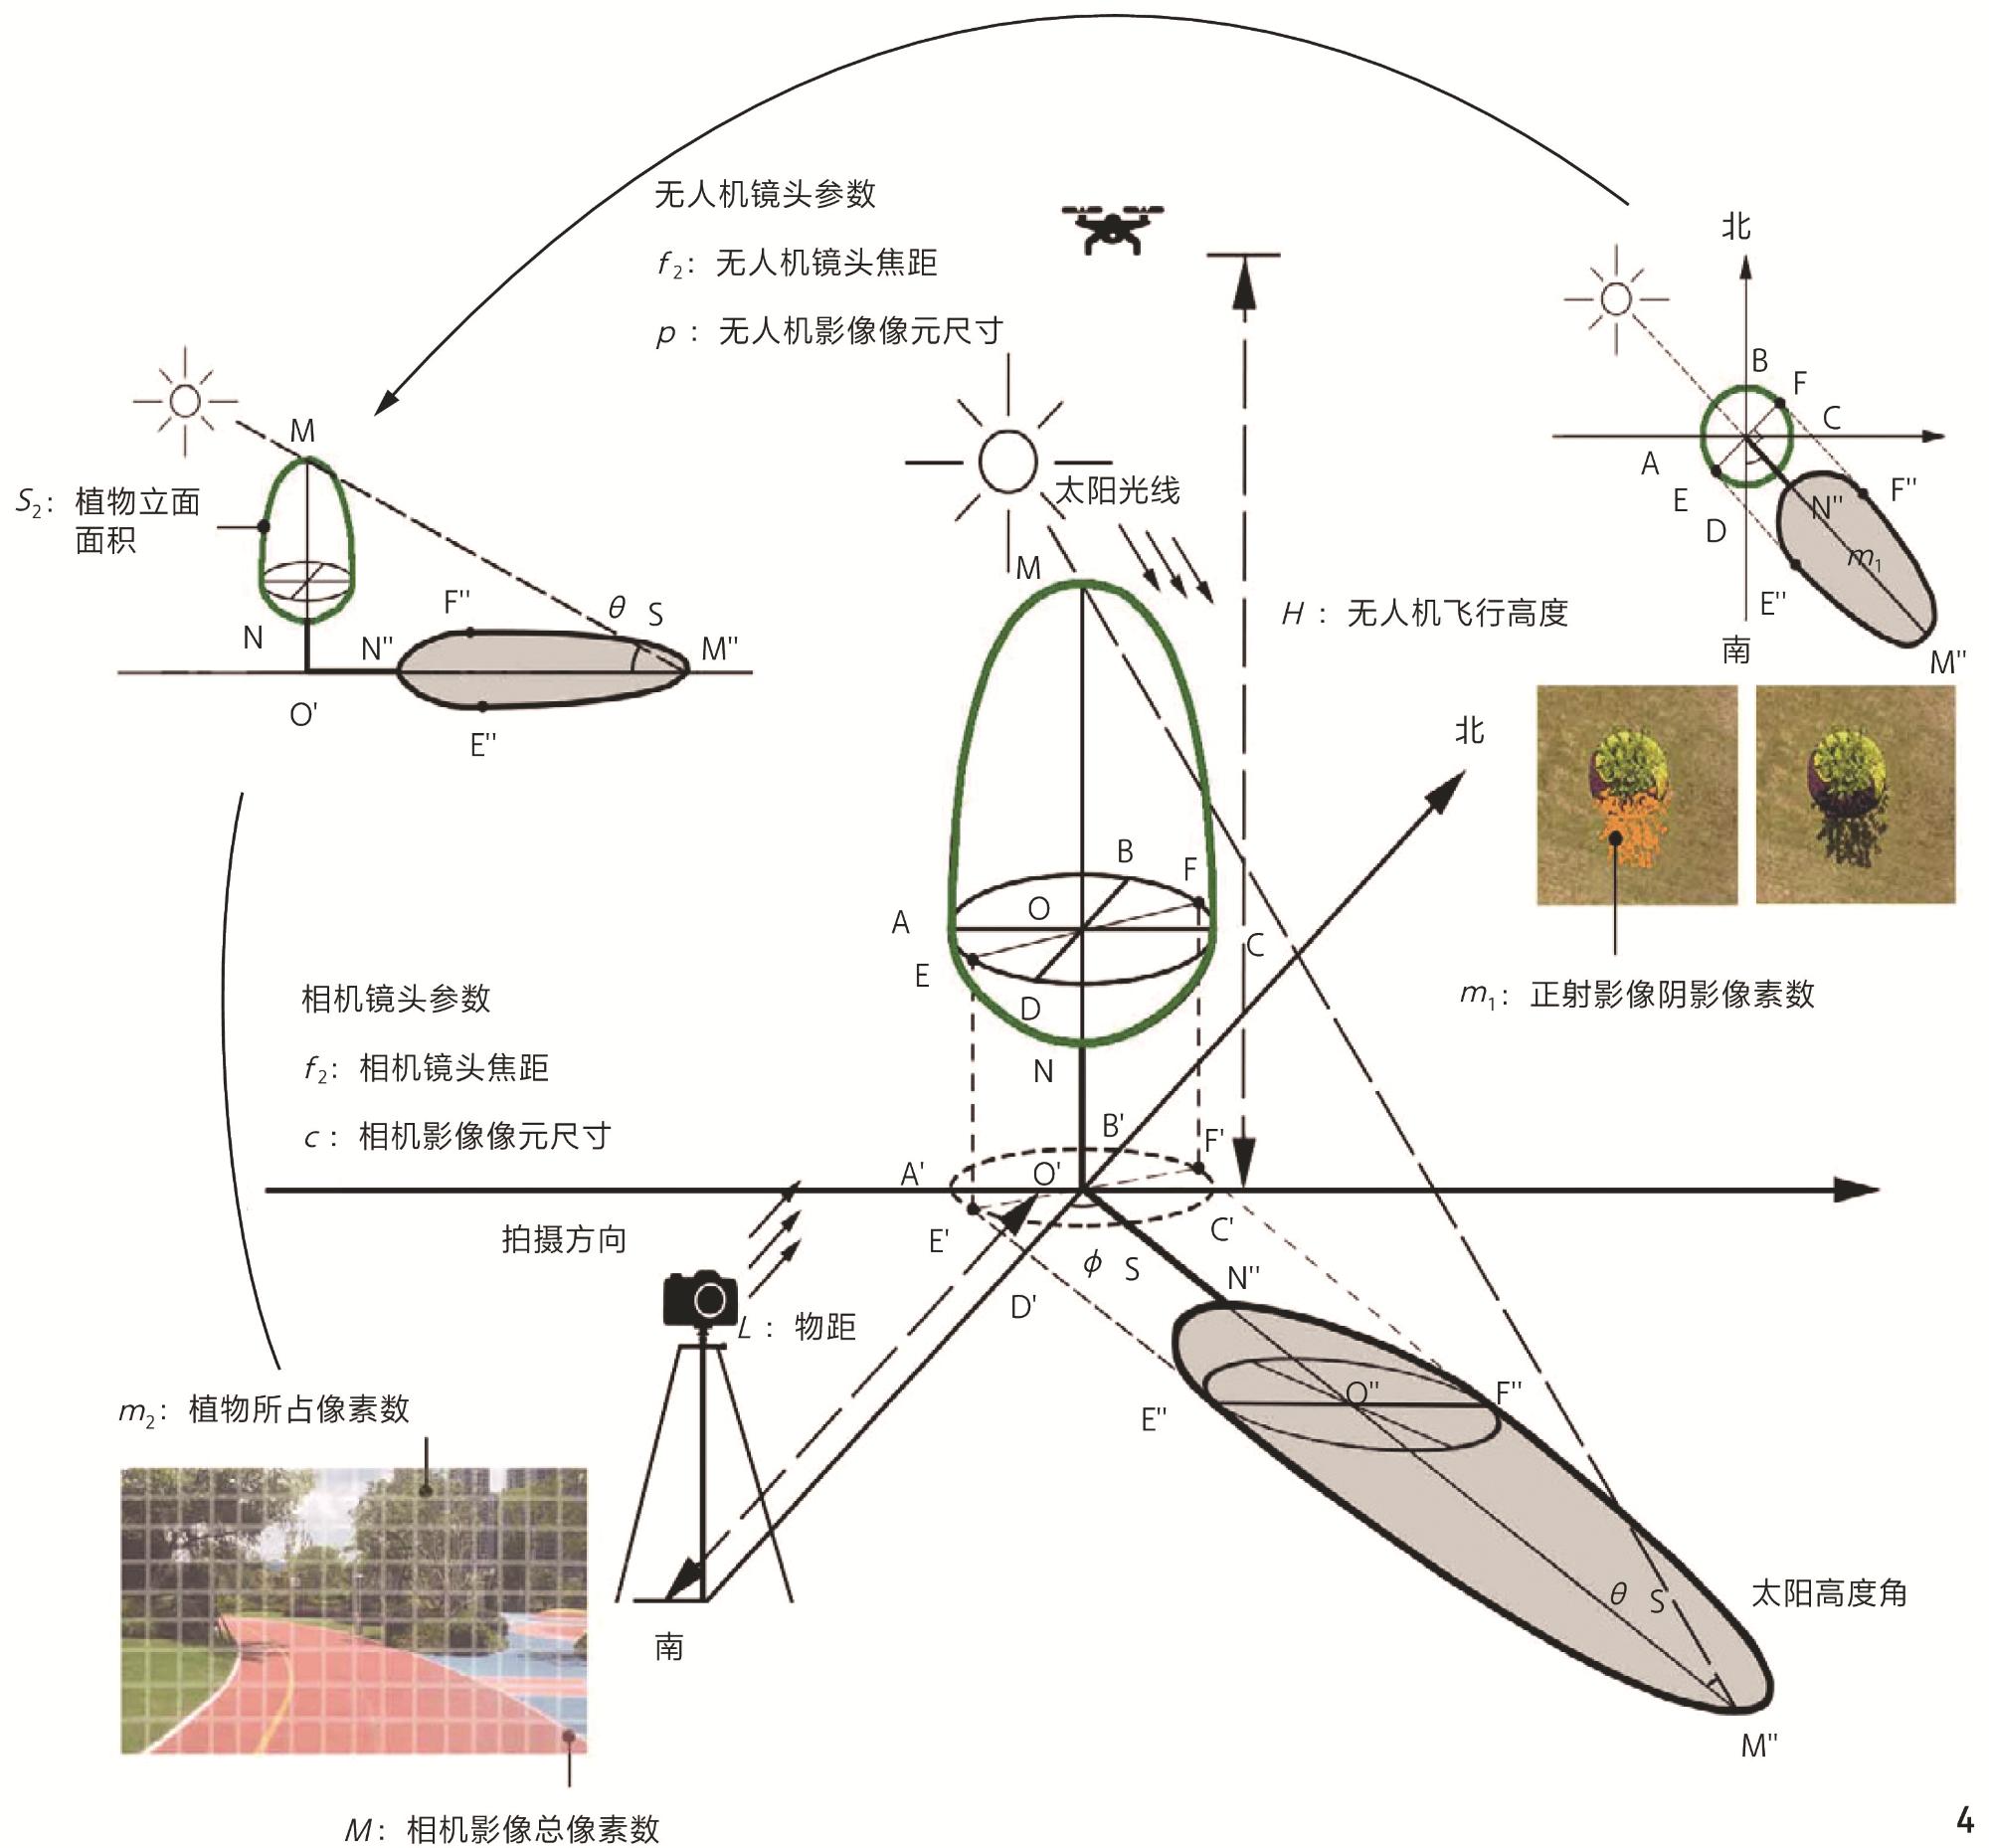
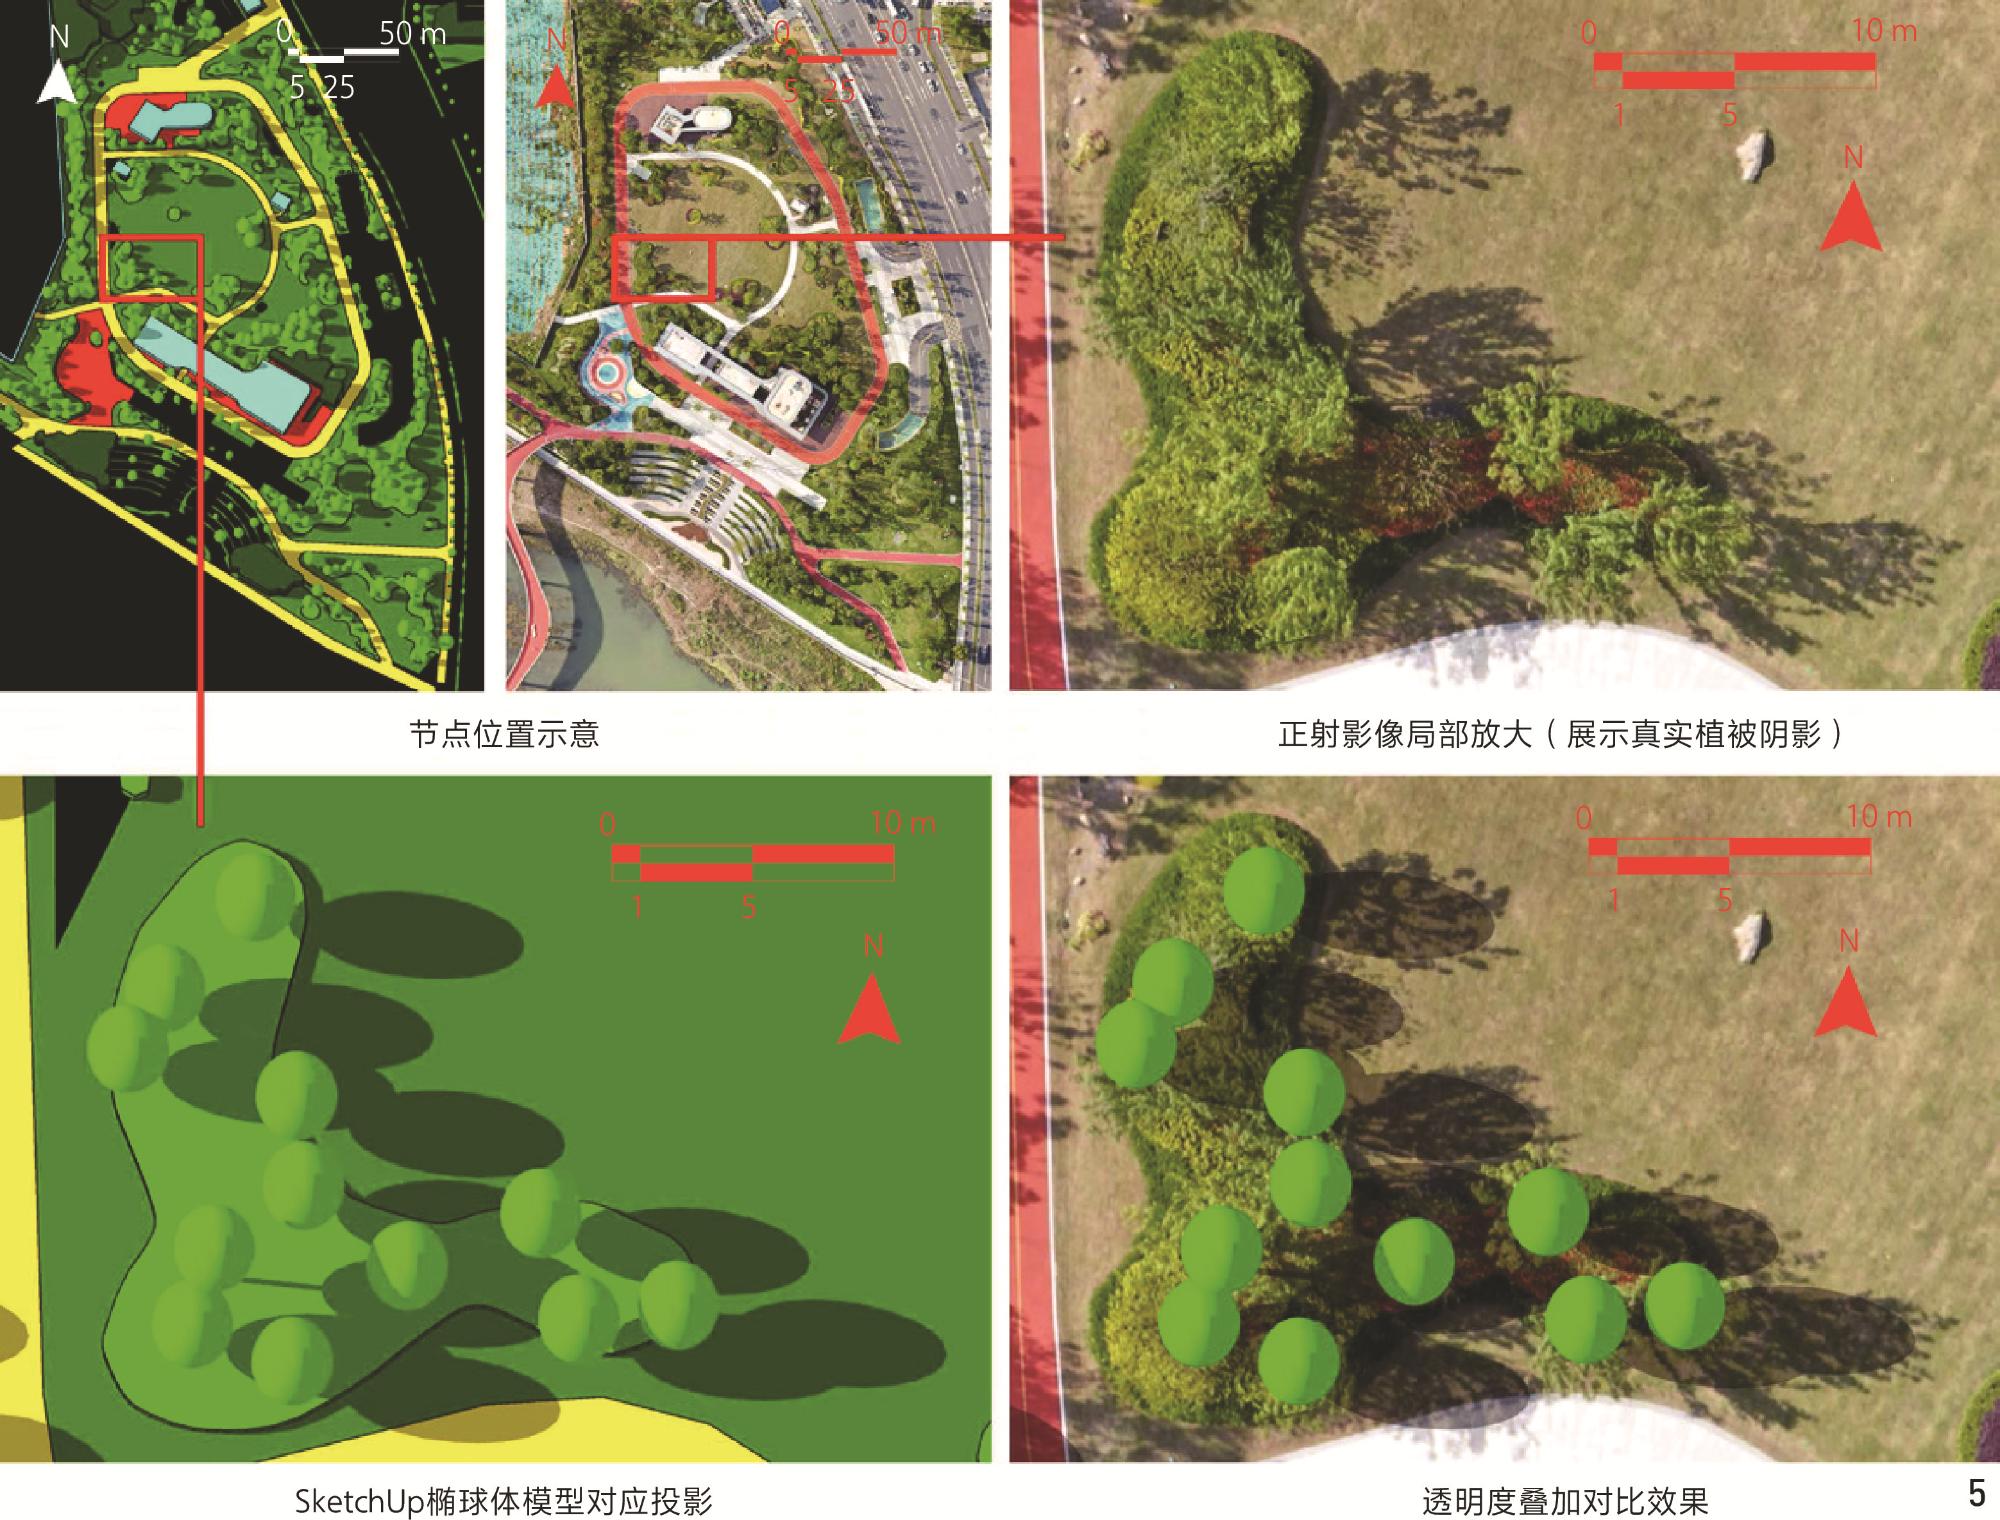
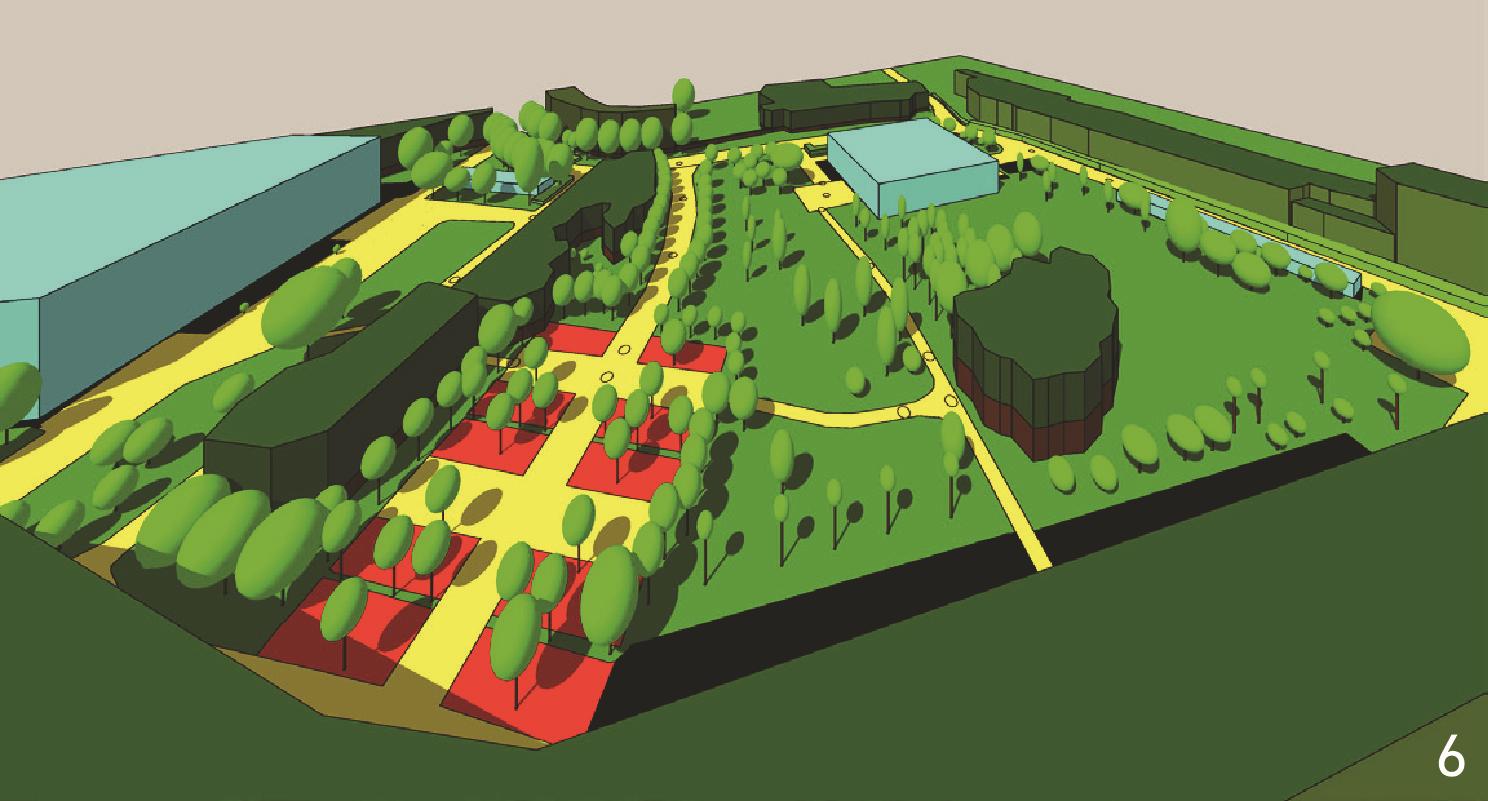
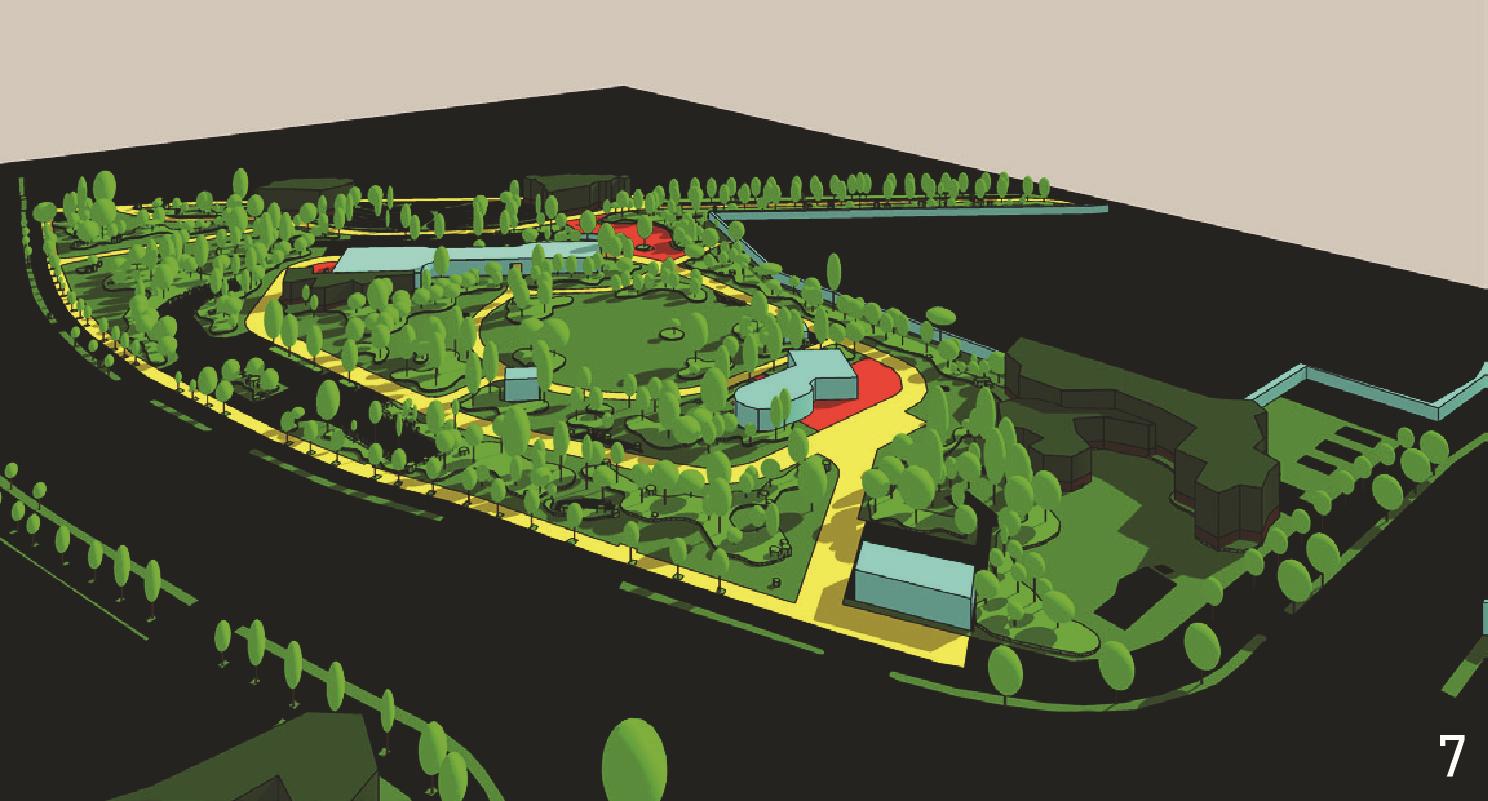
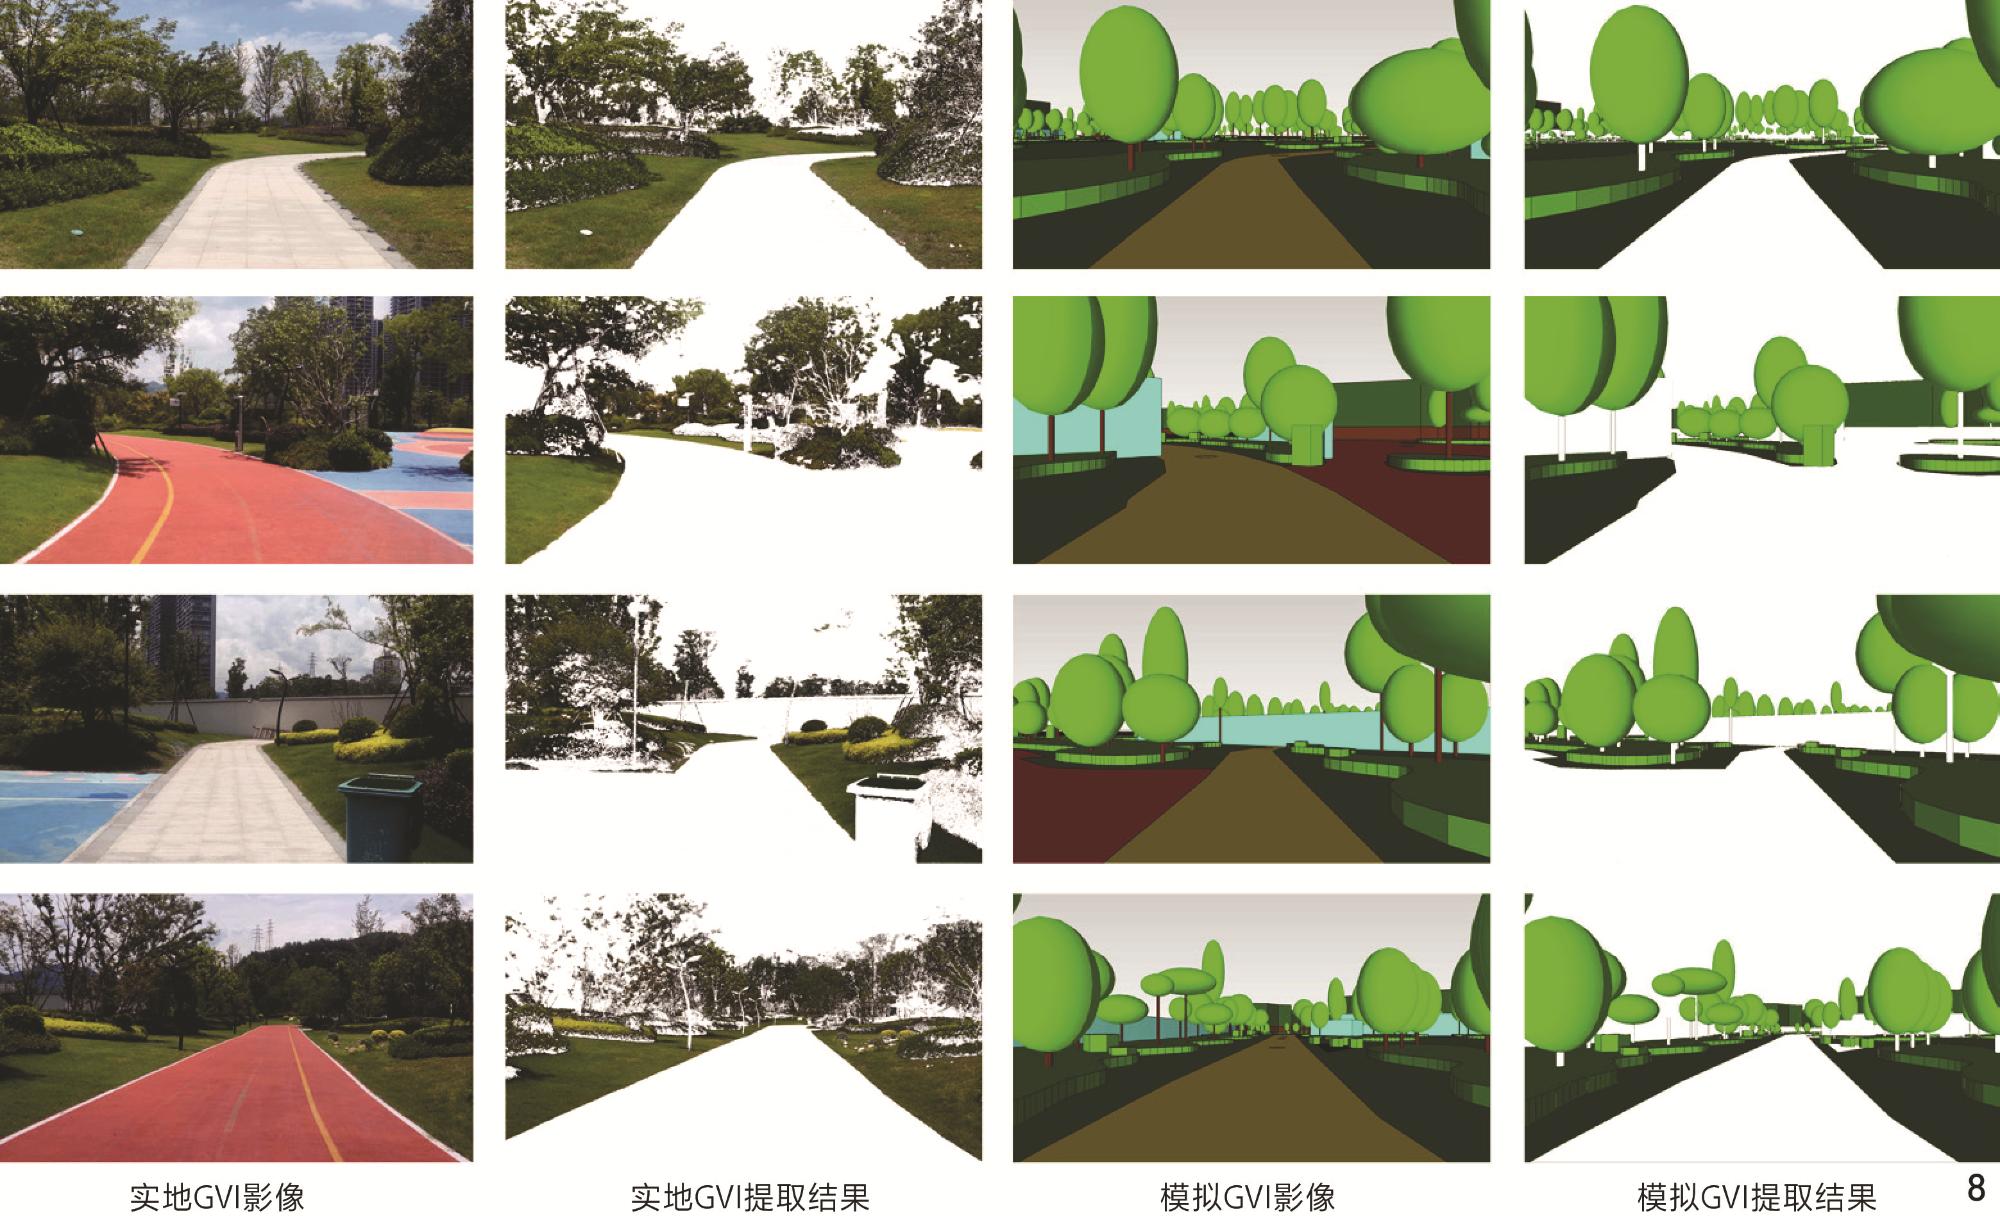
Two representative small-to-medium-scale, low-density green spaces—Ginkgo Square (YS) on a university campus and Jinxiu Park (JS) in Hangzhou Lin’an District—were strategically selected for validation, as their simplified vegetation structures minimized 3D occlusion complexities during this foundational study. Using stratified sampling reflecting pedestrian movement patterns, 112 observation points covered roads, recreational zones, and transitional areas. Based on projective geometry principles, a quantitative “shadow−facade−GVI” mapping model was developed: First, DJI Mavic 2 drones captured high-resolution orthophotos (100 m altitude, 10 mm focal length, 24 mm ground sample distance) during summer daylight hours, while 308 on-site GVI images were synchronously taken at 1.5 m eye height using standardized protocols (24 mm focal length, 16∶9 aspect ratio) to simulate human perspective. Pix4Dmapper software performed geometric corrections (WGS 84/UTM zone 50N), enabling manual extraction of vegetation shadow locations and pixel areas (m 1) from orthophotos. Vegetation facade area (S 2=S 1·tanθ S) and equivalent volumes (modeled as rotational ellipsoids) were derived using solar elevation angle (θ S), dynamically calculated from GPS coordinates, date, and local time. SketchUp then constructed simplified 3D scene models—representing trees as ellipsoid canopies (derived from crown shadows) combined with cylindrical trunks, extruding shrubs/structures from shadow footprints, and modeling dense woodlands as aggregated volumes. The theoretically derived formula I GV=(m 1×tanθ S/M) (f 1×p×H/f 2×c×L)2×100% quantified relationships between GVI and orthophoto-measured parameters. Python scripts automated GVI calculation by identifying green pixels, with pedestrian-route-weighted spatial integration generating overall site GVI. Model reliability was rigorously tested via Spearman’s rank correlation and linear regression analyses using 275 paired field-simulation samples.
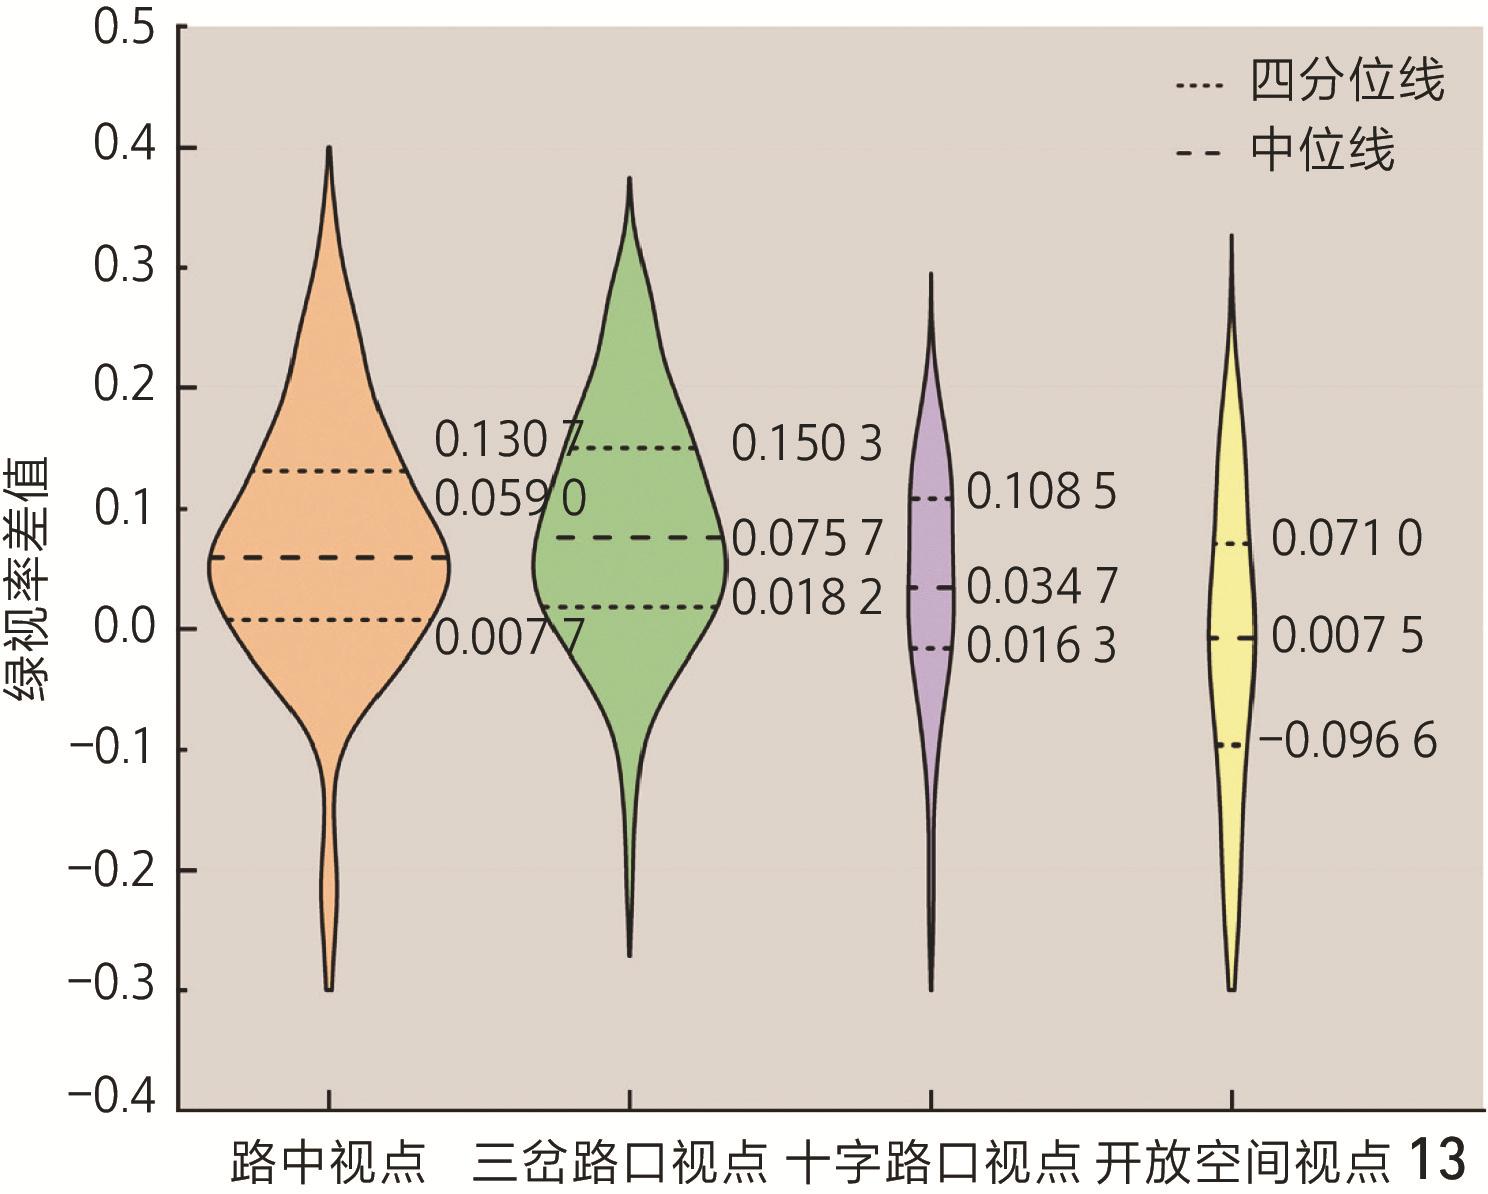
Mathematical derivation confirmed GVI’s direct calculability from orthophoto-extracted parameters—shadow area (m 1), solar elevation (θ S), camera specifications (focal length f 2, pixel size c), and observer-to-vegetation distance (L)—establishing a robust 2D-to-3D visual perception conversion mechanism. Statistical analysis of 275 validation datasets revealed a highly significant linear relationship between simulated and field-measured GVI: I GV, simulated = 0.82 × I GV, field + 0.13 (R 2=0.593, p < 0.001). Site-level GVI errors remained low (YS: 44.60% simulated vs. 41.17% field, Δ = 3.43%; JS: 38.19% vs. 32.63%, Δ = 5.56%), demonstrating method consistency. Scenario-based analysis further revealed: strongest correlation in open recreational areas (r=0.841), tightly clustered errors at road nodes, systematic overestimation in low-GVI scenarios (<40%) likely due to minor shadow detection artifacts, and higher variability in open-space viewpoints (IQR span:
This study innovatively leverages widely available orthophotos to create a semi-automated GVI measurement framework, achieving standardized image analysis workflows, breaking street-view imagery’s road-network dependency and extending robust assessment to parks, campuses, and enclosed green spaces previously excluded from automated evaluation. With significantly reduced errors compared to traditional methods, this method establishes a scalable pathway for citywide green visual database construction, advancing urban greening evaluation towards operational precision and standardization. Current manual modeling steps are solely for validation, while parametric tools enable full automation potential. Integration with China’s National Territorial Survey Cloud Platform enables seamless geospatial data fusion, while Digital Twin compatibility supports dynamic visualization of green view service efficacy, serving the human-centered ecological governance goals in the "Beautiful China" strategy. Current limitations include terrain data absence-induced about 10% systematic errors in sloped terrain and dense canopy occlusion requiring aggregated estimation, which will be addressed through near-future enhancements: fusing open-source DEM data for terrain-aware occlusion modeling and embedding semantic segmentation-based deep learning algorithms for automated shadow segmentation and classification.
表1 正射影像乔木测量数据(部分)Tab. 1 Tree measurement data from orthophotos (partial) |
| 序号 | x坐标/ 像素 | y坐标/ 像素 | 旋转椭球体 | 圆柱体 | ||||
| 底部z坐标/像素 | 短轴/mm | 长轴/mm | 底部z坐标/像素 | 直径/mm | 高度/mm | |||
| JS0589 | 11 406 | 4 613 | 200.00 | 5 120 | 8 520 | 0 | 200 | 4 800 |
| JS0590 | 11 325 | 4 682 | 37.50 | 1 910 | 3 340 | 0 | 200 | 900 |
| JS0591 | 7 005 | 2 576 | 116.67 | 4 400 | 8 380 | 0 | 200 | 2 800 |
| JS0592 | 7 284 | 1 849 | 25.00 | 3 780 | 3 040 | 0 | 200 | 600 |
| JS0593 | 7 435 | 2 208 | 25.00 | 3 780 | 3 040 | 0 | 200 | 600 |
| JS0594 | 7 747 | 2 664 | 37.50 | 3 650 | 1 600 | 0 | 200 | 900 |
表2 实地绿视率与模拟绿视率的相关性分析Tab. 2 Field and simulated GVI correlation analysis |
| 变量 | 模拟绿视率 | 实地绿视率 |
|---|---|---|
| 注:**表示在0.01级别(双尾),相关性显著。 | ||
| 模拟绿视率 | 1.000 | 0.751** |
| 实地绿视率 | 0.751** | 1.000 |
表3 线性回归模型结果Tab. 3 Linear regression model results |
| 模型项 | B | SE | β | t | p |
| 注:B为非标准化系数,SE为标准误差,β为标准化系数,t为t检验值,p为显著性水平,R²为决定系数,F为F检验值。 | |||||
| 常量 | 0.128 | 0.016 | 8.191 | <0.001 | |
| 实地绿视率 | 0.817 | 0.041 | 0.770 | 19.958 | <0.001 |
| R 2 | 0.593 | ||||
| F | 398.325 | ||||
| p | <0.001 | ||||
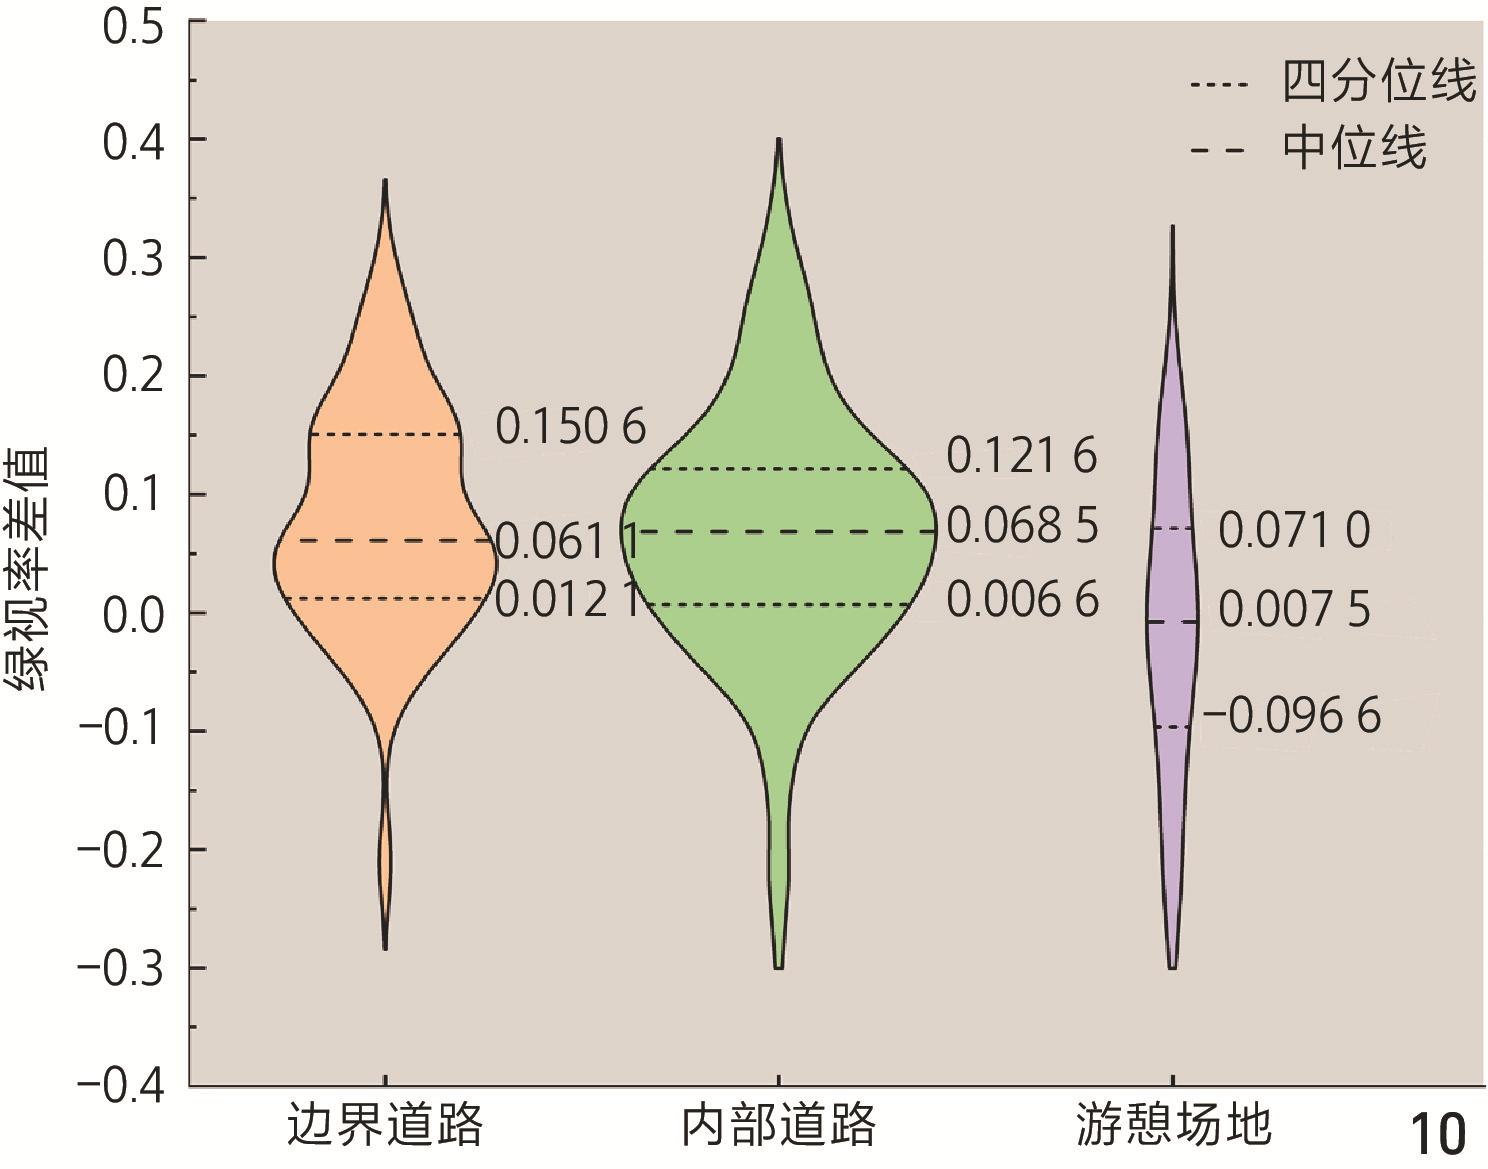
图10 基于空间功能分异的绿视率差值分布特征Fig. 10 Distribution of GVI difference across spatial functional differentiations |
表4 基于空间功能分异的实地绿视率与模拟绿视率相关性分析Tab. 4 Field and simulated GVI correlation analysis across spatial functional zones |
| 场景特征 | 变量 | 模拟绿视率 | 实地绿视率 |
|---|---|---|---|
| 注:**表示在0.01级别(双尾),相关性显著。 | |||
| 边界道路 | 模拟绿视率 | 1.000 | 0.743** |
| 实地绿视率 | 0.743** | 1.000 | |
| 内部道路 | 模拟绿视率 | 1.000 | 0.725** |
| 实地绿视率 | 0.725** | 1.000 | |
| 游憩场地 | 模拟绿视率 | 1.000 | 0.841** |
| 实地绿视率 | 0.841** | 1.000 | |
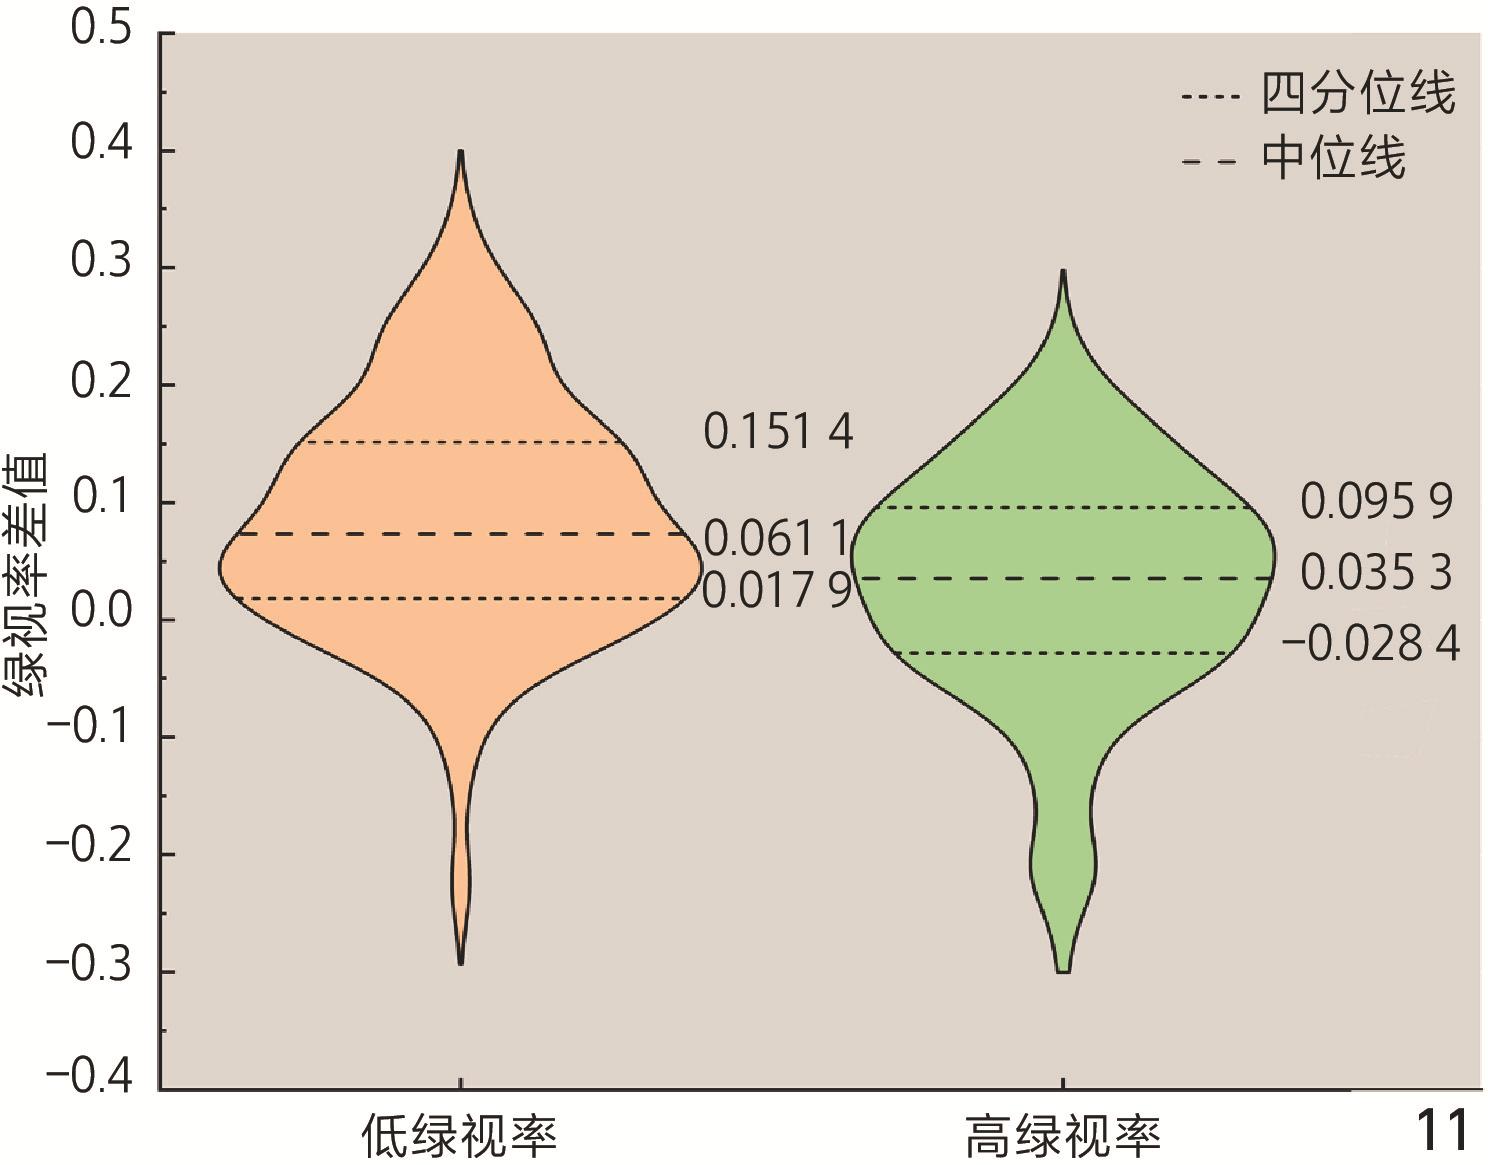
图11 基于实地绿视率水平的绿视率差值分布特征Fig. 11 Distribution of GVI difference across field GVI levels |
表5 基于实地绿视率水平的实地绿视率与模拟绿视率相关性分析Tab. 5 Field and simulated GVI correlation analysis stratified by field GVI levels |
| 场景特征 | 变量 | 模拟绿视率 | 实地绿视率 |
|---|---|---|---|
| 注:**表示在0.01级别(双尾),相关性显著。 | |||
| 低绿视率 | 模拟绿视率 | 1.000 | 0.686** |
| 实地绿视率 | 0.686** | 1.000 | |
| 高绿视率 | 模拟绿视率 | 1.000 | 0.464** |
| 实地绿视率 | 0.464** | 1.000 | |
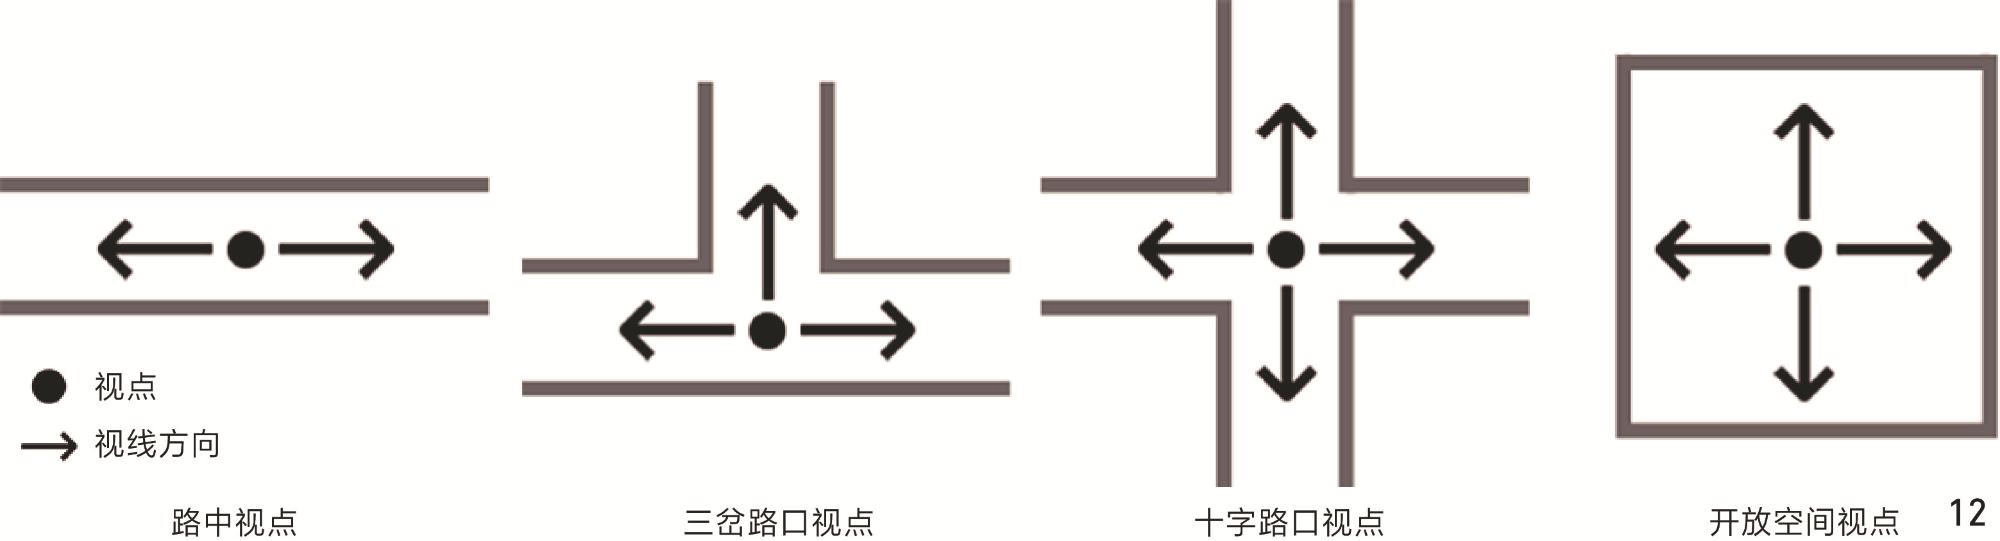
图12 基于空间布局与视觉视角的GVI视点分类Fig. 12 Classification of GVI viewpoints incorporating spatial layout and visual perspectives |
图13 基于空间布局以及视觉视角的绿视率差值分布特征Fig. 13 Distribution of GVI difference across spatial layout and visual perspective |
表6 基于空间布局与视觉视角的实地绿视率与模拟绿视率相关性分析Tab. 6 Field and simulated GVI correlation analysis incorporating spatial layout and visual perspectives |
| 场景特征 | 变量 | 模拟绿视率 | 实地绿视率 |
|---|---|---|---|
| 注:**表示在0.01级别(双尾),相关性显著。 | |||
| 路中视点 | 模拟绿视率 | 1.000 | 0.726** |
| 实地绿视率 | 0.726** | 1.000 | |
| 三岔路口视点 | 模拟绿视率 | 1.000 | 0.755** |
| 实地绿视率 | 0.755** | 1.000 | |
| 十字路口视点 | 模拟绿视率 | 1.000 | 0.844** |
| 实地绿视率 | 0.844** | 1.000 | |
| 开放空间视点 | 模拟绿视率 | 1.000 | 0.841** |
| 实地绿视率 | 0.841** | 1.000 | |
1、创新性地利用正射影像替代传统数据源,构建基于投影几何原理的绿视率计量模型,突破街景数据源局限于道路网络的瓶颈,提升数据获取效率与覆盖范围。
2、系统揭示了绿视率与正射影像中各要素的定量映射关系,并基于275组实地-模拟绿视率数据的对比验证,证实计量方法可靠性,为绿视率自动化计量提供理论基础与实证支撑。
3、利用易获取的无人机与卫星的正射影像,显著降低了对实地数据的依赖与成本,为构建大范围绿地视觉数据库提供支撑,助力美丽中国建设与人本绿化评价。
| [1] |
XIAO Y, GAN S, HUANG M D, et al. The Evaluation of Urban Green Space Landscape Changes and Ecosystem Services in Beijing[J]. Journal of Resources and Ecology, 2022, 13 (5): 897-911.
|
| [2] |
LI G D, CAO Y, FANG C L, et al. Global Urban Greening and Its Implication for Urban Heat Mitigation[J]. Proceedings of the National Academy of Sciences of the United States of America, 2025, 122 (4): e2417179122
|
| [3] |
LI K, MAO Y P, LI Y J, et al. Exploring the Pathways of Urban Green Space Exposure on Respiratory Health: An Empirical Study in Nanjing, China[J]. Urban Forestry & Urban Greening, 2024, 101: 128536
|
| [4] |
ENGEMANN K, PEDERSEN C B, ARGE L, et al. Residential Green Space in Childhood Is Associated with Lower Risk of Psychiatric Disorders from Adolescence into Adulthood[J]. PNAS, 2019, 116 (11): 5188-5193.
|
| [5] |
青木阳二.視野の広がリと緑量感の関連[J].造园杂志, 198, 51(1): 1-10.
AOKI Y. The Relationship Between the Expansion of Field of View and the Perception of Green Quantity[J]. Journal of the Japanese Institute of Landscape Architecture, 1987, 51(1): 1-10.
|
| [6] |
杨纯, 蒋恬田, 李欣, 等. 绿化覆盖率对城市绿地破碎度与地表温度的关系的影响[J]. 生态环境学报, 2024, 33 (2): 242-248.
YANG C, JIANG T T, LI X, et al. Effects of Percent Green Cover on the Relationship Between Greenspace Fragmentation and Land Surface Temperature: A Case Study in Changsha, China[J]. Ecology and Environmental Sciences, 2024, 33 (2): 242-248.
|
| [7] |
孙淑萍, 古润泽, 张晶. 北京城区不同绿化覆盖率和绿地类型与空气中可吸入颗粒物(PM10)[J]. 中国园林, 2004, 20 (3): 77-79.
SUN S P, GU R Z, ZHANG J. Inhalable Particulate Matter (PM10) Related to Different Green Cover Percentage and Greenbelt Types in Beijing[J]. Chinese Landscape Architecture, 2004, 20 (3): 77-79.
|
| [8] |
DEĞERMENCI A S, ZENGIN H. Determining the Effect of Green Space Ratio and Urbanization on the Land Surface Temperature, a Case Study in the Istanbul Metropolitan[J]. Contemporary Problems of Ecology, 2024, 17 (5): 743-760.
|
| [9] |
朱怀真, 杨凡, 南歆格, 等. 国内外绿视率研究进展[J]. 中国城市林业, 2022, 20 (3): 140-146.
ZHU H Z, YANG F, NAN X G, et al. Research Progress in Visible Green Index[J]. Journal of Chinese Urban Forestry, 2022, 20 (3): 140-146.
|
| [10] |
NIE W, JIA J X, WANG M M, et al. Research on the Impact of Panoramic Green View Index of Virtual Reality Environments on Individuals’ Pleasure Level Based on EEG Experiment[J]. Landscape Architecture Frontiers, 2022, 10 (2): 36
|
| [11] |
MAAS J, VERHEIJ R A, GROENEWEGEN P P, et al. Green Space, Urbanity, and Health: How Strong Is the Relation?[J]. Journal of Epidemiology and Community Health, 2006, 60 (7): 587-592.
|
| [12] |
GRAHN P, STIGSDOTTER U A. Landscape Planning and Stress[J]. Urban Forestry & Urban Greening, 2003, 2 (1): 1-18.
|
| [13] |
DZHAMBOV A M, MARKEVYCH I, TILOV B G, et al. Residential Greenspace Might Modify the Effect of Road Traffic Noise Exposure on General Mental Health in Students[J]. Urban Forestry & Urban Greening, 2018, 34: 233-239.
|
| [14] |
LIAO J Q, ZHANG B, XIA W, et al. Residential Exposure to Green Space and Early Childhood Neurodevelopment[J]. Environment International, 2019, 128: 70-76.
|
| [15] |
折原夏志. 緑景観の評価に関する研究: 良好な景観形成に向けた 緑の評価手法に関する考察[J]. 調査研究期報, 2006 (3): 4-13.
ORIHARA N. A Study on the Evaluation of Green Landscapes: An Examination of Green Assessment Methods for Forming Good Landscapes[J]. Research Report, 2006 (3): 4-13.
|
| [16] |
陈明, 戴菲, 李文佩, 等. 基于绿视率的城市绿化评估: 以武汉江汉区为例[J]. 中国城市林业, 2019, 17 (3): 1-6.
CHEN M, DAI F, LI W P, et al. A Study of Urban Greening Assessment Based on Visible Green Index: A Case Study of Jianghan District in Wuhan[J]. Journal of Chinese Urban Forestry, 2019, 17 (3): 1-6.
|
| [17] |
张驰.基于DeepLab V3+框架的上海静安区街道绿视率评价及驱动因素研究[D].上海: 上海应用技术大学, 2022.
ZHANG C. Evaluation of Street Green View Index and Driving Factors in Jing’an District, Shanghai Based on DeepLab V3+ Framework[D]. Shanghai: Shanghai Institute of Technology, 2022.
|
| [18] |
张超群.基于街景图片数据的长春市中心城区生活街道空间品质评价研究[D].长春: 吉林农业大学, 2022.
ZHANG C Q. Evaluation of Residential Street Space Quality in Central Changchun Based on Street View Image Data[D]. Changchun: Jilin Agricultural University, 2022.
|
| [19] |
张炜, 周昱杏, 杨梦琪. 全景绿视率自动识别和计算研究[J]. 风景园林, 2019, 26 (10): 89-94.
ZHANG W, ZHOU Y X, YANG M Q. Research on Automatic Identification and Measurement of Panoramic Visible Green Index[J]. Landscape Architecture, 2019, 26 (10): 89-94.
|
| [20] |
刘晓天, 孙冰, 廖超, 等. 基于街景图像的城市街道绿视率计量方法比较分析[J]. 江西农业大学学报, 2020, 42 (5): 1022-1031.
LIU X T, SUN B, LIAO C, et al. Comparison of Computational Methods for Urban Street Green View Indexes Based on Street View Images[J]. Acta Agriculturae Universitatis Jiangxiensis, 2020, 42 (5): 1022-1031.
|
| [21] |
徐磊青, 江文津, 陈筝. 公共空间安全感研究: 以上海城市街景感知为例[J]. 风景园林, 2018, 25 (7): 23-29.
XU L Q, JIANG W J, CHEN Z. Study on Perceived Safety in Public Spaces: Take Perception of Stree View in Shanghai as an Example[J]. Landscape Architecture, 2018, 25 (7): 23-29.
|
| [22] |
BERLAND A, LANGE D A. Google Street View Shows Promise for Virtual Street Tree Surveys[J]. Urban Forestry & Urban Greening, 2017, 21: 11-15.
|
| [23] |
GONG F Y, ZENG Z C, NG E, et al. Spatiotemporal Patterns of Street-Level Solar Radiation Estimated Using Google Street View in a High-Density Urban Environment[J]. Building and Environment, 2019, 148: 547-566.
|
| [24] |
SHEN Q M, ZENG W, YE Y, et al. StreetVizor: Visual Exploration of Human-Scale Urban Forms Based on Street Views[J]. IEEE Transactions on Visualization and Computer Graphics, 2018, 24 (1): 1004-1013.
|
| [25] |
CAO R, ZHU J S, TU W, et al. Integrating Aerial and Street View Images for Urban Land Use Classification[J]. Remote Sensing, 2018, 10 (10): 1553
|
| [26] |
LI X J, ZHANG C R, LI W D, et al. Assessing Street-Level Urban Greenery Using Google Street View and a Modified Green View Index[J]. Urban Forestry & Urban Greening, 2015, 14 (3): 675-685.
|
| [27] |
成实, 张冠亭, 张潇涵, 等. 基于LiDAR点云的景观空间“绿视率”量化分析方法研究[J]. 中国园林, 2022, 38 (2): 12-19.
CHENG S, ZHANG G T, ZHANG X H, et al. Research on the Quantitative Analysis Method of “Green Viewing Ratio” of Landscape Spatial Form Based on Three-Dimensional LiDAR Point Cloud Data[J]. Chinese Landscape Architecture, 2022, 38 (2): 12-19.
|
| [28] |
贺鹏, 易正晖, 王佳. 基于地面激光扫描点云数据测定树木三维绿量[J]. 测绘通报, 2013 (S2): 104-107.
HE P, YI Z H, WANG J. Measurement of Tridimensional Green Biomass of Trees Based on Terrestrial Laser Scanners[J]. Bulletin of Surveying and Mapping, 2013 (S2): 104-107.
|
| [29] |
李凤霞, 石辉, 撒利伟, 等. 微分法三维激光点云数据单木三维绿量测定研究[J]. 西安建筑科技大学学报(自然科学版), 2017, 49 (4): 530-535.
LI F X, SHI H, SA L W, et al. 3D Green Volume Measurement of Single Tree Using 3D Laser Point Cloud Data and Differential Method[J]. Journal of Xi’an University of Architecture & Technology (Natural Science Edition), 2017, 49 (4): 530-535.
|
| [30] |
苏志恒.基于绿视率、天空率和建筑率的道路景观信息适应性研究[D].西安: 长安大学, 2024.
SU Z H. Research on Adaptability of Road Landscape Information Based on Green View Index, Sky View Index and Building View Index[D]. Xi’an: Chang’an University, 2024.
|
| [31] |
何云玲, 白振洋, 张林艳. 城市生态环境绿色度量值的分析研究: 以昆明城区道路植物为例[J]. 安徽农业科学, 2013, 41 (2): 686-689.
HE Y L, BAI Z Y, ZHANG L Y. Research on the Related Indicators of Green Quantity of Urban Eco-environment[J]. Journal of Anhui Agricultural Sciences, 2013, 41 (2): 686-689.
|
| [32] |
周垠, 龙瀛. 街道步行指数的大规模评价: 方法改进及其成都应用[J]. 上海城市规划, 2017 (3): 88-93.
ZHOU Y, LONG Y. Large-Scale Evaluation for Street Walkability: Methodological Improvements and the Empirical Application in Chengdu[J]. Shanghai Urban Planning Review, 2017 (3): 88-93.
|
| [33] |
李杰.城市休闲空间绿视率及其景观评价[D].上海: 上海师范大学, 2017.
LI J. Evaluation of Green Appearance Percentage in Recreational Open Space[D]. Shanghai: Shanghai Normal University, 2017.
|
| [34] |
梁金洁.基于街景图像的北京市五环内绿视率分析研究[D].北京: 北京林业大学, 2019.
LIANG J J. Analysis of Green Vision Rate in Beijing Five Rings Based on Street View Image[D]. Beijing: Beijing Forestry University, 2019.
|
| [35] |
GOU A P, ZHANG C, WANG J B. Study on the Identification and Dynamics of Green Vision Rate in Jing’an District, Shanghai Based on Deeplab V3+ model[J]. Earth Science Informatics, 2022, 15 (1): 163-181.
|
| [36] |
KUMAKOSHI Y, CHAN S Y, KOIZUMI H, et al. Standardized Green View Index and Quantification of Different Metrics of Urban Green Vegetation[J]. Sustainability, 2020, 12 (18): 7434
|
| [37] |
王建强, 钟春惺, 江丽钧, 等. 基于多视航空影像的城市三维建模方法[J]. 测绘科学, 2014, 39 (3): 70-74.
WANG J Q, ZHONG C X, JIANG L J, et al. 3D City Modeling Construction Based on Multi-view Aerial Images[J]. Science of Surveying and Mapping, 2014, 39 (3): 70-74.
|
| [38] |
陈飞, 吴英男. 基于数字高程模型和遥感影像的三维可视化[J]. 测绘科学, 2009, 34 (S2): 127-129.
CHEN F, WU Y N. The 3D Visualization Based on Digital Elevation and Remote Sensing Image[J]. Science of Surveying and Mapping, 2009, 34 (S2): 127-129.
|
| [39] |
彭培胜, 王懿祥, 吴建强, 等. 基于无人机遥感影像的三维森林景观可视化[J]. 东北林业大学学报, 2013, 41 (6): 61-65.
PENG P S, WANG Y X, WU J Q, et al. Three-Dimensional Visualization of Forest Landscape Based on UAV Remote Sensing Images[J]. Journal of Northeast Forestry University, 2013, 41 (6): 61-65.
|
| [40] |
WANG D J, JIANG Q M, LIU J Z. Deep-Learning-Based Automated Building Information Modeling Reconstruction Using Orthophotos with Digital Surface Models[J]. Buildings, 2024, 14 (3): 808
|
| [41] |
肖希, 韦怡凯, 李敏. 日本城市绿视率计量方法与评价应用[J]. 国际城市规划, 2018, 33 (2): 98-103.
XIAO X, WEI Y K, LI M. The Method of Measurement and Applications of Visible Green Index in Japan[J]. Urban Planning International, 2018, 33 (2): 98-103.
|
| [42] |
中华人民共和国住房和城乡建设部办公厅.住房城乡建设部办公厅关于国家标准《绿色建筑评价标准》公开征求意见的通知[EB/OL].(2018-9-21)[2023-10-20].https://www.mohurd.gov.cn/gongkai/fdzdgknr/zqyj/201809/20180921_237690.html.
Ministry of Housing and Urban-Rural Development of the People’s Republic of China. Notice on soliciting public comments for the national standard Assessment Standard for Green Building[EB/OL]. (2018-09-21) [2023-10-20]. https://www.mohurd.gov.cn/gongkai/fdzdgknr/zqyj/201809/20180921_237690.html.
|
| [43] |
緑視率調査ガイドライン平成25年8月大阪府[EB/OL].[2023-08-06]. http://www.pref.osaka.lg.jp/attach/17426/00000000/guideline.pdf.
Guidelines for the Investigation of the Visibility Index of Osaka in August, 2005[EB/OL]. [2023-08-06]. http://www.pref.osaka.lg.jp/attach/17426/00000000/guideline.pdf.
|
| [44] |
陈柯辰. 1961—2012年杭州的升温趋势和四季分配之变化[J]. 中国农学通报, 2013, 29 (35): 345-350.
CHEN K C. Warming Trend and Seasonal Variation in Hangzhou from 1961 to 2012[J]. Chinese Agricultural Science Bulletin, 2013, 29 (35): 345-350.
|
| [45] |
彭锐, 刘海霞. 城市道路绿视率自动化计算方法研究[J]. 北京规划建设, 2018, 32 (4): 61-64.
PENG R, LIU H X. Research on Automated Calculation Method of Green View Index for Urban Roads[J]. Beijing Planning Review, 2018, 32 (4): 61-64.
|
| [46] |
查特吉, 哈迪.例解回归分析[M].郑忠国, 许静, 译.北京: 机械工业出版社, 2013.
CHATTERJEE S, HADI A S. Regression Analysis by Example[M]. ZHENG Z G, XU J, translated. Beijing: China Machine Press, 2013.
|
/
| 〈 |
|
〉 |