
盐城市生态产品价值视角下的湿地“占补平衡”
|
柳絮飞(1992—),男,甘肃省兰州人,硕士,工程师,从事生态保护与生物多样性研究。E-mail: 1414563343@qq.com |
收稿日期: 2024-07-08
修回日期: 2024-10-22
网络出版日期: 2026-03-12
版权
Wetland requisition-compensation balance based on ecological product value accounting in Yancheng
Received date: 2024-07-08
Revised date: 2024-10-22
Online published: 2026-03-12
Copyright
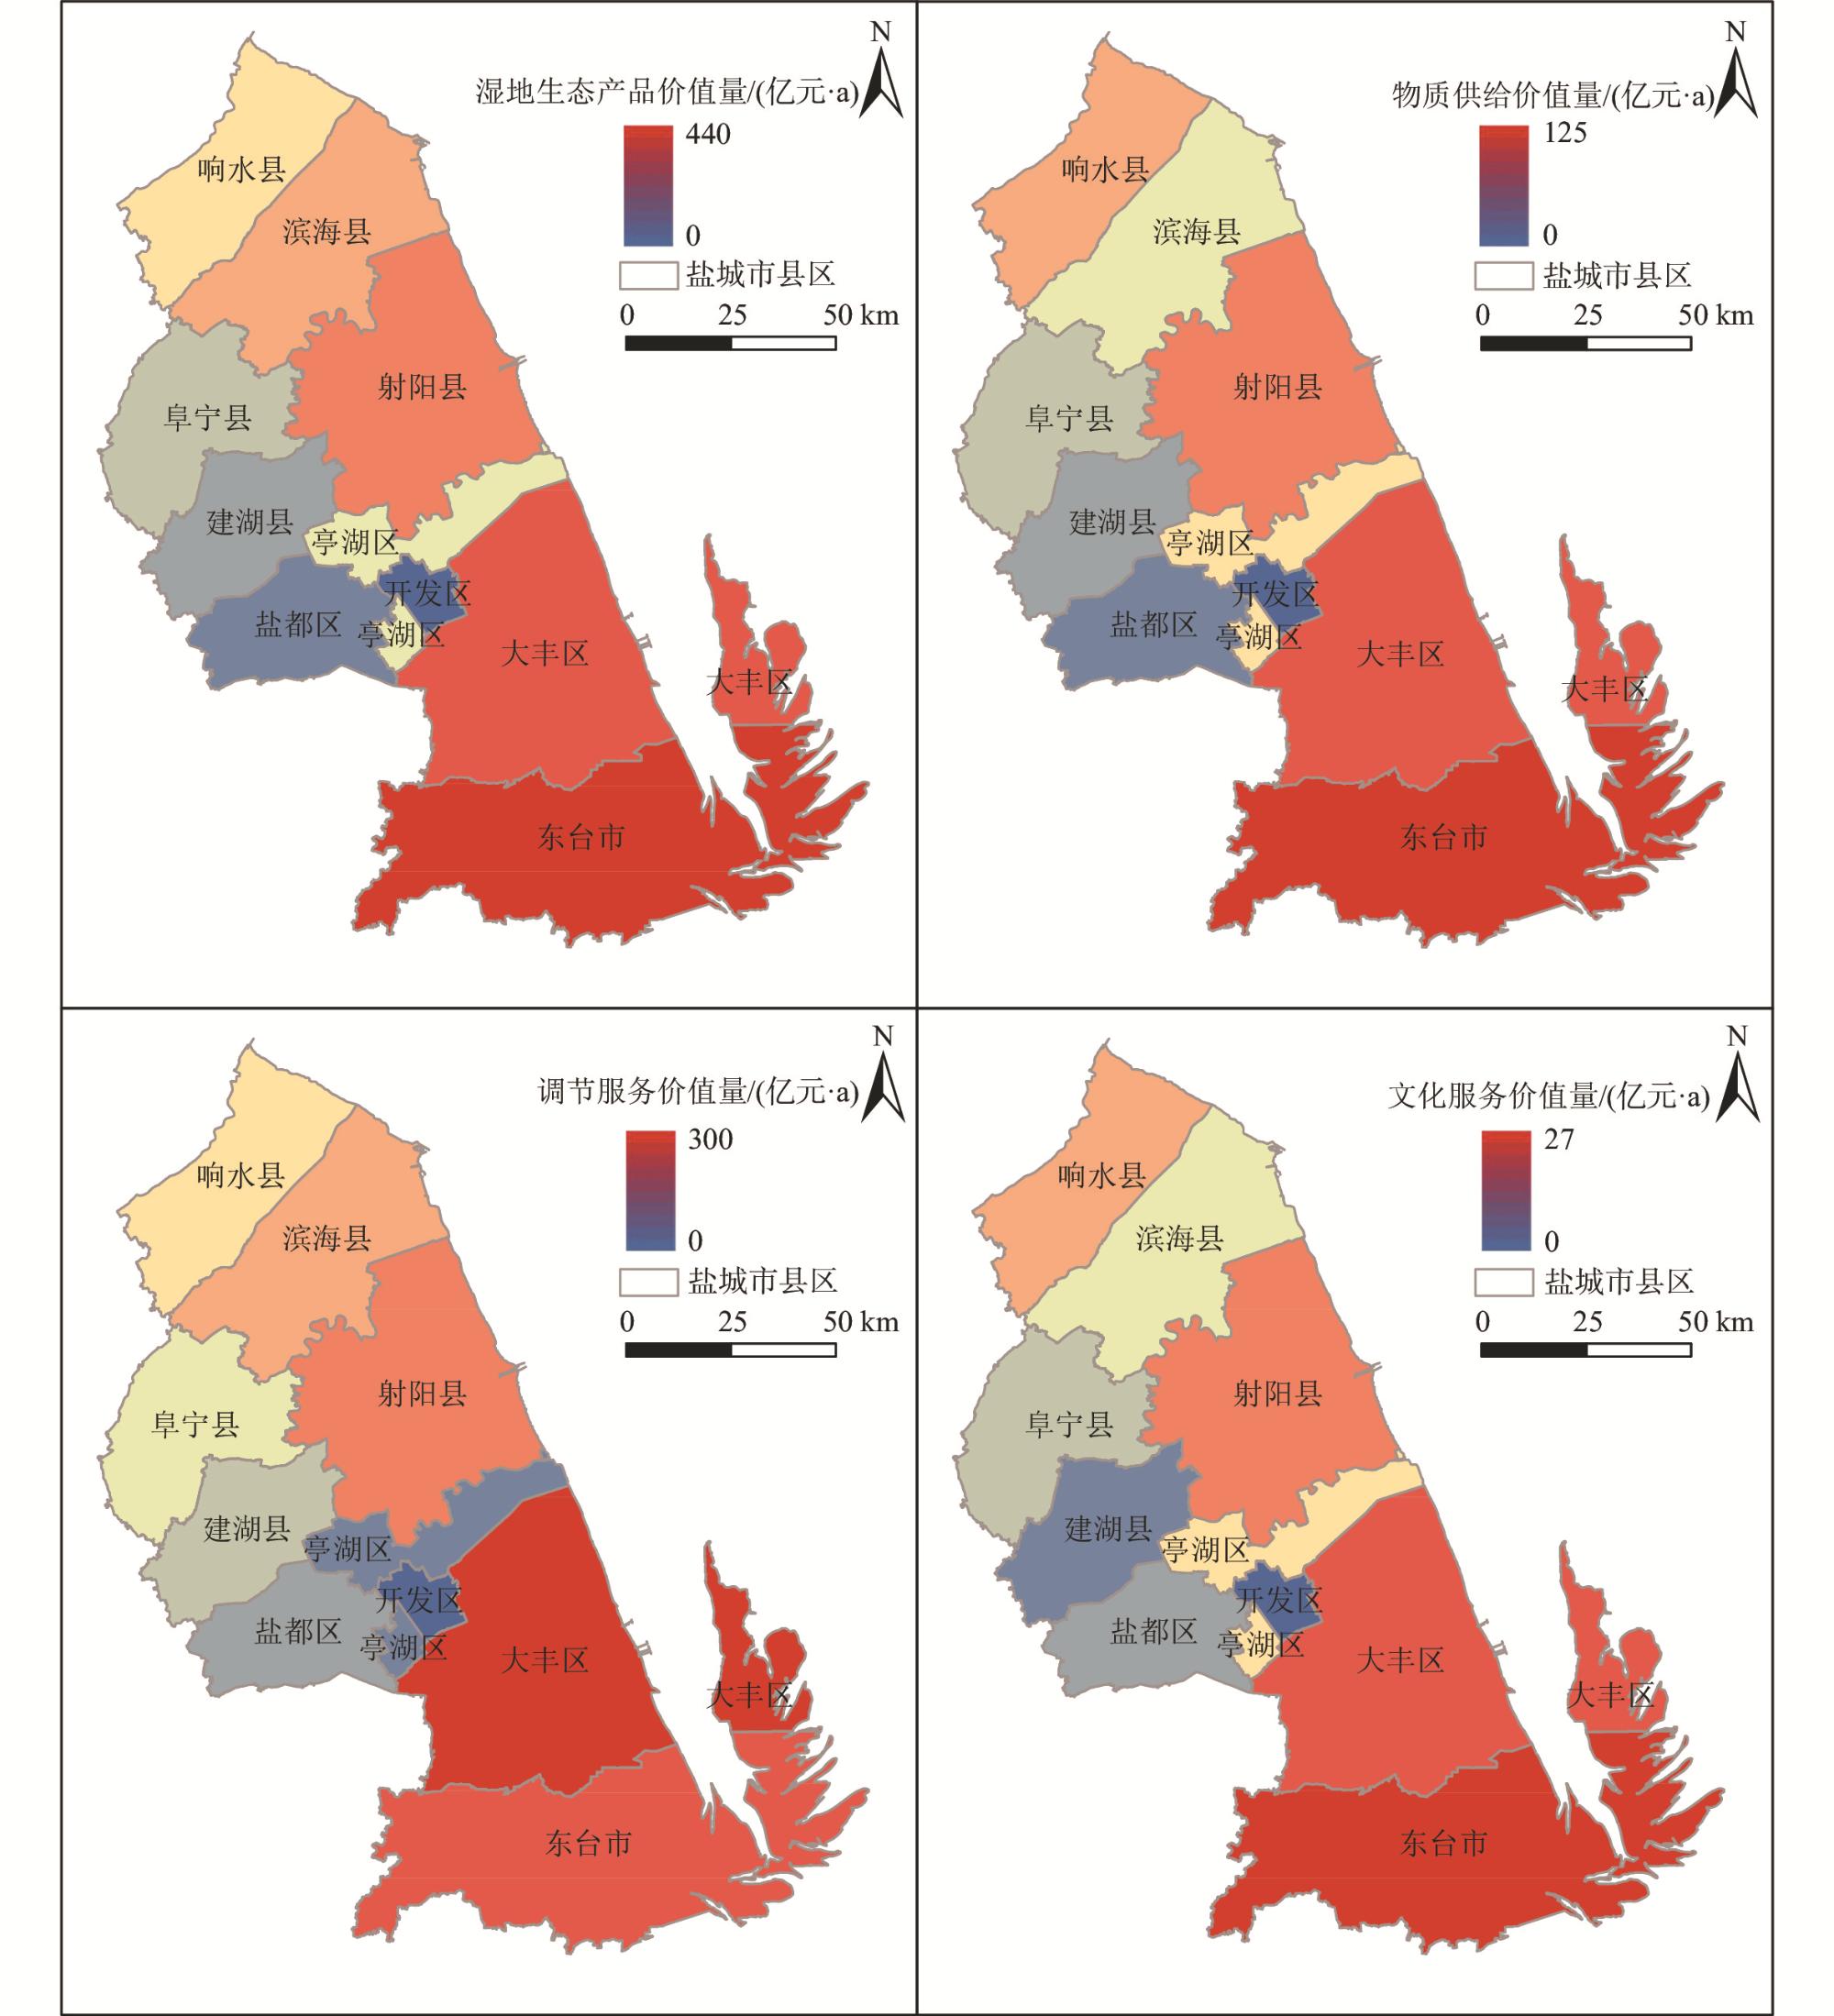
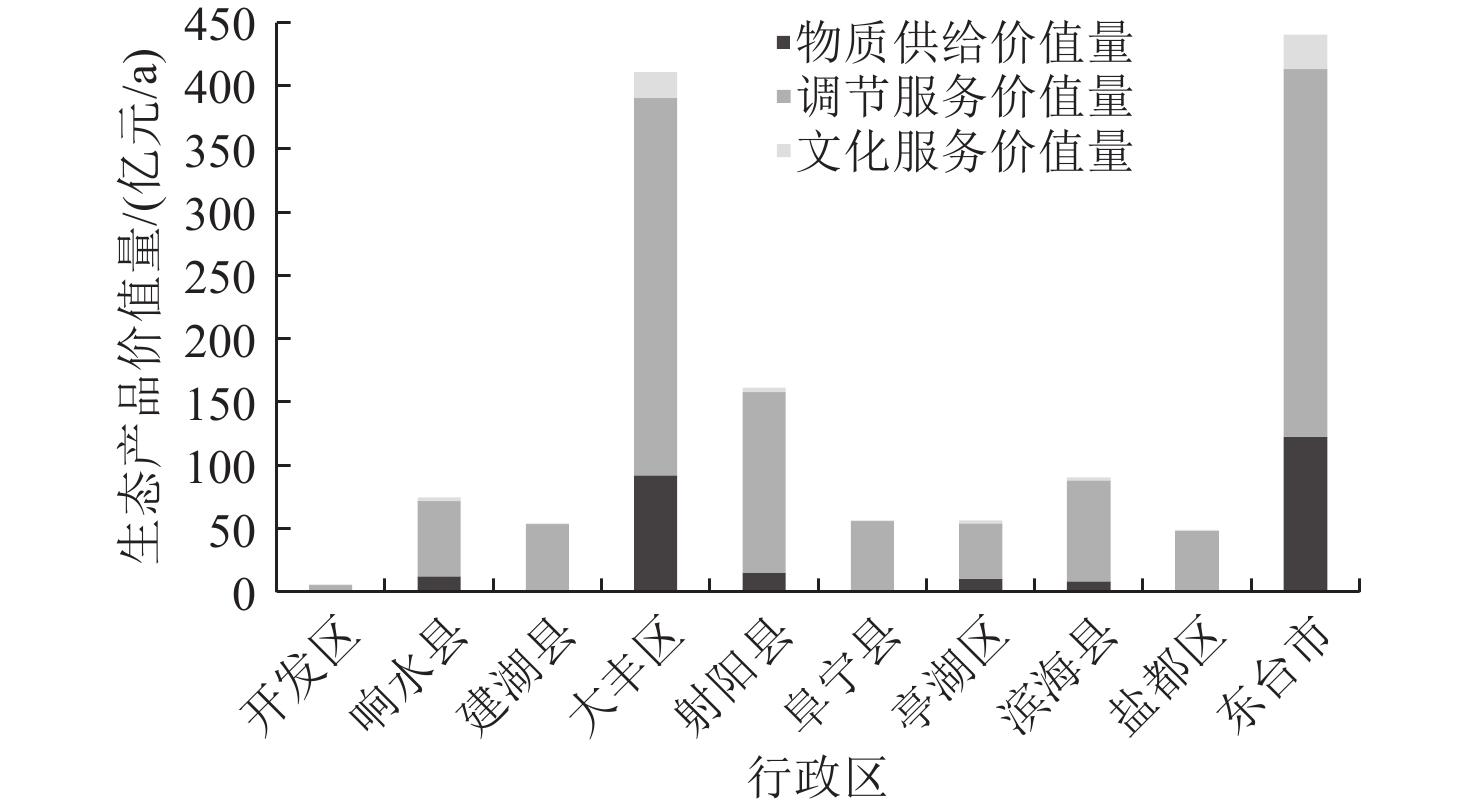
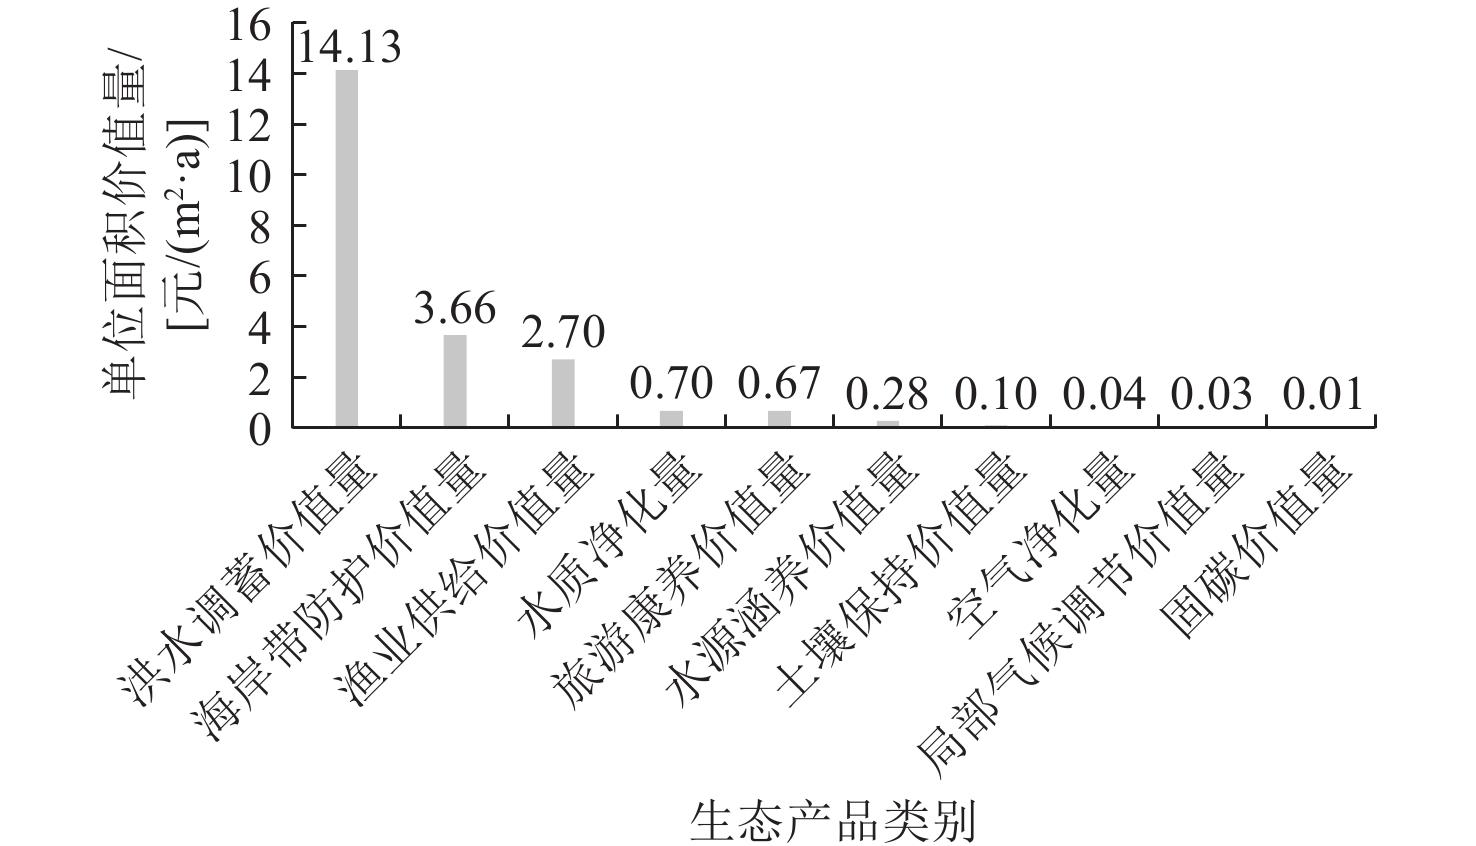
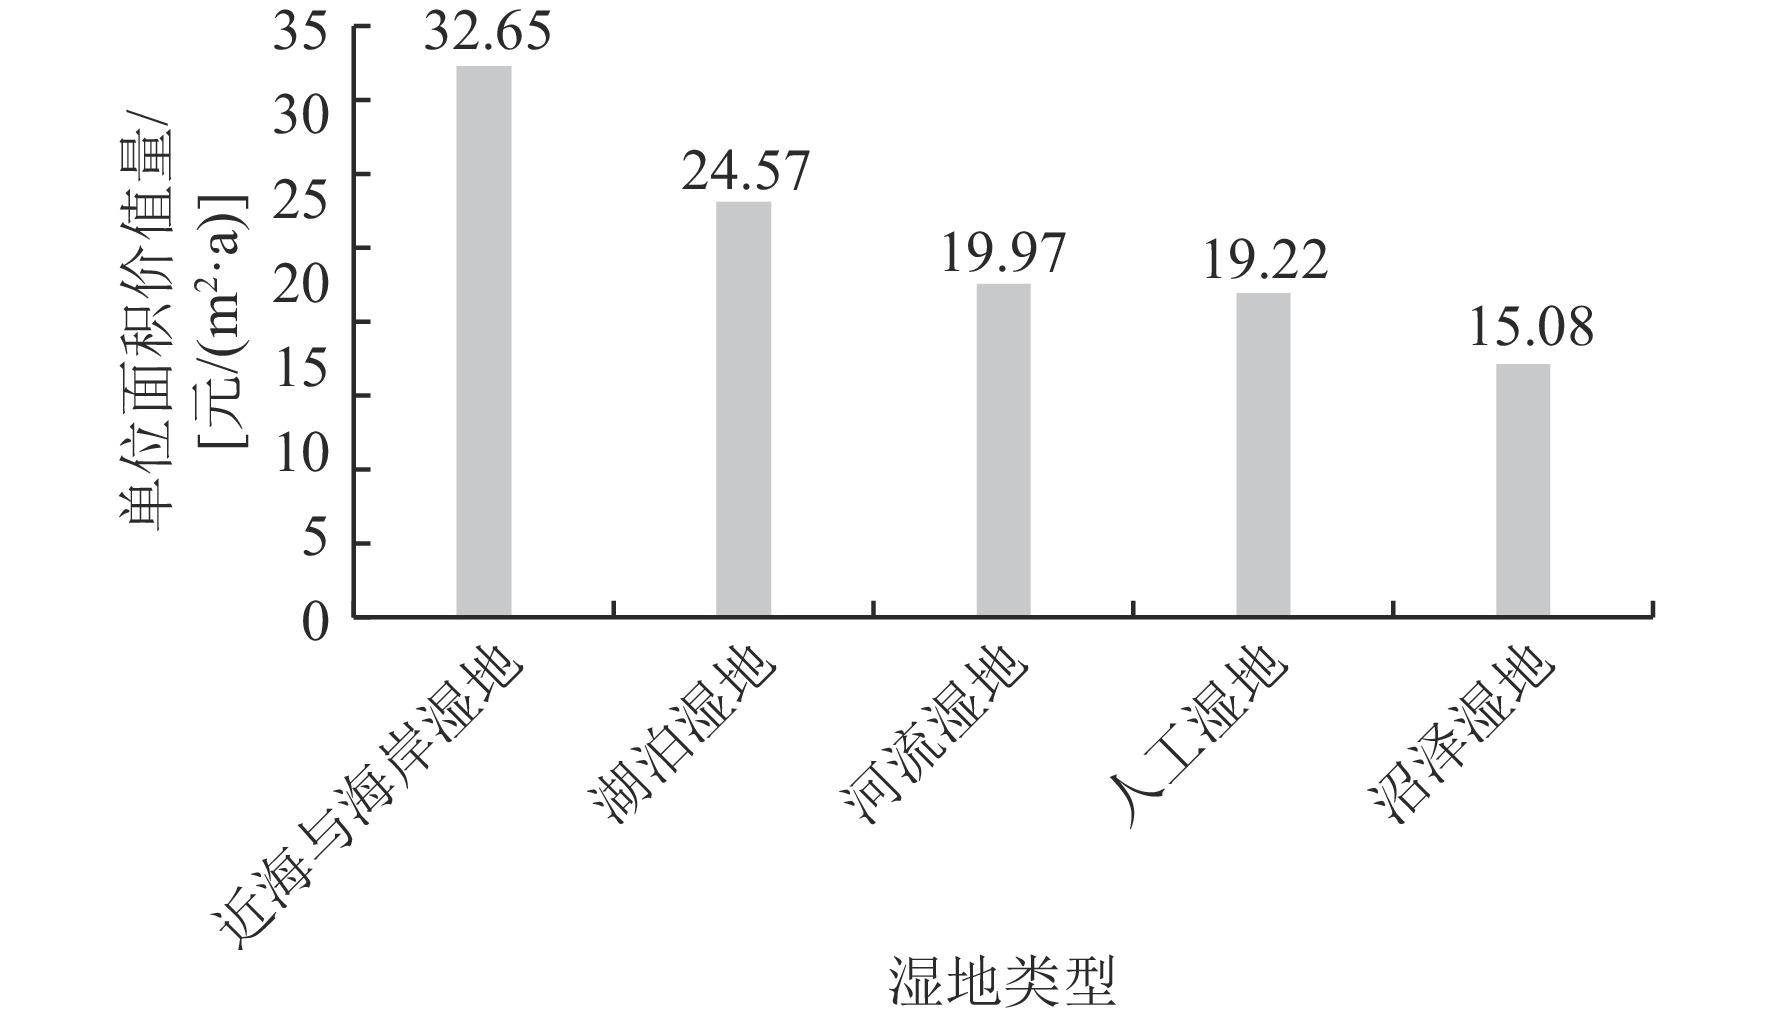
为了探究现行湿地“占补平衡”政策以及该政策对区域范围内湿地生态功能的生态盈亏作用,通过生态产品价值核算方法,对2022年盐城市不同类型湿地单位面积内湿地生态产品价值量进行核算评估。研究结果表明,盐城市近海与海岸湿地、沼泽湿地、河流湿地、湖泊湿地、人工湿地5种湿地类型的总面积为5 678.36 km2;2022年盐城市湿地生态产品价值量为1 400.94亿元,其中物质供给类生态产品价值为266.32亿元,调节服务类生态产品价值为1 075.76亿元,文化服务类生态产品价值为58.86亿元;盐城市单位面积内湿地生态产品价值量平均值为22.30元/(m2·a),不同类型湿地生态产品价值量从大到小依次为近海与海岸湿地[32.65 元/(m2·a)]、湖泊湿地[24.57 元/(m2·a)]、河流湿地[19.97 元/(m2·a)]、人工湿地[19.22 元/(m2·a)]、沼泽湿地[15.08 元/(m2·a)],并以洪水调蓄生态产品价值量最高[14.13 元/(m2·a)],固碳生态产品价值量最低[0.01 元/(m2·a)],其中近海与海岸湿地具有独特的海岸带防护价值。不同湿地类型具有不同的生态产品价值量和功能,建议在不同湿地类型之间开展“占补平衡”工作时,可将近海与海岸湿地、湖泊湿地、河流湿地、人工湿地、沼泽湿地的面积比,设定为1.00∶1.33∶1.63∶1.70∶2.17,进行占补面积的简易等效换算,从而实现区域生态产品价值的零净损失。
柳絮飞 , 曹海琳 , 吕忠海 , 芦昱 , 徐蕊 , 朱晓东 . 盐城市生态产品价值视角下的湿地“占补平衡”[J]. 湿地科学, 2026 , 24(1) : 199 -211 . DOI: 10.13248/j.cnki.wetlandsci.20240185
The wetland requisition-compensation balance policy, an important ecological conservation strategy in China, mandates equivalent-area compensation for development-occupied wetlands to maintain regional wetland inventory. However, widespread functional heterogeneity exists among wetland types. Since China formally institutionalized the concept of ecological products in 2006, scholarly focus has shifted toward quantifying wetland ecological product values encompassing provisioning services, regulating services, and cultural services to comprehensively reflect intrinsic wetland functions. In order to investigate the effects of current wetland requisition-compensation balance policy on ecological profit and loss of regional wetland functions, this study calculated and evaluated the values of wetland ecological product in Yancheng in 2022 based on gross ecosystem product (GEP) accounting model. The results demonstrated that the wetland in Yancheng was classified into 5 types, including coastal wetland, marshy wetland, riverine wetland, lacustrine wetland, and human-made wetland, of which the total area was 5 678.36 km2. The total value of wetland ecological product in Yancheng reached 140.094 billion yuan, comprising provisioning services (26.632 billion yuan), regulating services (107.576 billion yuan), cultural services (5.886 billion yuan). The mean value of unit-area wetland ecological products averaged 22.30 yuan/(m2·a). In terms of different types of wetland, their values from high to low were: coastal wetland [32.65 yuan/(m2·a)], lacustrine wetland [24.57 yuan/(m2·a)], riverine wetland [19.97 yuan/(m2·a)], human-made wetland [19.22 yuan/(m2·a)], and marshy wetland [15.08 yuan/(m2·a). Different wetland types exhibit divergent functional orientations and ecological function values. Coastal wetland provided unique coastal protection [3.66 yuan/(m2·a)]. As to different types of wetland ecological function, value for flood regulation was highest [14.13 yuan/(m2·a)], while value for carbon sequestration was lowest [0.01 yuan/(m2·a)]. Functional equivalence analysis reveals that uniform ecological value can be achieved when the area ratios of coastal wetland: lacustrine wetland: riverine wetland: human-made wetland reach 1.00:1.33:1.63:1.70:2.17. Consequently, it is suggested that when implementing the requisition-compensation balance mechanism across different wetland types, the equivalent value conversion from requisitioned area to ecological compensation can be calculated based on the unit-area wetland ecological product value. This approach can ensure zero net loss of regional ecological product value.
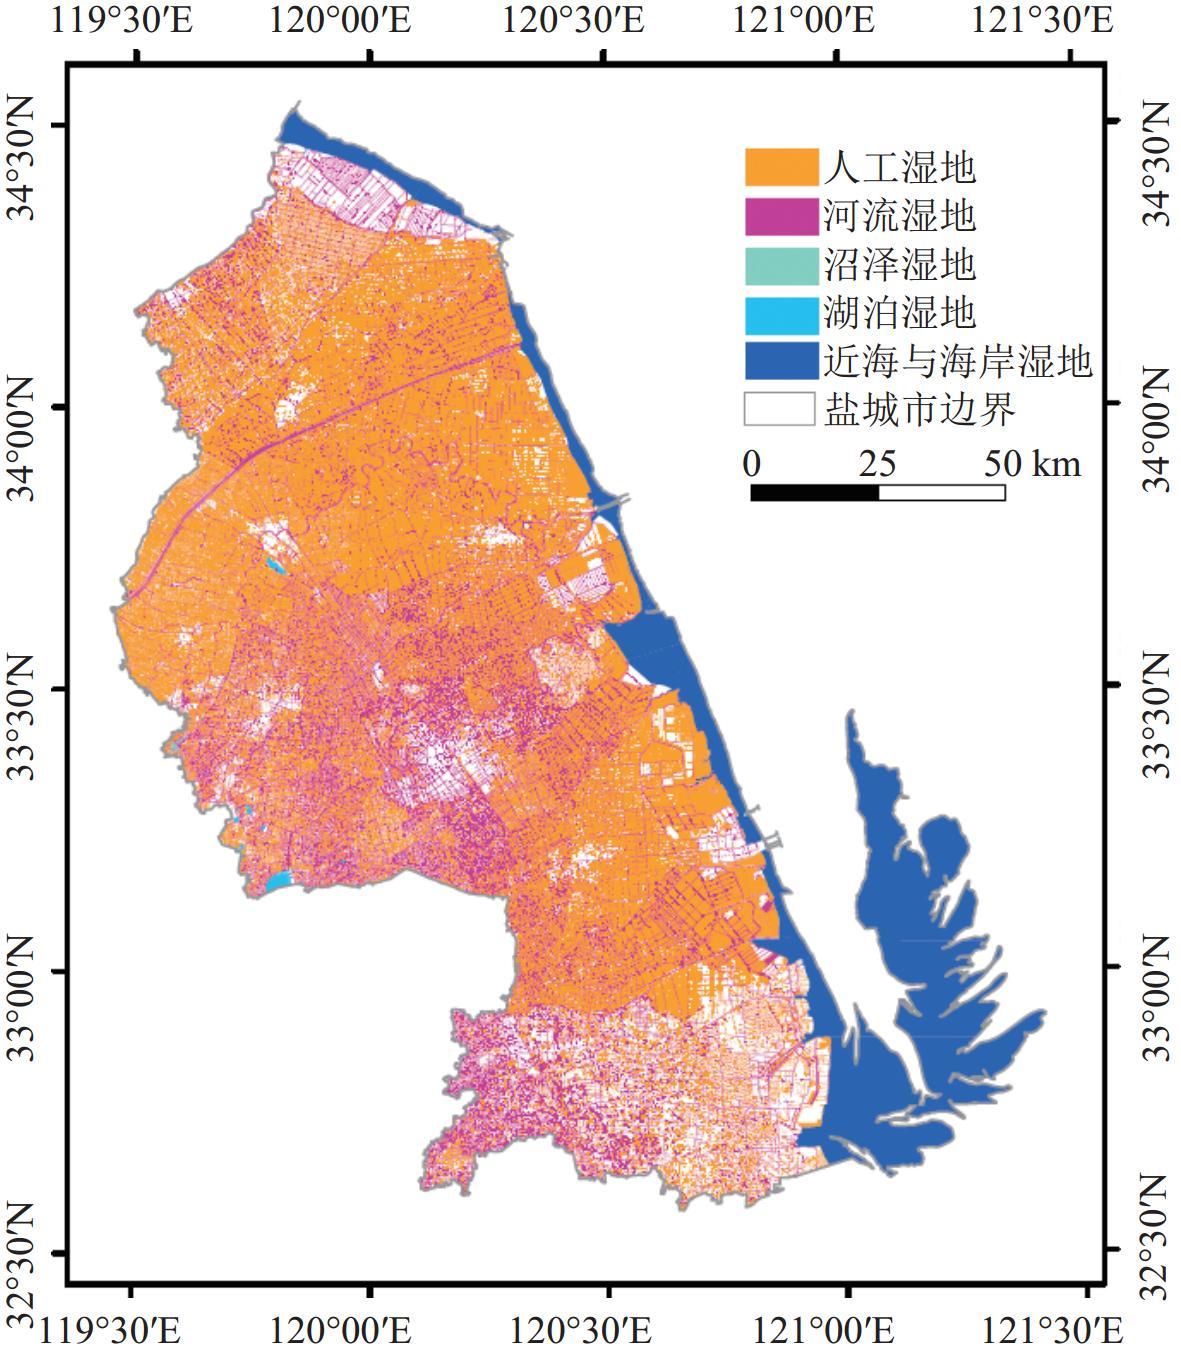
1 Eight wetland categories, corresponding wetland types and areas in Yancheng City盐城市8种湿地地类和对应的湿地类型及其面积 |
| 序号 | 湿地地类 | 面积/km2 | 湿地大类 | 湿地类型 | 面积/km2 | |
| 注:数据源于“盐城市第三次全市土地调查”① | ||||||
| 1 | 沿海滩涂 | 2 237.71 | 滨海湿地 | 近海与海岸湿地 | 2 237.71 | |
| 2 | 沼泽地 | 3.89 | 淡水湿地 | 沼泽湿地 | 3.89 | |
| 3 | 河流 | 1 066.53 | 河流湿地 | 1 085.53 | ||
| 4 | 内陆滩涂 | 19.00 | ||||
| 5 | 湖泊 | 19.86 | 湖泊湿地 | 19.86 | ||
| 6 | 水库 | 2.70 | 人工湿地 | 2 331.37 | ||
| 7 | 坑塘 | 1 279.63 | ||||
| 8 | 沟渠 | 1 049.05 | ||||
| 总计 | 5 678.36 | |||||
2 Data sources for accounting indicators of ecological product生态产品各核算指标统计数据来源 |
3 Reference values for accounting indicators of ecological product生态产品各核算指标数据参考值 |
| 生态产品 类别 | 指标 | 近海与海岸 湿地 | 沼泽 湿地 | 河流 湿地 | 湖泊 湿地 | 人工 湿地 |
| 注:“−”表示该湿地类型下核算对应生态产品指标核算无需该参数;土壤可蚀性因子、坡长因子、坡度因子、植被覆盖因子的参考值来源于“地理遥感生态网科学数据注册与出版系统(www.gisrs.cn)”,引用时间为2024年。 | ||||||
| 渔业物质供给 | 渔业密度/(g/m2) | 55.735 0[21] | 25.608 2[21-22] | 36.432 5[22] | 60.225 0[25-26] | 25.608 2 [25-26] |
| 底栖生物密度/(g/m2) | 276.880 0[22] | 0.525 0[22-23] | 140.695 0[24] | 50.400 0[25-26] | 0.525 0[25-26] | |
| 海水鱼类均价/(元/kg) | 39.800 0[27-29] | |||||
| 淡水鱼类均价/(元/kg) | 15.000 0[27-29] | |||||
| 海水底栖动物均价/(元/kg) | 33.000 0[27-29] | |||||
| 淡水底栖动物均价/(元/kg) | 4.000 0[27-29] | |||||
| 水源涵养 | 降水量/(mm/a) | 829.760 0[28] | 704.530 0[28] | 771.755 0[28] | 719.230 0[28] | 781.516 7[28] |
| 地表径流量/(mm/a) | 107.000 0[27-29] | 47.450 0[27-29] | 78.420 0[27-29] | 42.140 0[27-29] | 80.703 3[27-29] | |
| 蒸散发量/(mm/a) | 713.480 0[27-29] | 650.740 0[27-29] | 688.100 0[27-29] | 668.870 0[27-29] | 683.043 3[27-29] | |
| 土壤保持 | 降水侵蚀力因子/[MJ·mm/(hm2·h·a)] | 3 714.990 0[30] | 2 738.770 0[30] | 2 780.990 0[30] | 2 804.760 0[30] | 3 206.830 0[30] |
| 土壤可蚀性因子/[t·hm2·h/(hm2·MJ·mm)] | 0.010 0 | 0.010 0 | 0.010 0 | 0.010 0 | 0.010 0 | |
| 坡长因子 | 1.150 0 | 1.140 0 | 1.145 0 | 1.160 0 | 1.146 7 | |
| 坡度因子 | 0.460 0 | 0.390 0 | 0.460 0 | 0.670 0 | 0.503 3 | |
| 植被覆盖因子 | 0.150 0 | 0.390 0 | 0.335 0 | 0.050 0 | 0.293 3 | |
| 海岸带防护 | 海浪防护工程单位长度年维护成本/(万元/(km·a)) | 2.750 0[27] | − | − | − | − |
| 海浪防护工程单位长度建设成本/(万元/km) | 1 568.930 0[27] | − | − | − | − | |
| 海浪防护工程年折旧率 | 0.012 5[31] | − | − | − | − | |
| 洪水调蓄 | 沼泽土壤蓄水量/(m3/m2·年) | 0.110 8[27-28] | ||||
| 土壤蓄水深度/(m/a) | 0.300 0[27-28] | |||||
| 土壤容重/(t/m3) | 1.253 0[27-28] | |||||
| 土壤含水率差值 | 0.294 8[27-28] | |||||
| 水库年折旧率 | 0.02[31] | |||||
| 空气净化 | SO2净化量/(t/km2·a) | − | 2.850 0[17] | 7.060 0[17] | 7.060 0[17] | 7.060 0[17] |
| NOx净化量/(t/km2·a) | − | 1.320 0[17] | 0.000 0[17] | 0.000 0[17] | 0.000 0[17] | |
| 粉尘净化量/(t/km2·a) | − | 6.730 0[17] | 10.080 0[17] | 10.080 0[17] | 10.080 0[17] | |
| 水质净化 | 氨氮/(t/km2·a) | 0.095 0[17,32-35] | 0.135 5[17,32-35] | 0.127 5[17,27-30] | 2 723.560 0[17,32-35] | 0.135 5[17,32-35] |
| 总磷/(t/km2·a) | 0.026 0[17,32-35] | 0.007 8[17,32-35] | 0.015 0[17,32-35] | 102.480 0[17,32-35] | 0.007 8[17,32-35] | |
| 固碳 | 固碳速率/[g/(m2·a)] | 235.620 0[36-40] | 32.480 0[36-40] | 56.670 0[36-40] | 56.670 0[36-40] | 187.000 [36-40] |
| 二氧化碳价格/(元/t) | 55.300 0[41] | |||||
| 旅游康养 | 旅游人数/(人/m2) | 0.002 1[28] | 0.000 1[28] | 0.000 2[28] | 0.000 4[28] | 0.000 0[28] |
4 Area conversion ratios of compensation across wetland types under zero net loss policy零净损失下不同湿地类型间的占补面积比率 |
| 湿地类型 | 近海与海岸湿地 | 湖泊湿地 | 河流湿地 | 人工湿地 | 沼泽湿地 |
| 近海与海岸湿地 | 1.00 | 1.33 | 1.63 | 1.70 | 2.17 |
| 湖泊湿地 | 0.75 | 1.00 | 1.23 | 1.28 | 1.63 |
| 河流湿地 | 0.61 | 0.81 | 1.00 | 1.04 | 1.32 |
| 人工湿地 | 0.59 | 0.78 | 0.96 | 1.00 | 1.27 |
| 沼泽湿地 | 0.46 | 0.61 | 0.76 | 0.78 | 1.00 |
/
| 〈 |
|
〉 |