
收稿日期: 2024-12-09
修回日期: 2025-03-26
网络出版日期: 2026-03-12
版权
Damage caused by Chinese water deer (Hydropotes inermis) in Yancheng coastal wetlands and farmers’ willingness to protect them
Received date: 2024-12-09
Revised date: 2025-03-26
Online published: 2026-03-12
Copyright
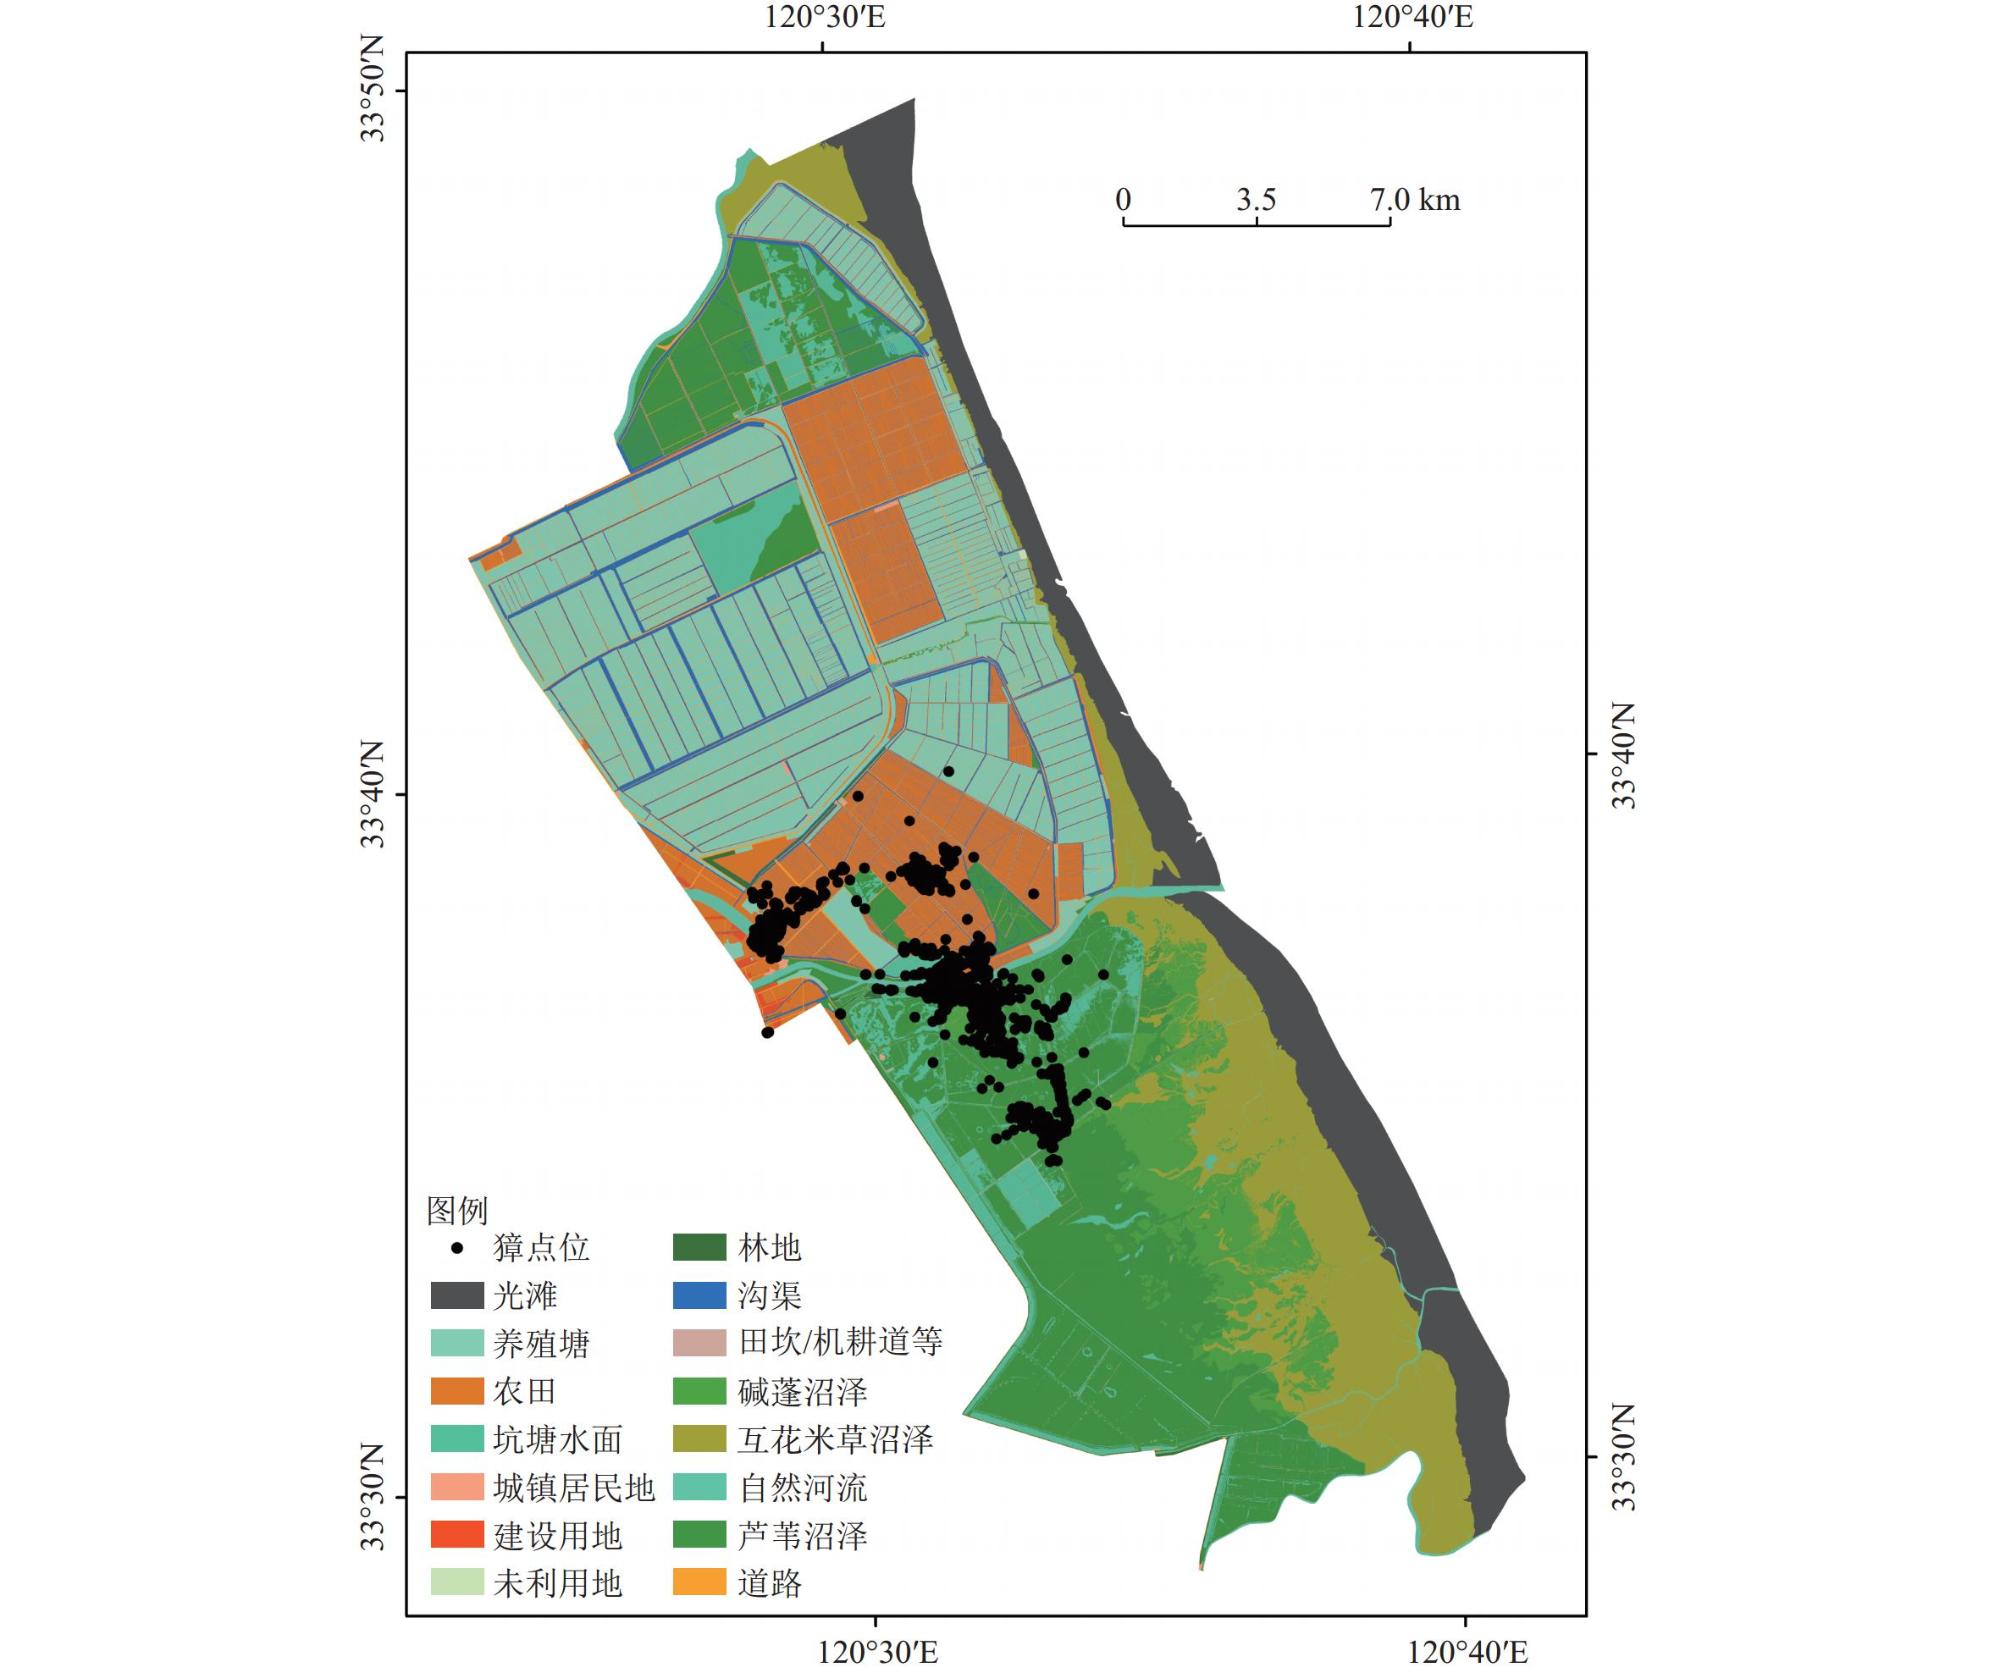
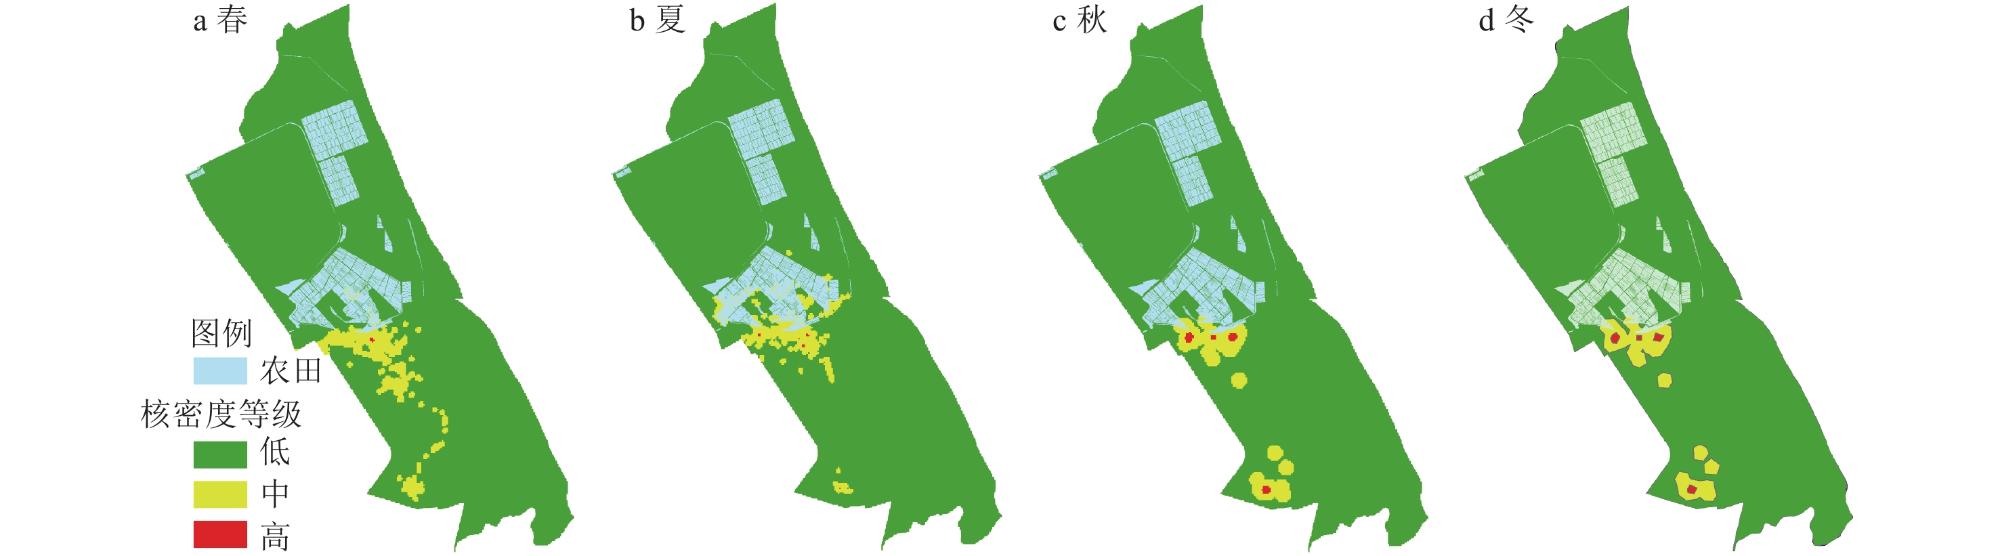
野生动物活动范围与人类生产生活空间会产生重叠,导致野生动物致害事件频发。以江苏盐城湿地珍禽国家级自然保护区中的獐(Hydropotes inermis)为例,利用记录到的獐GPS-GSM点位数据,基于核密度估计模型、主成分分析、Vanderloeg选择系数和Scavia选择指数,揭示獐栖息地选择的特征及其对农业生产的影响,分析獐栖息地选择致害损失与农户保护意愿之间的关联。研究结果表明,獐栖息地选择偏好芦苇(Phragmites australis)沼泽生境,偏好在农田和开放水面生境50 m范围内活动,远离道路和居民地。獐在不同季节均对农田表现出明显偏好,其中夏季最为典型,其在农田的分布面积为1 352.60 hm2,导致夏季水稻(Oryza sativa)直接经济损失3 960元/hm2,间接损失74 580元。獐在农田活动而造成损害,会极大削弱农户的保护意愿;当农户对獐的价值有着较高的认知水平时,对獐的保护意愿会显著增强。
王成 , 朱美玲 , 吴绪梅 , 孙公波 , 夏宇 , 申志恒 , 王彬 . 盐城滨海湿地獐致害损失与农户保护意愿[J]. 湿地科学, 2025 , 23(5) : 1087 -1098 . DOI: 10.13248/j.cnki.wetlandsci.20240327
The scope of wild animal activities overlaps significantly with human production and living spaces, which leads to frequent incidents of wildlife damage. Especially in communities and farmers near nature reserves, which are more affected by the invasion of wild animals. Therefore, to alleviate the contradiction between wildlife conservation and agricultural production, and to coordinate the relationship between wildlife conservation and agricultural production. This study took the Chinese water deer (Hydropotes inermis) in the Yancheng Wetland Rare Bird National Nature Reserve in Jiangsu Province as an example. Based on the small animal tracking device (model HQAN40-S) equipped with 20 adult deer released from April 3, 2020 to April 28, 2022, 33 001 valid deer activity GPS point data were obtained. This study used the recorded GPS-GSM point data of deer, based on Kernel Density Estimation model, Principal Component Analysis, Vanderloeg selectivity coefficient and Scavia selectivity index, to reveal the characteristics of deer habitat selection and its impact on agriculture, and analyze the correlation between the damage caused by deer habitat selection and farmers’ willingness to protect. The results showed that deer prefer reed (Phragmites australis) swamp habitats for their habitat selection. In autumn, deer preferred to operate in areas with vegetation coverage less than 40%. In summer, deer did not choose to operate in areas with vegetation heights of 1 m to 2 m, and in winter, deer did not choose to operate in areas with vegetation heights less than 1 m. In addition, deer preferred to move within 50 m of farmland and open water habitats, away from roads and residential areas. The deer showed a clear preference for farmland in different seasons. In spring and summer, they preferred to choose farmland in the northern buffer zone, with a distribution area of 1 352.60 hm2. This results in direct economic losses of 3 960 yuan/hm2 and indirect losses of 74 580 yuan for rice (Oryza sativa) in summer. The distribution area of deer in farmland was relatively small during autumn and winter seasons. The direct economic losses or production disturbances caused by deer activities in farmland had a significant negative impact on farmers’ willingness to protect, and would greatly weaken their willingness to protect. When farmers had a high level of awareness of the value of deer, their willingness to protect deer would significantly increase. Policy makers should attach importance to the effectiveness of compensation mechanisms and enhance public education as an effective way to increase participation in conservation, which could effectively enhance farmers’ willingness to protect and reduce economic losses caused by wildlife damage.
1 Measurement methods of ecological factors in Yancheng coastal wetland盐城滨海湿地生态因子测量方法 |
| 生态因子 | 处理方法 | 数据来源 | |
| 距离因子 | 距农田距离/m | 利用ArcGIS 10.4软件中的Euclidean distance模块进行空间分析获得 | 地理空间数据云 (https://www.gscloud.cn/) |
| 距水源距离/m | |||
| 距居民地距离/m | |||
| 距道路距离/m | |||
| 植被因子 | 植被高度/m | DEM(来源于ASTER GDEM v3版本,数据精度为30 m,为点位附近植被平均高度) | |
| 芦苇沼泽 | 结合2020年Landsat 8 OLI(空间分辨率30 m)高光谱和高分二号(空间分辨率2 m) 高分辨率遥感影像的优势,利用面向对象方法并辅助目视解译获得土地利用类型 | ||
| 碱蓬沼泽 | |||
| 植被覆盖率/% | 归一化植被指数(NDVI)利用ENVI 5.3软件进行波段计算获得 |
2 Descriptive statistics of variables related to the binary Logit model of farmers' willingness to protect deer盐城滨海湿地周边农户对獐保护意愿的二元Logit模型相关变量描述性统计 |
| 变量 | 变量名称 | 变量说明 | 平均值 | 标准差 |
| 被解释变量 | 是否愿意保护獐 | 是=1,否=0 | 0.59 | 0.49 |
| 解释变量 | 獐活动影响程度 | 没有影响=1,一般影响=2,很大影响=3 | 1.51 | 0.79 |
| 控制变量 | 年龄 | 实际年龄 | 51.50 | 7.70 |
| 文化程度 | 受教育年限(小学=1,初中=2,高中=3,大专及以上=4) | 1.81 | 0.99 | |
| 年收入 | 实际收入/(取对数) | 4.85 | 0.25 | |
| 主要种植的作物种类 | 水稻=1,小麦=2,瓜果蔬菜=3,其他=4 | 1.37 | 0.63 | |
| 种植农作物面积 | 农作物种植面积/hm2 | 15.70 | 22.67 | |
| 政策满意度 | 不满意=1,轻微满意=2,一般满意=3,比较满意=4,很满意=5 | 3.36 | 1.28 | |
| 獐价值认知水平 | 不了解=1,一般了解=2,很了解=3 | 2.03 | 0.81 |
3 Indices related to habitat selection of Chinese water deer in Yancheng coastal wetland盐城滨海湿地獐栖息地选择相关指数 |
| 生境因子 | 类别或等级 | 频次/次 | 频次占比/% | 样方占比/% | 选择系数Wi | 选择指数Ei |
| 植被类型 | 芦苇沼泽 | 18 214 | 83.56 | 21.08 | 4.00 | 0.60 |
| 碱蓬沼泽 | 2 061 | 9.50 | 5.14 | 3.96 | 0.59 | |
| 距农田距离/m | 0~50 | 27 713 | 82.00 | 7.65 | 10.93 | 0.94 |
| >50~200 | 5 017 | 15.13 | 8.59 | 1.68 | 0.67 | |
| >200 | 931 | 2.87 | 83.76 | 0.03 | −0.81 | |
| 距水源距离/m | 0~50 | 29 871 | 88.14 | 4.17 | 22.25 | 0.97 |
| >50~200 | 3 516 | 8.42 | 1.83 | 5.00 | 0.87 | |
| >200 | 274 | 3.44 | 94.00 | 0.09 | −0.60 | |
| 距道路距离/m | 0~50 | 472 | 1.04 | 8.62 | 0.16 | −0.59 |
| >50~500 | 4 139 | 11.96 | 17.58 | 2.09 | −0.3 | |
| >500 | 29 050 | 87.00 | 73.80 | 1.17 | 0.38 | |
| 距居民地距离/m | 0~50 | 2 529 | 11.00 | 2.77 | 4.23 | 0.85 |
| >50~500 | 11 902 | 32.00 | 35.19 | 0.88 | 0.45 | |
| >500 | 19 230 | 57.00 | 62.04 | 0.93 | 0.29 | |
| 植被覆盖率/% | <20 | 248 | 1.40 | 27.22 | 0.03 | −0.84 |
| ≥20~40 | 9 425 | 27.36 | 28.49 | 1.00 | 0.50 | |
| >40 | 23 988 | 71.24 | 44.29 | 1.61 | 0.65 | |
| 植被高度/cm | ≤100 | 11 598 | 34.37 | 55.13 | 0.61 | 0.29 |
| >100~200 | 8 469 | 25.51 | 23.82 | 1.04 | 0.51 | |
| >200~300 | 13 594 | 40.12 | 21.05 | 1.90 | 0.70 |
4 Characteristic values and cumulative contribution rates of various ecological factors in the habitat of Chinese water deer in Yancheng Coastal Wetland盐城滨海湿地獐栖息地各生态因子特征值及累计贡献率 |
| 因子 | 初始特征值 | 贡献率/% |
| PC1 | 3.020 | 37.749 |
| PC2 | 1.727 | 21.589 |
| PC3 | 1.022 | 12.771 |
| PC4 | 0.688 | 8.600 |
| PC5 | 0.664 | 8.302 |
| PC6 | 0.466 | 5.823 |
| PC7 | 0.276 | 3.451 |
| PC8 | 0.137 | 1.715 |
5 Rotation factor load matrix of Chinese water deer habitat in Yancheng Coastal Wetland盐城滨海湿地獐栖息地旋转因子载荷矩阵表 |
| 指标 | 旋转后的成分矩阵 | ||
| PC1 | PC2 | PC3 | |
| 距农田距离 | 0.882 | −0.142 | 0.144 |
| 距水源距离 | 0.877 | −0.127 | 0.192 |
| 距居民地距离 | 0.738 | 0.062 | −0.342 |
| 植被高度 | 0.019 | −0.798 | 0.052 |
| 芦苇沼泽 | 0.075 | 0.787 | 0.154 |
| 碱蓬沼泽 | −0.305 | 0.702 | 0.154 |
| 距道路距离 | 0.540 | −0.596 | 0.098 |
| 植被覆盖率 | 0.085 | 0.137 | 0.937 |
6 Distribution area of Chinese water deer populations in farmlands of Yancheng Coastal Wetland in different seasons盐城滨海湿地不同季节獐种群在农田中的分布面积 |
| 季节 | 春季 | 夏季 | 秋季 | 冬季 |
| 面积/hm2 | 362.34 | 1 352.60 | 182.28 | 224.48 |
7 Total amount of indirect losses caused by the damage of Chinese water deer in Yancheng Coastal Wetland盐城滨海湿地獐损害间接损失总额 |
| 防范成本M1/元 | 额外劳动时间成本M2/元 | 总间接损失Y/元 |
| 39 510 | 35 000 | 74 510 |
8 Social and economic attributes of respondents involved in the protection of Chinese water deer in Yancheng coastal wetland盐城滨海湿地獐保护受访者社会经济属性 |
| 属性 | 性别 | 年龄 | 文化程度 | ||||||||
| 男 | 女 | <50 | ≥50~60 | >60 | 小学 | 初中 | 高中 | 大专及以上 | |||
| 比重/% | 58 | 42 | 38 | 47 | 15 | 30 | 40 | 25 | 5 | ||
| 属性 | 年收入/万元 | 种植面积/hm2 | |||||||||
| <10 | ≥10~20 | >20 | <0.67 | ≥0.67~3.33 | <3.33 | ||||||
| 比重/% | 62 | 26 | 12 | 53 | 22 | 25 | |||||
9 Farmers’ perceptions of impacts, cognition, policy awareness, and conservation attitudes of Chinese water deer activity农户视角下的獐活动影响、认知、政策了解与保护态度 |
| 獐活动对农业生产的影响程度及 损失比例 | 农户对獐的 认知程度/% | 农户对当地野生动物 保护政策的了解程度/% | 农户对野生动物的 保护态度/% | |||||
| 影响程度/% | 损失占比/% | |||||||
| 没有影响 | 67 | 13 | 不了解 | 31 | 非常熟悉 | 25 | 愿意参与保护 | 38 |
| 一般影响 | 15 | 1 | 一般了解 | 35 | 知道大多数内容 | 29 | 理解但参与度有限 | 40 |
| 很大影响 | 18 | 21 | 很了解 | 34 | 知道一些 | 15 | 不主动参与保护活动 | 22 |
| 不知道 | 31 | |||||||
10 Logit regression results of willingness of farmers to protect Chinese water deer in Yancheng coastal wetlands盐城滨海湿地獐农户保护意愿的Logit模型回归结果 |
| 变量 | 回归系数 | 标准误差 | 瓦尔德 | 自由度 | 显著性 | 优势比 |
| 注:*表示p<0.05,**表示p<0.01。 | ||||||
| 獐活动影响程度 | −3.063 | 0.943 | 11.788 | 1 | 0.001** | 0.047 |
| 年龄 | 0.011 | 0.059 | 0.037 | 1 | 0.847 | 1.012 |
| 文化程度 | 0.075 | 0.448 | 0.028 | 1 | 0.868 | 1.078 |
| 作物种类 | −0.705 | 0.643 | 1.202 | 1 | 0.273 | 0.494 |
| 作物面积 | −1.047 | 0.628 | 2.780 | 1 | 0.095 | 0.351 |
| 政策满意度 | 1.040 | 0.385 | 7.318 | 1 | 0.007** | 2.830 |
| 对獐价值认知水平 | 1.232 | 0.592 | 4.327 | 1 | 0.038* | 3.331 |
| 年收入 | 0.067 | 0.737 | 0.008 | 1 | 0.927 | 1.070 |
| 常量 | −0.673 | 3.805 | 0.031 | 1 | 0.86 | 0.51 |
11 Robustness test of the impact of Chinese water deer activities in Yancheng coastal wetland盐城滨海湿地獐活动影响的稳健性检验 |
| 变量 | 回归系数 | 标准误差 | 瓦尔德 | 自由度 | 显著性 | 优势比 |
| 注:*表示p<0.05,**表示p<0.01。 | ||||||
| 獐活动影响程度 | −3.573 | 1.120 | 10.177 | 1 | 0.001** | 0.028 |
| 年龄 | 0.006 | 0.065 | 0.010 | 1 | 0.921 | 1.007 |
| 文化程度 | 0.115 | 0.466 | 0.060 | 1 | 0.806 | 1.121 |
| 主要种植的作物种类 | −0.877 | 0.740 | 1.404 | 1 | 0.236 | 0.416 |
| 面积 | −0.950 | 0.763 | 1.550 | 1 | 0.213 | 0.393 |
| 年收入 | 0.111 | 0.862 | 0.016 | 1 | 0.898 | 1.112 |
| 性别 | 0.038 | 0.830 | 0.002 | 1 | 0.963 | 1.039 |
| 对政策的满意度 | 0.083 | 0.674 | 2.582 | 1 | 0.108 | 2.952 |
| 对獐价值的认知水平 | 1.066 | 0.426 | 6.261 | 1 | 0.012* | 2.902 |
| 农作物市场价格 | 2.335 | 1.078 | 4.690 | 1 | 0.030* | 10.332 |
| 常量 | −2.854 | 4.508 | 0.401 | 1 | 0.527 | 0.058 |
/
| 〈 |
|
〉 |