
湿地水文连通的定量评估和影响因素分析
|
穆家徐(1999—),男,江苏省连云港人,硕士研究生,从事湿地水文连通方面的研究。E-mail: mujiaxu1999@163.com |
收稿日期: 2024-07-03
修回日期: 2024-07-31
网络出版日期: 2026-03-12
版权
Quantitative assessment of wetland hydrological connectivity and analysis of driving factors: a case study of the Naoli River Basin
Received date: 2024-07-03
Revised date: 2024-07-31
Online published: 2026-03-12
Copyright
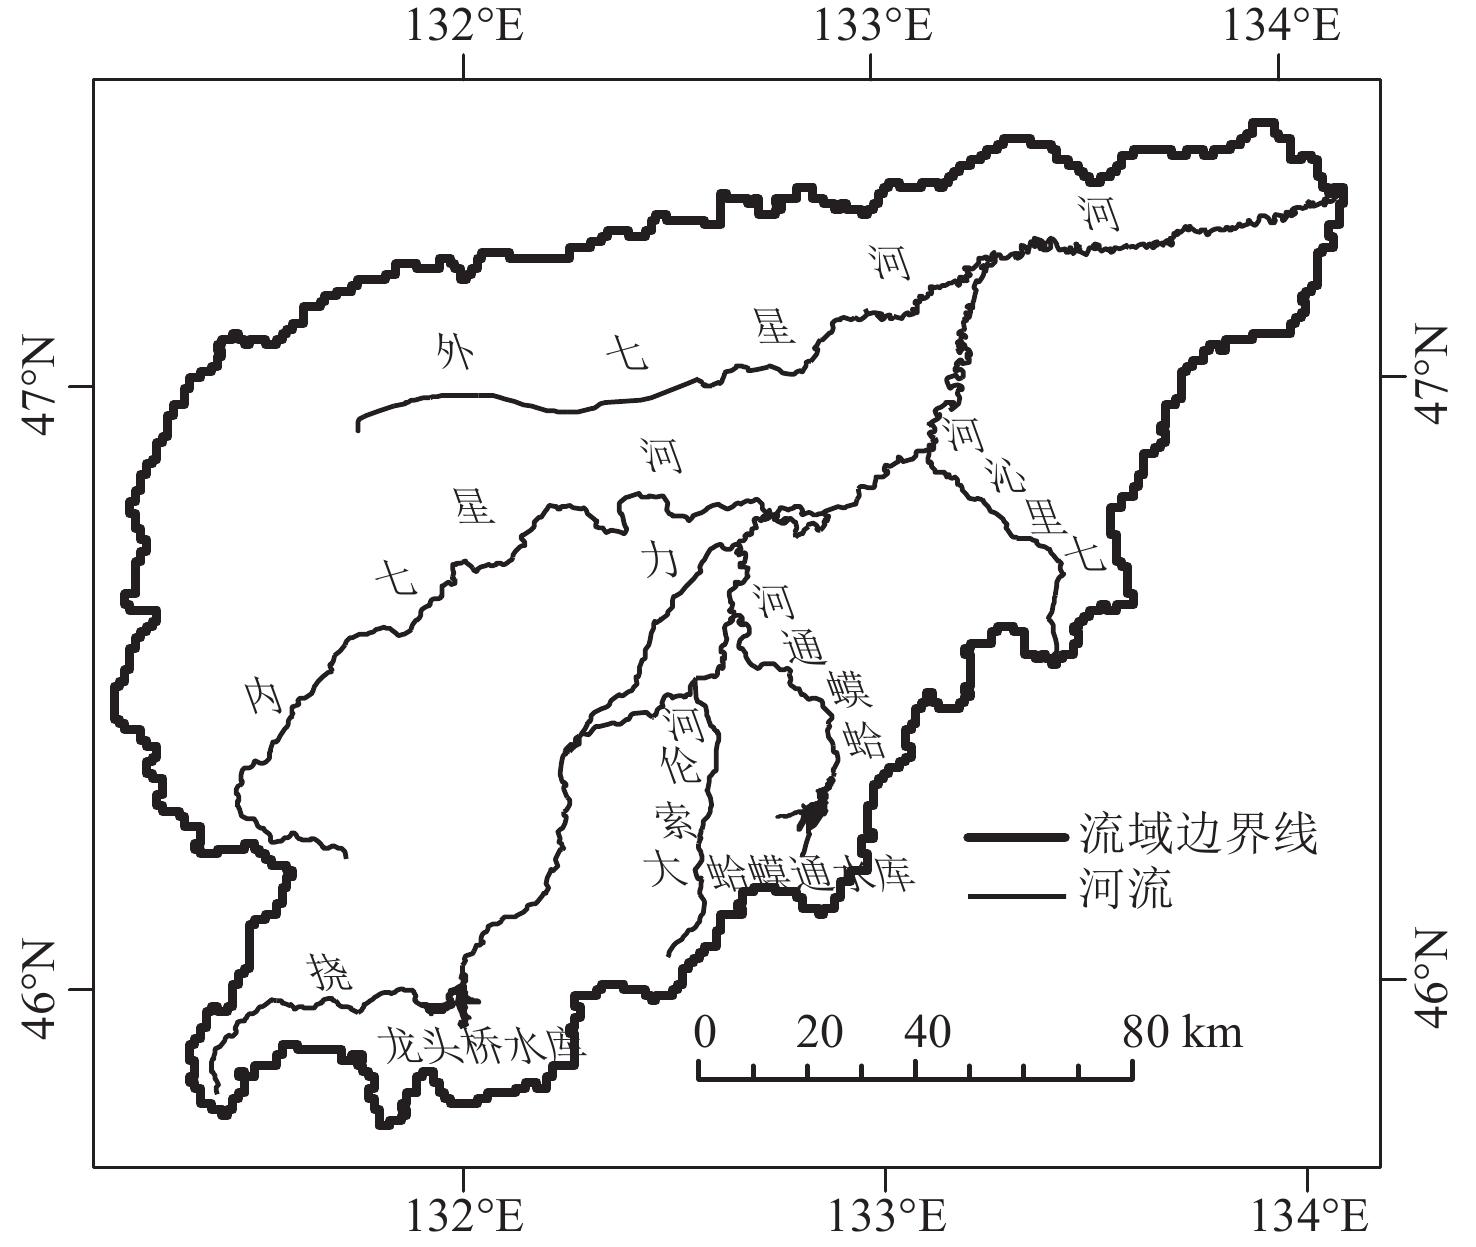
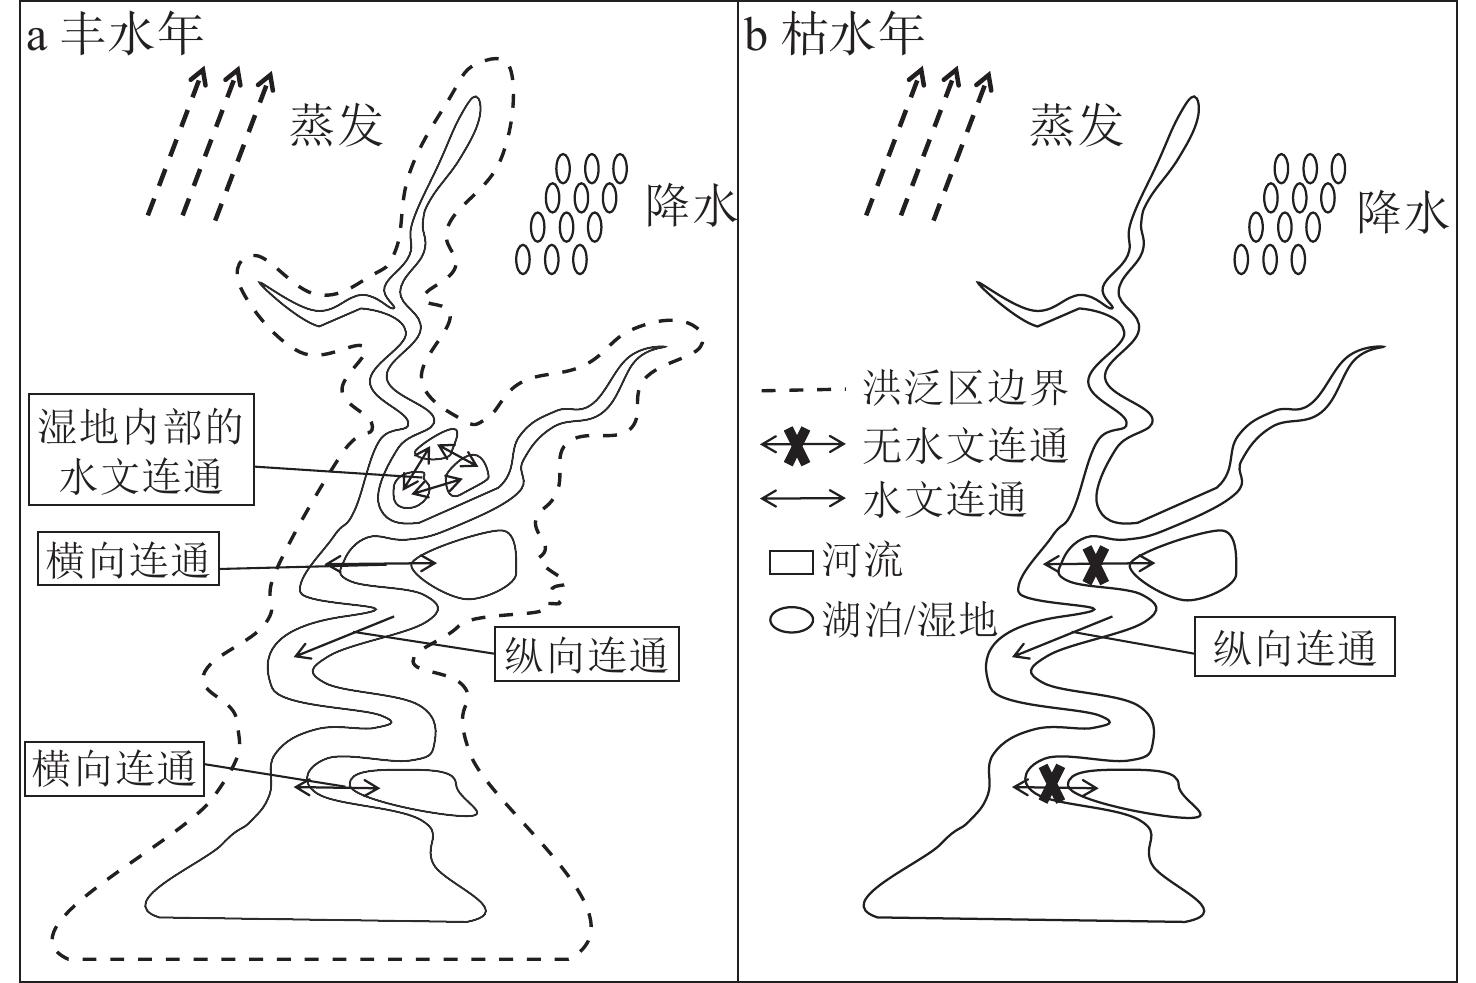
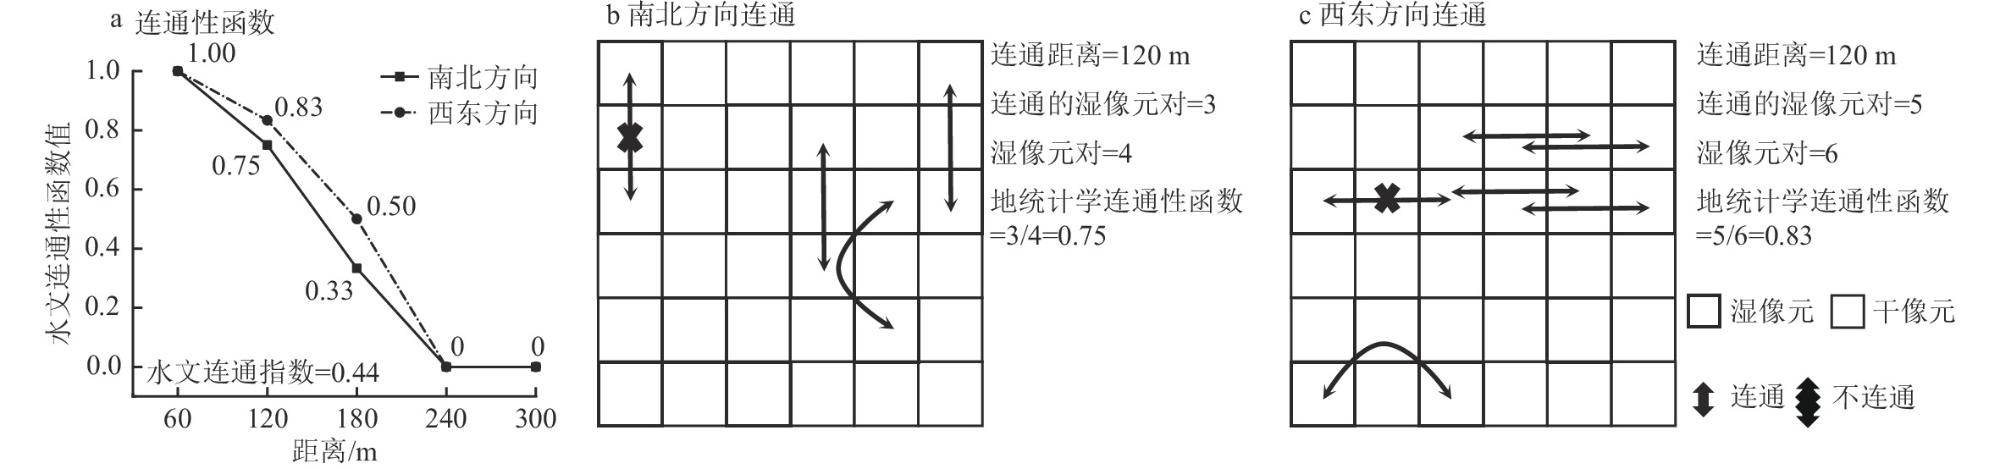
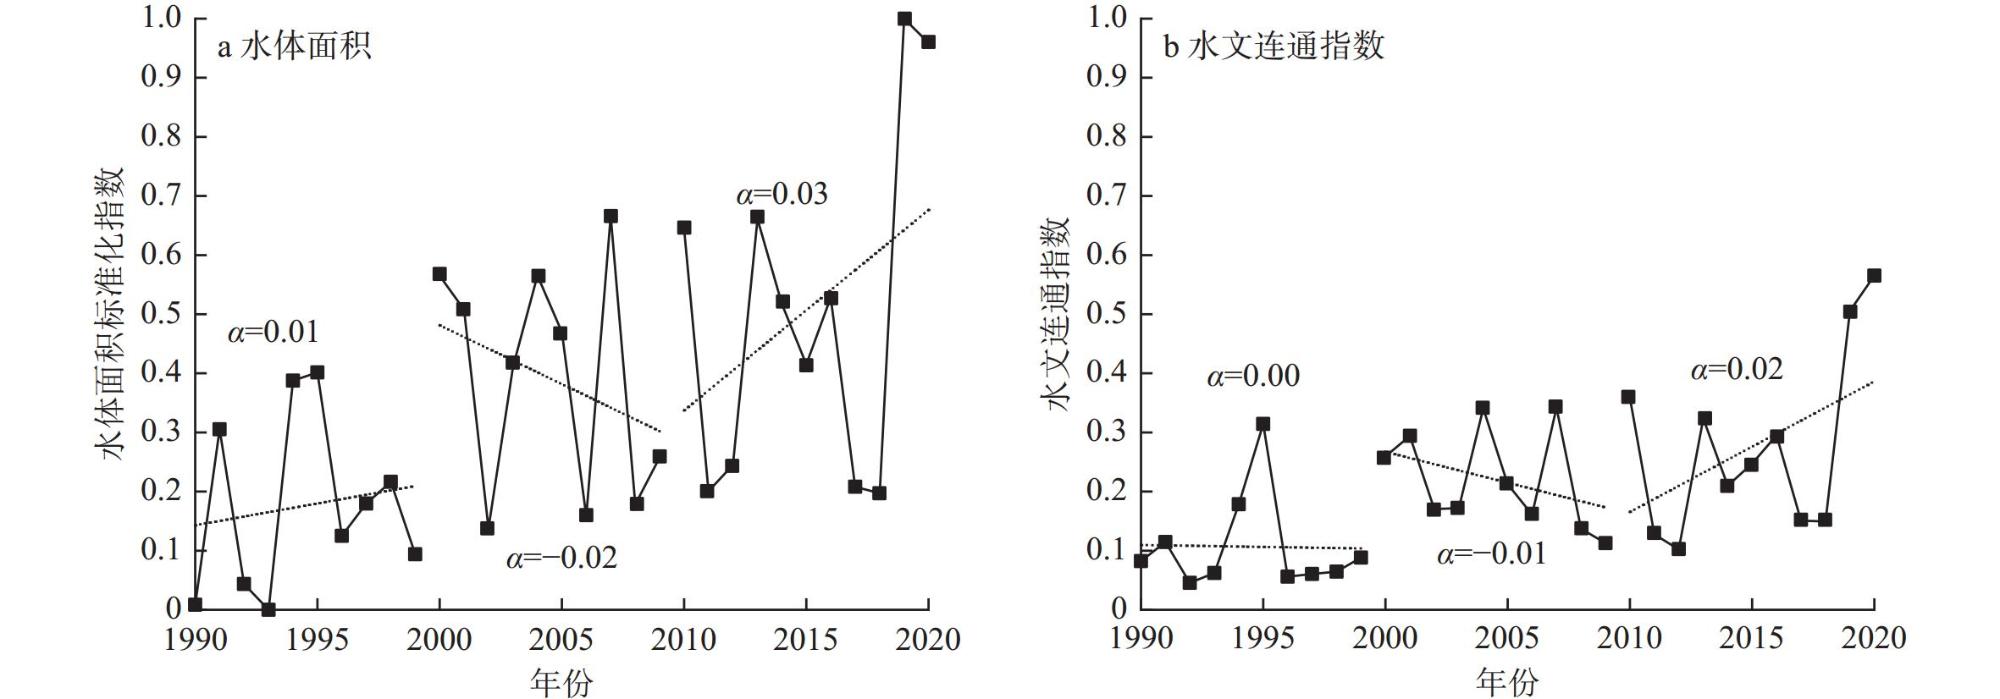
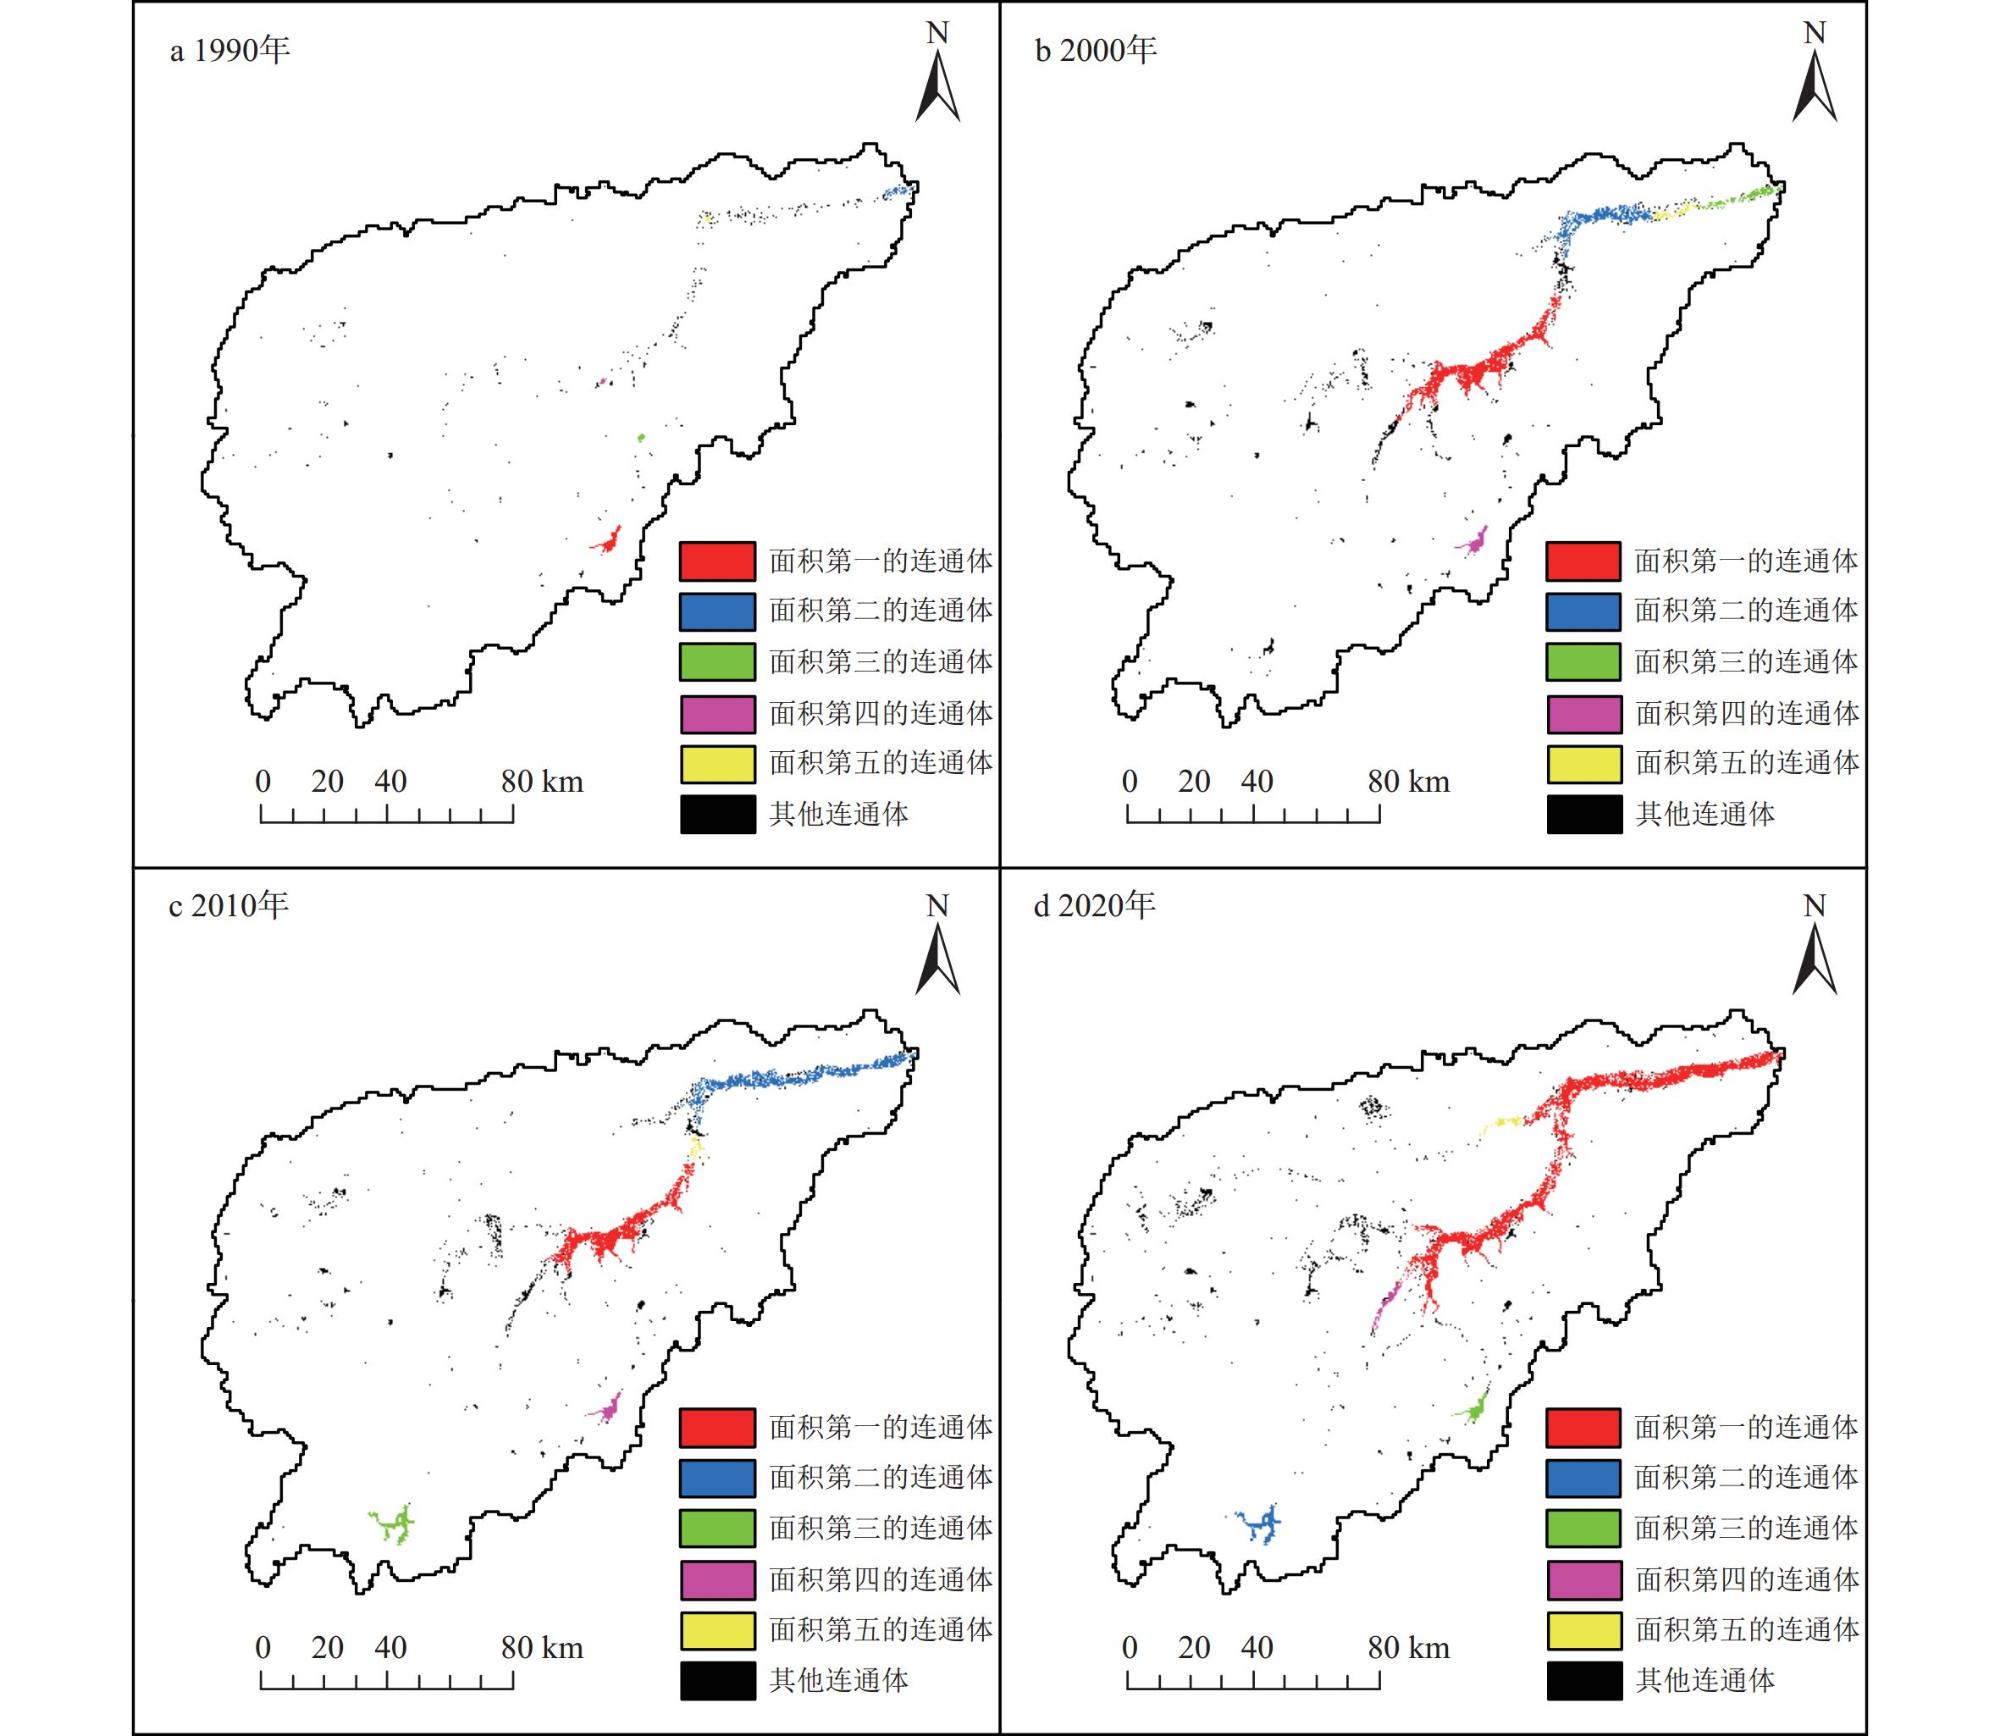
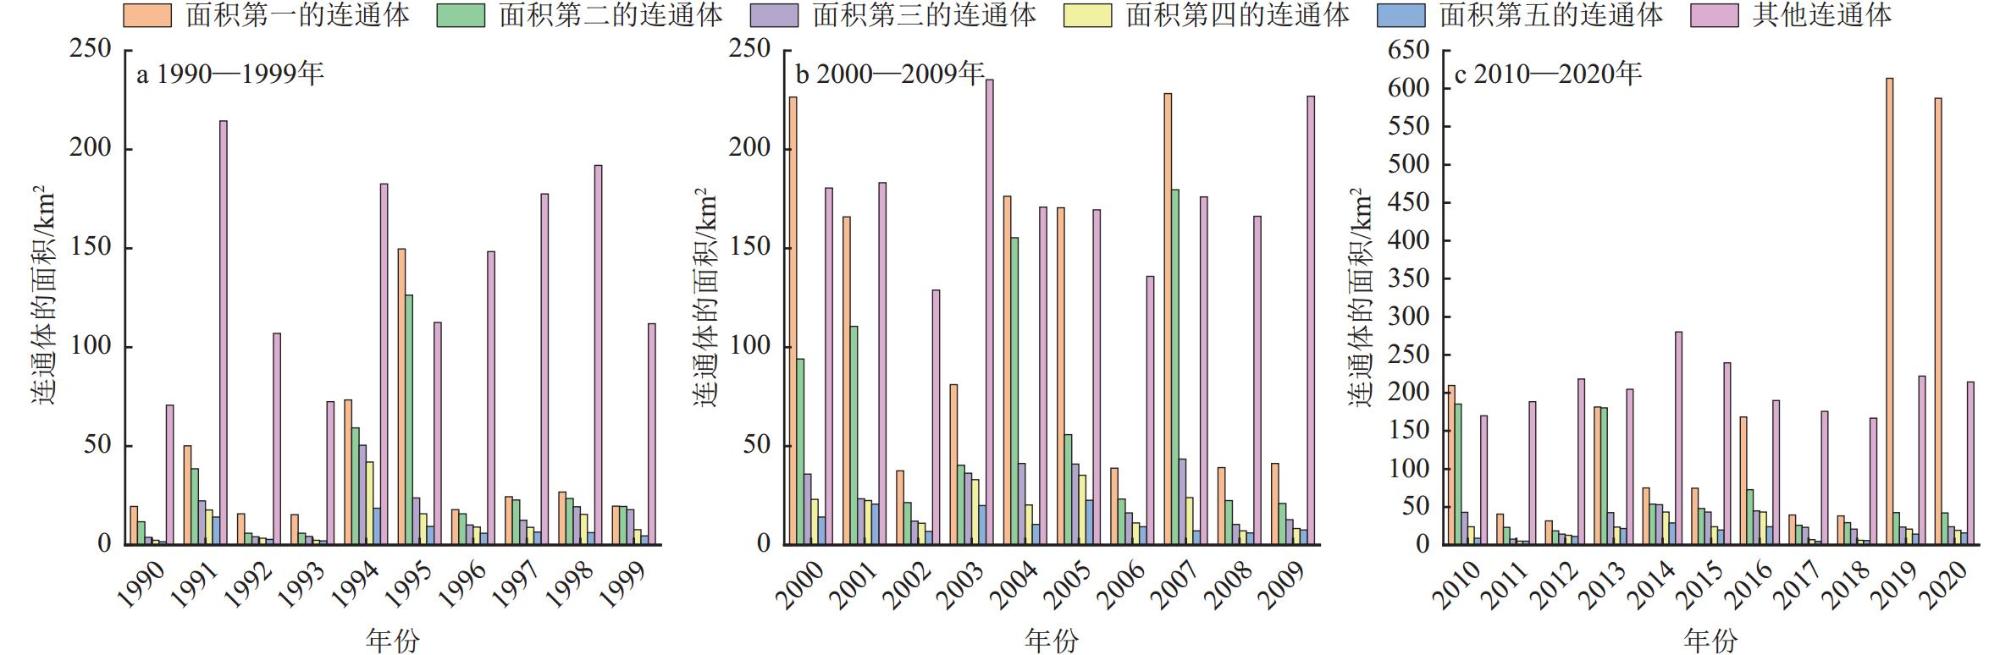
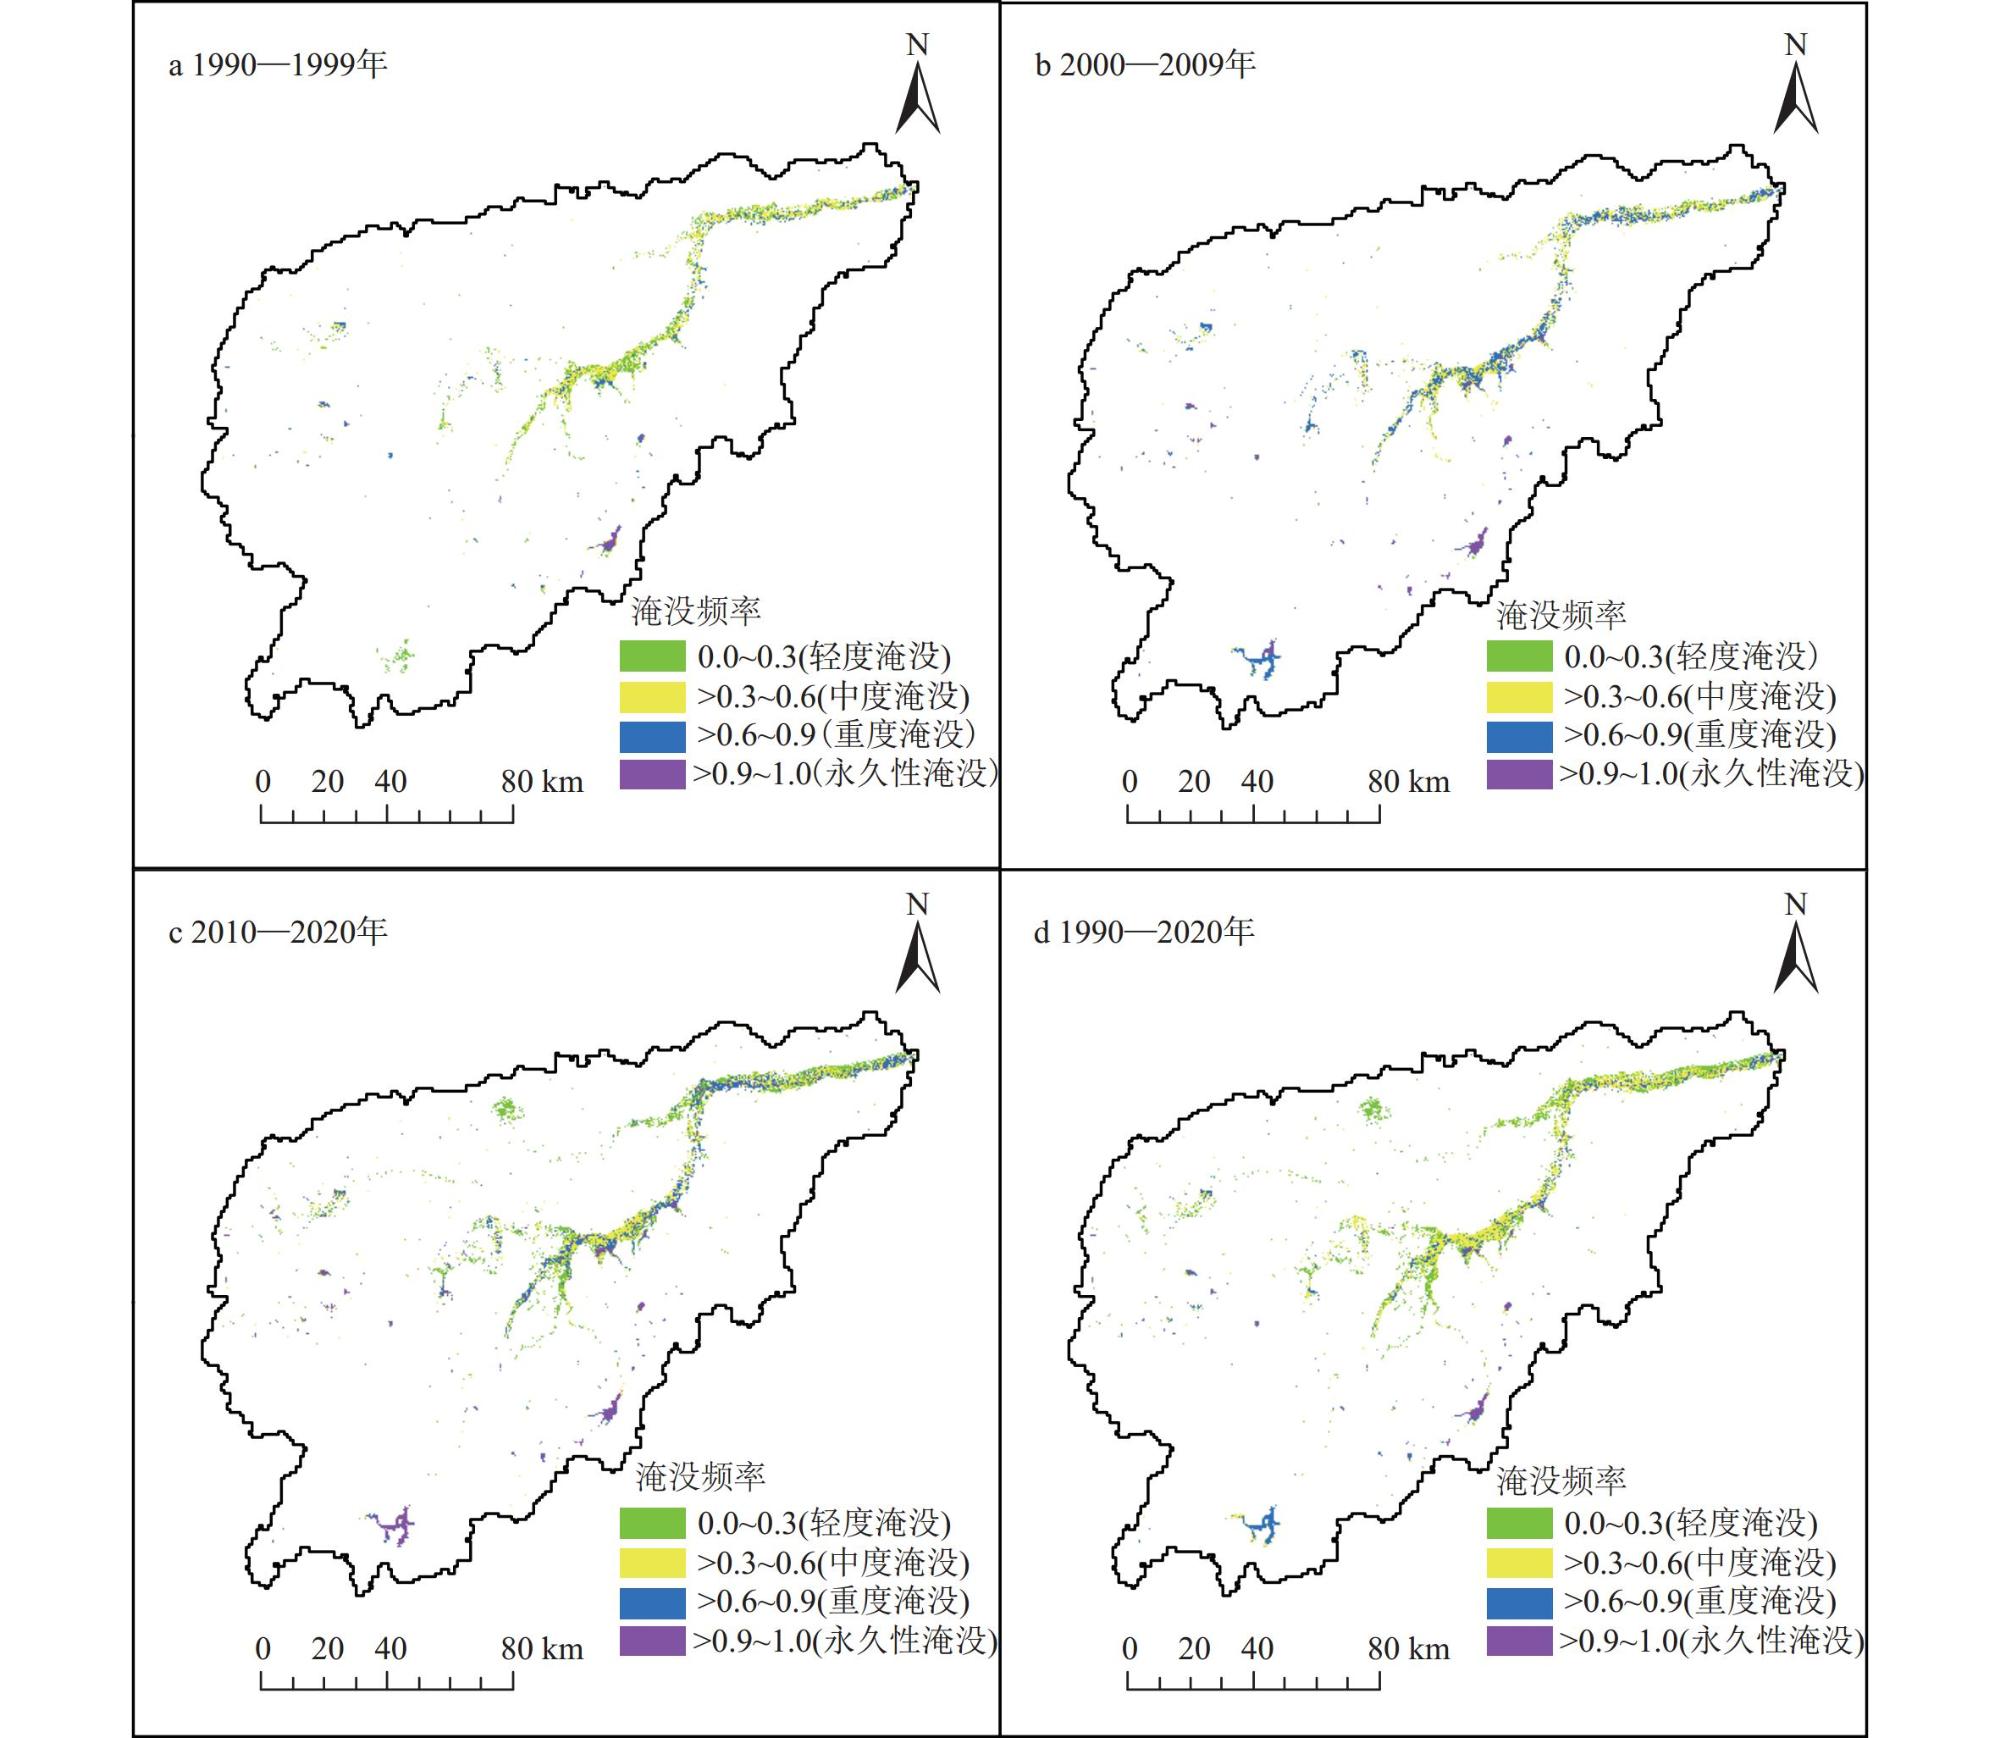
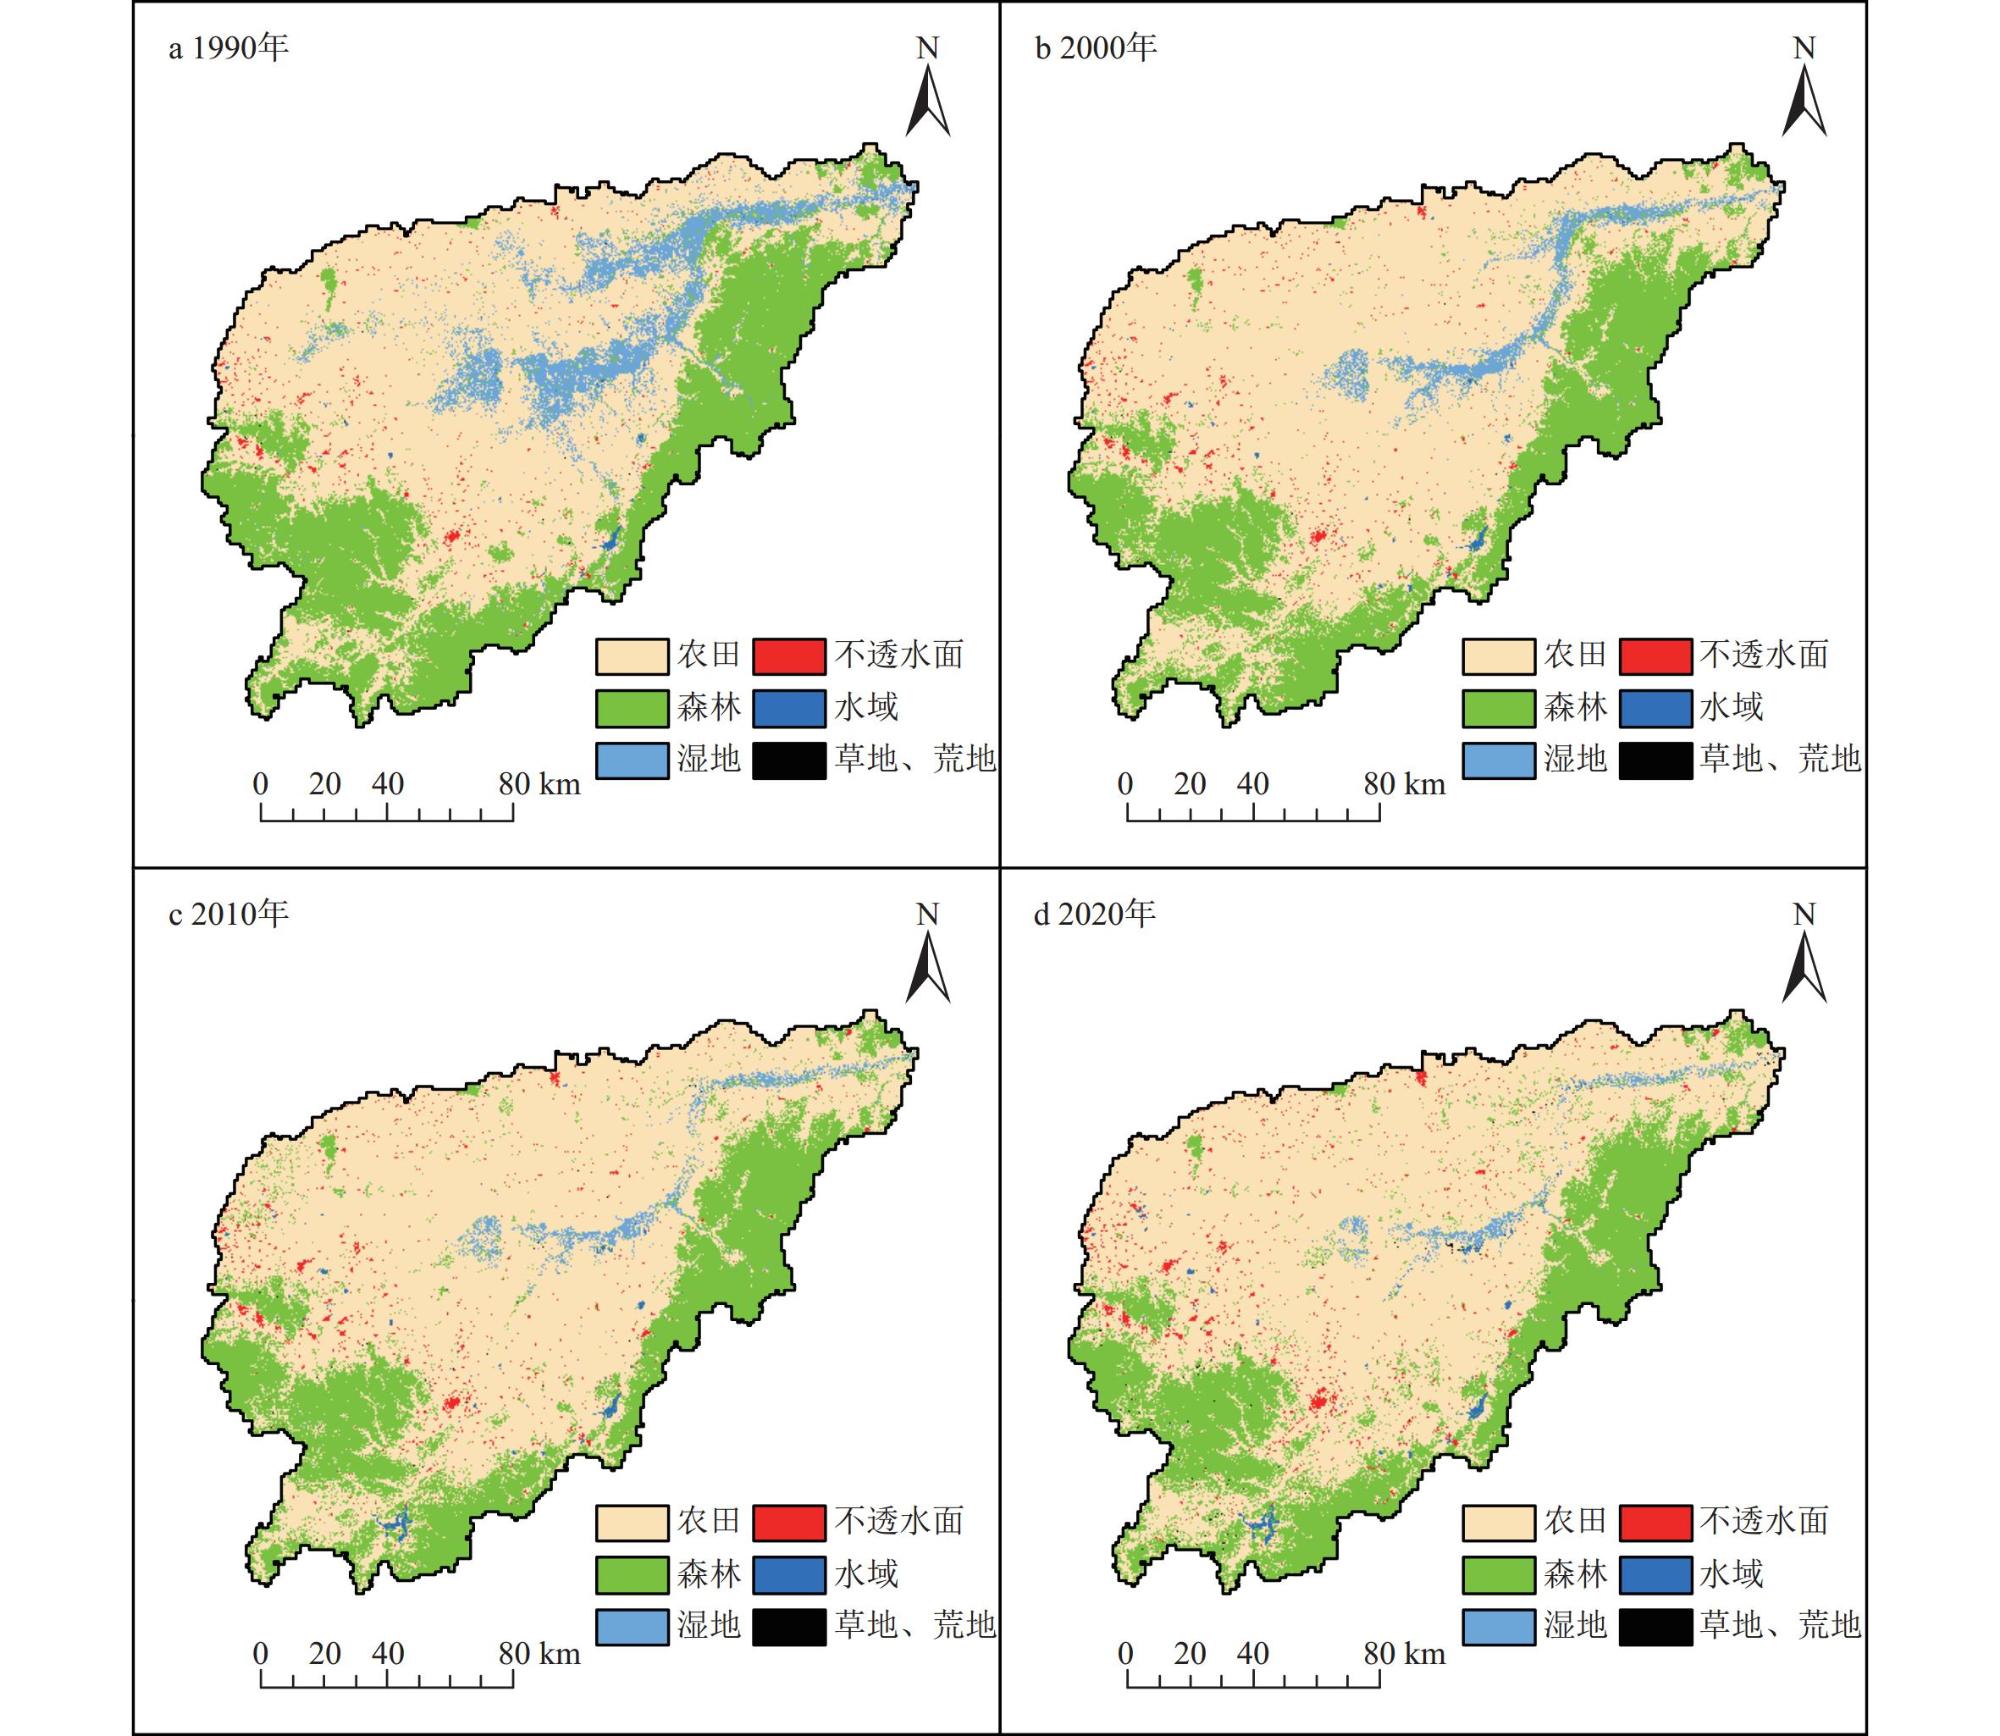
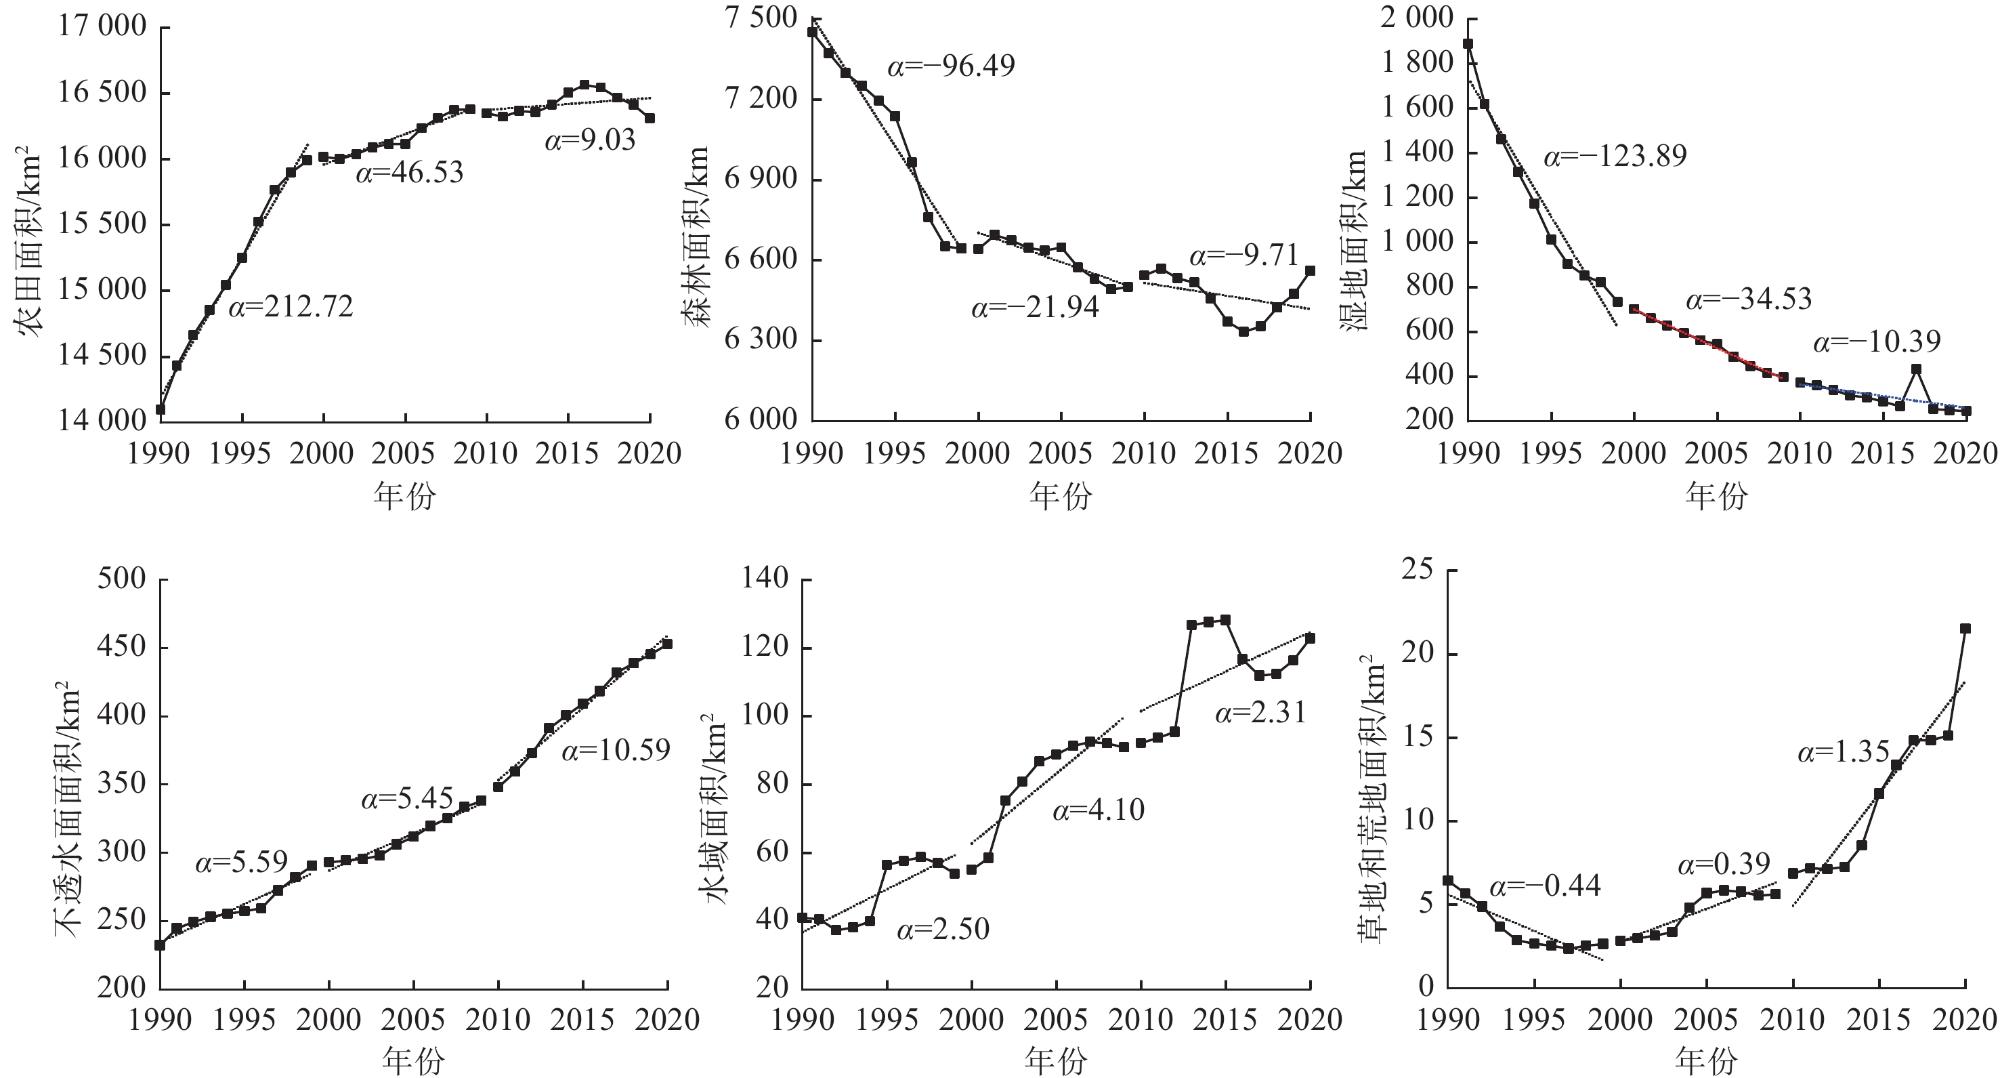
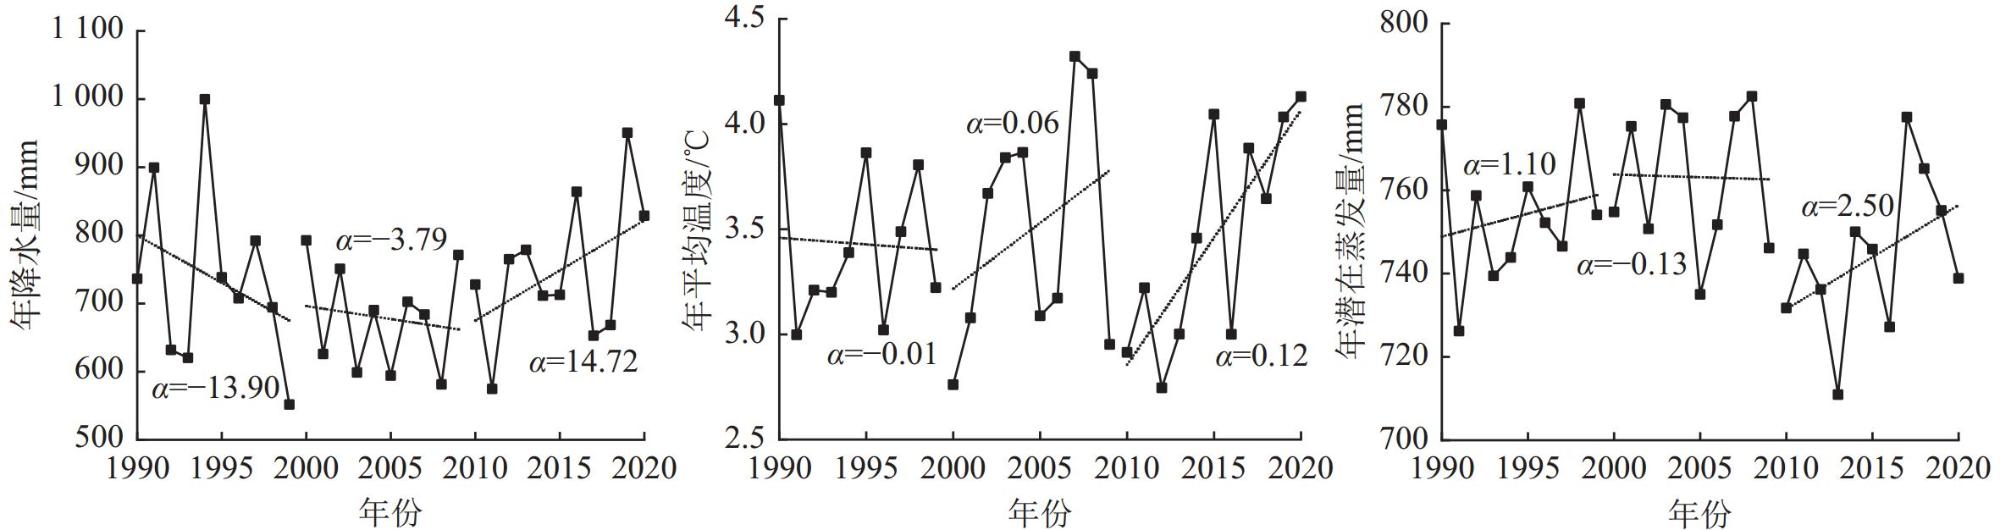
湿地水文连通对于维持生态系统的稳定和促进物种多样性具有重要意义。为了量化湿地水文连通并探究其驱动机制,通过谷歌地球引擎(Google Earth Engine)平台提取1990—2020年挠力河流域水体数据,采用地统计学连通性函数和淹没频率,定量评估挠力河流域湿地水文连通的时空动态变化。研究结果表明,在年际尺度上,挠力河流域正逐步表现出水文连通性增强及淹没频率提升的发展趋势;从空间角度看,挠力河中下游区域的水体多次发生重组且容易形成大型连通体,流域淹没频率呈现东北高、西南低的态势;土地利用类型的转化与气候因素的变动,共同影响了挠力河流域的湿地水文连通性。研究结果可以为挠力河流域的生态系统保护与湿地修复工作提供依据。
穆家徐 , 齐鹏 , 王敏 . 湿地水文连通的定量评估和影响因素分析[J]. 湿地科学, 2025 , 23(4) : 655 -667 . DOI: 10.13248/j.cnki.wetlandsci.20240182
Hydrological connectivity plays a vital role in maintaining ecosystem stability and enhancing biodiversity within wetland systems. It critically influences material cycles, energy flows, and biological migration pathways both within individual wetlands and across interconnected complexes. Land use types constitute a significant factor in altering wetland hydrological connectivity, profoundly shaping its spatial patterns. Simultaneously, climatic factors serve as direct drivers of hydrological connectivity changes in wetlands, predominantly manifesting their influence across temporal scales. Quantitative assessment of hydrological connectivity and analysis of its driving factors have emerged as prominent research foci. However, the absence of a standardized evaluation framework for hydrological connectivity hinders a comprehensive understanding and practical application by researchers. This limitation is particularly evident in the relatively scarce body of research dedicated to integrated assessments of hydrological connectivity across large spatial scales and extended temporal sequences. Consequently, there is a critical need to conduct quantitative analyses utilizing long-term hydrological data. Such analyses aim to elucidate the temporal dynamics and evolutionary patterns of hydrological connectivity, thereby enabling the investigation of the underlying mechanisms through which diverse factors influence connectivity. This approach not only advances fundamental knowledge of the intrinsic nature and governing principles of hydrological connectivity but also provides robust scientific underpinning for the scientific management and decision-making processes related to water resources. In recent decades, the Naoli River Basin has experienced significant ecological degradation due to intensified human activities and climate change, leading to various environmental challenges. Increased flood frequency has further disrupted the basin's inherent hydrological connectivity, undermining its stability. This study quantifies wetland hydrological connectivity and explores its driving mechanisms using water body data extracted via Google Earth Engine (GEE) from 1990 to 2020. We employed geostatistical connectivity functions and inundation frequency analysis to assess spatiotemporal dynamics. The results of the study show that a clear trend of increasing hydrological connectivity and inundation frequency emerged over time. The basin's Hydrological Connectivity Index rose from 0.11 (1990-1999) to 0.22 (2000-2009), reaching 0.28 (2010-2020). Concurrently, the total inundated area expanded from 722.93 km2 (1990-1999) to
1 Table of inundation in the Naoli River Basin at different time periods from 1990 to 20201990—2020年不同时期挠力河流域淹没情况 |
| 指标 | 1990—1999年 | 2000—2009年 | 2010—2020年 | 1990—2020年 |
| 轻度淹没面积占比/% | 35.0 | 8.1 | 34.6 | 39.2 |
| 中度淹没面积占比/% | 42.4 | 37.0 | 26.4 | 38.4 |
| 重度淹没面积占比/% | 17.4 | 43.0 | 22.9 | 16.5 |
| 永久性淹没面积占比/% | 5.2 | 11.9 | 16.1 | 5.9 |
| 总淹没面积/km2 | 636.76 | 722.93 | 1 053.41 | 1 059.59 |
| 水文连通指数 | 0.11 | 0.22 | 0.28 | 0.20 |
2 Correlation analysis table between water temperature connectivity indicators and meteorological data水温连通指标与气象数据的相关性分析表 |
| 相关性分析 | 年降水量 | 年平均气温 | 年潜在蒸发量 | |
| 注:数据右上角* 表示在p<0.05水平显著相关。 | ||||
| 水体面积 | 皮尔逊相关性 | 0.441* | 0.164 | −0.196 |
| 显著性 | 0.013 | 0.378 | 0.290 | |
| 水文连通指数 | 皮尔逊相关性 | 0.367* | 0.284 | −0.133 |
| 显著性 | 0.043 | 0.122 | 0.476 | |
/
| 〈 |
|
〉 |