
扎龙湿地土壤有效硅含量分布特征及影响因素
|
张晴(1999—),女,河北省唐山人,硕士研究生,从事湿地生态与环境研究。E-mail: 1963322048@qq.com |
收稿日期: 2024-04-17
修回日期: 2024-06-15
网络出版日期: 2026-03-12
版权
Distribution characteristics and influencing factors of soil available silicon content in Zhalong Wetland
Received date: 2024-04-17
Revised date: 2024-06-15
Online published: 2026-03-12
Copyright
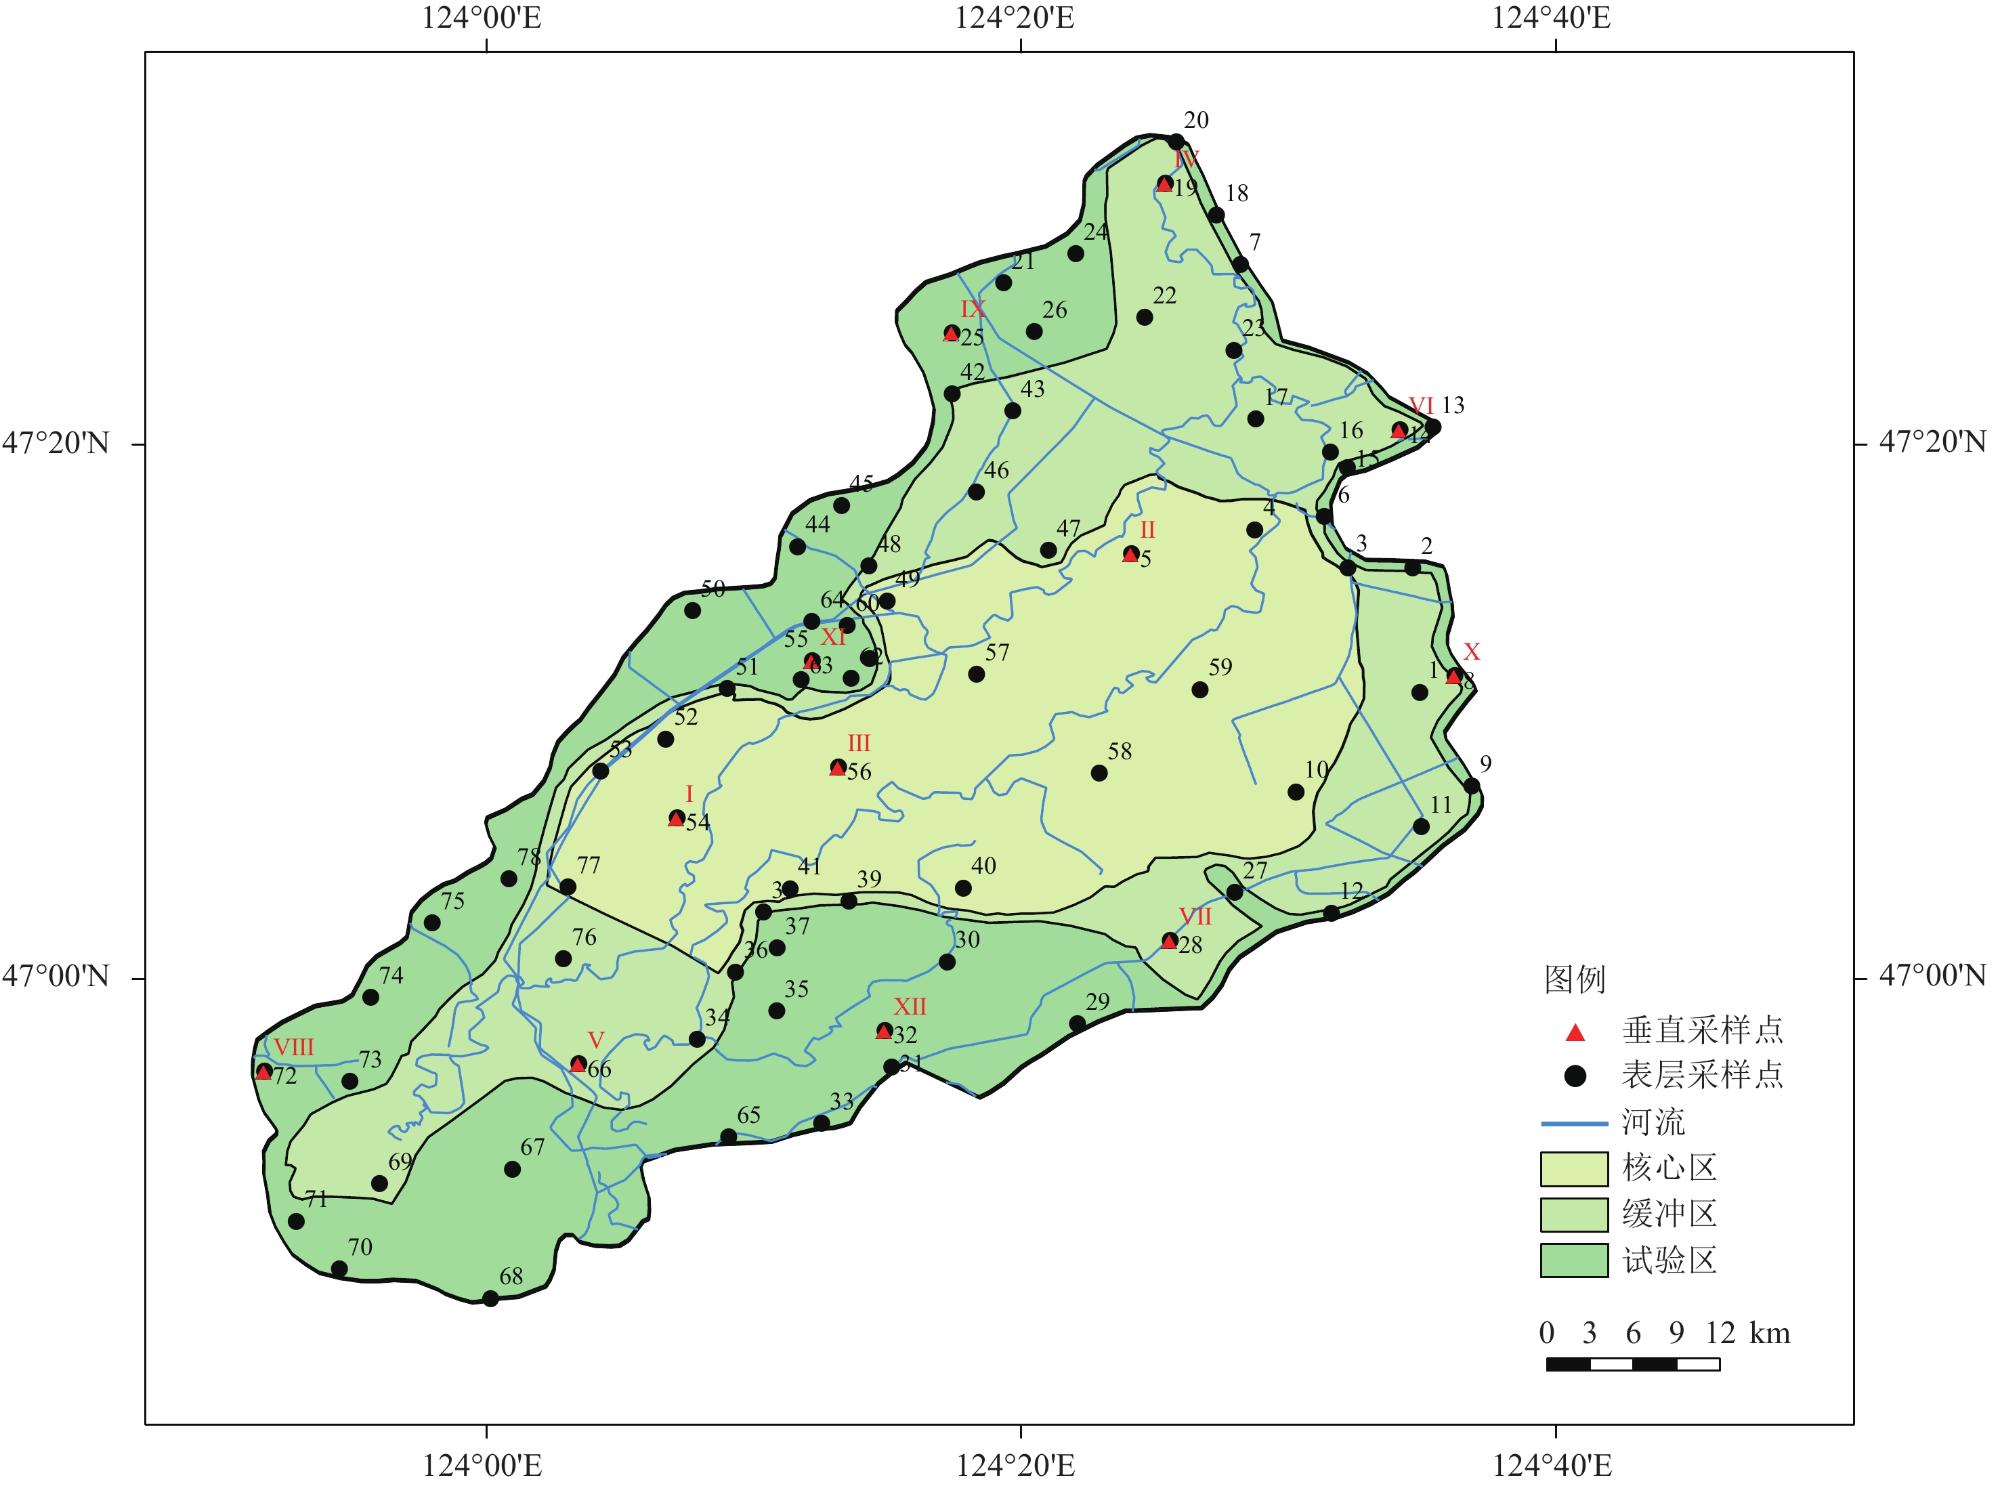
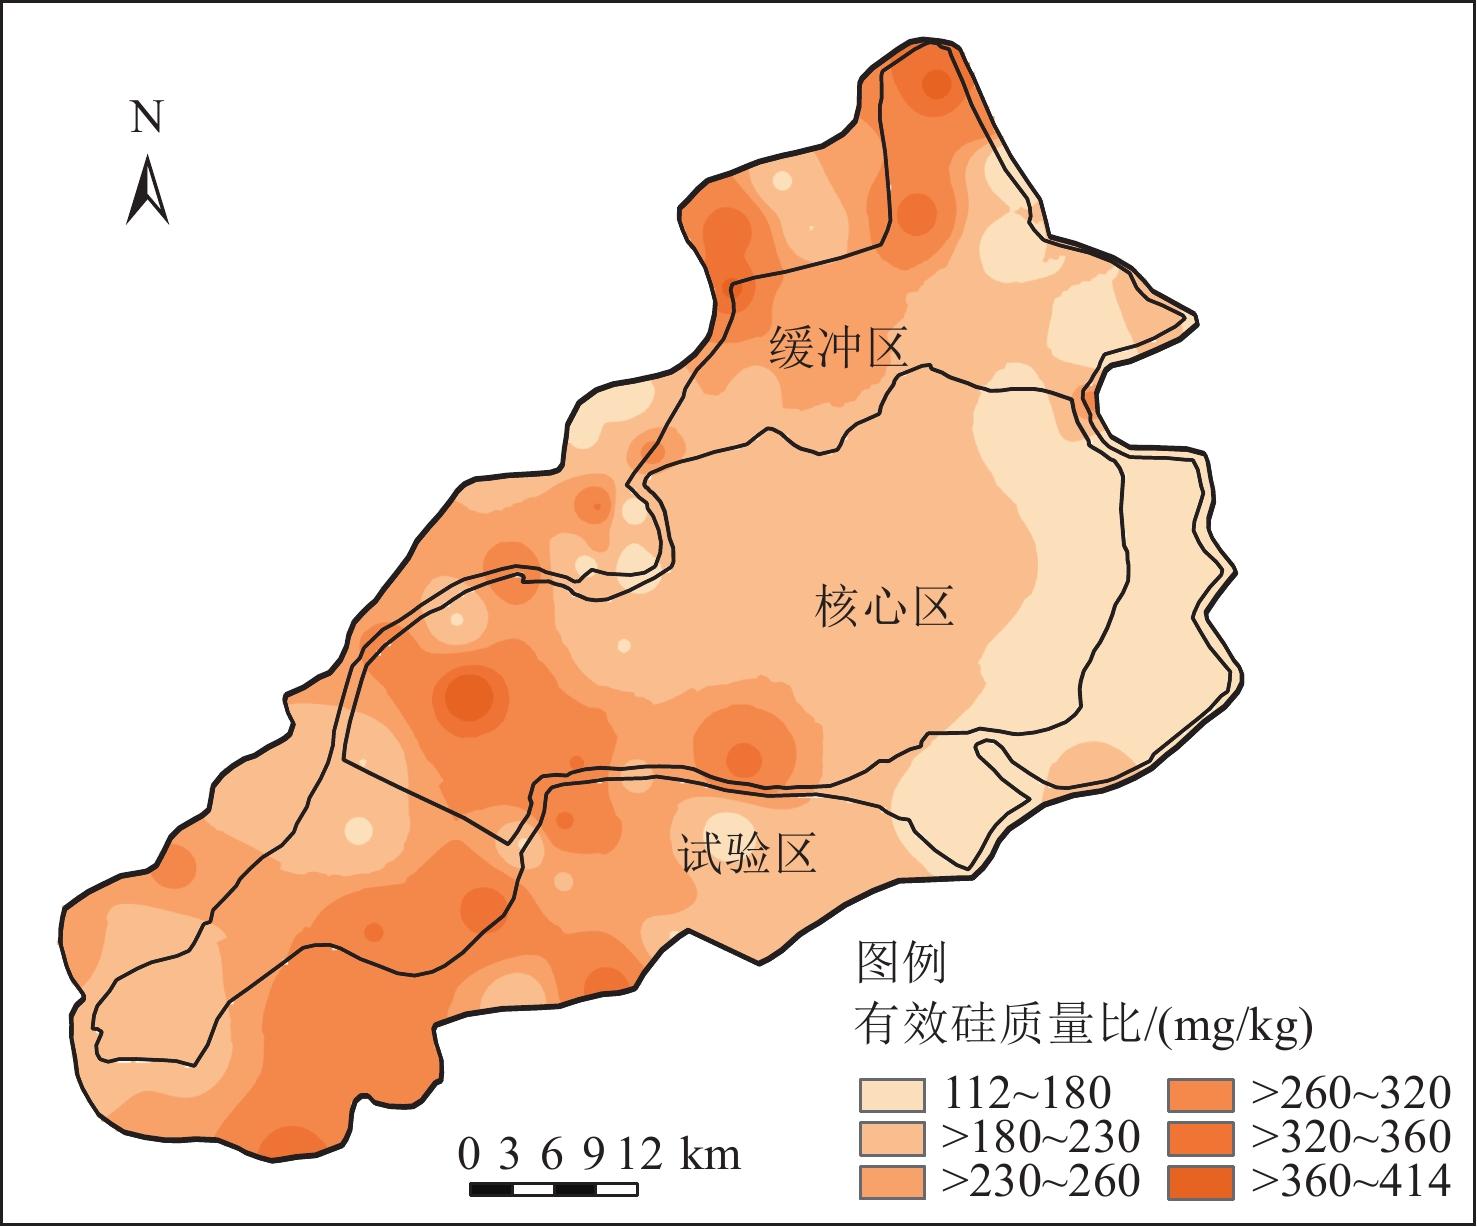
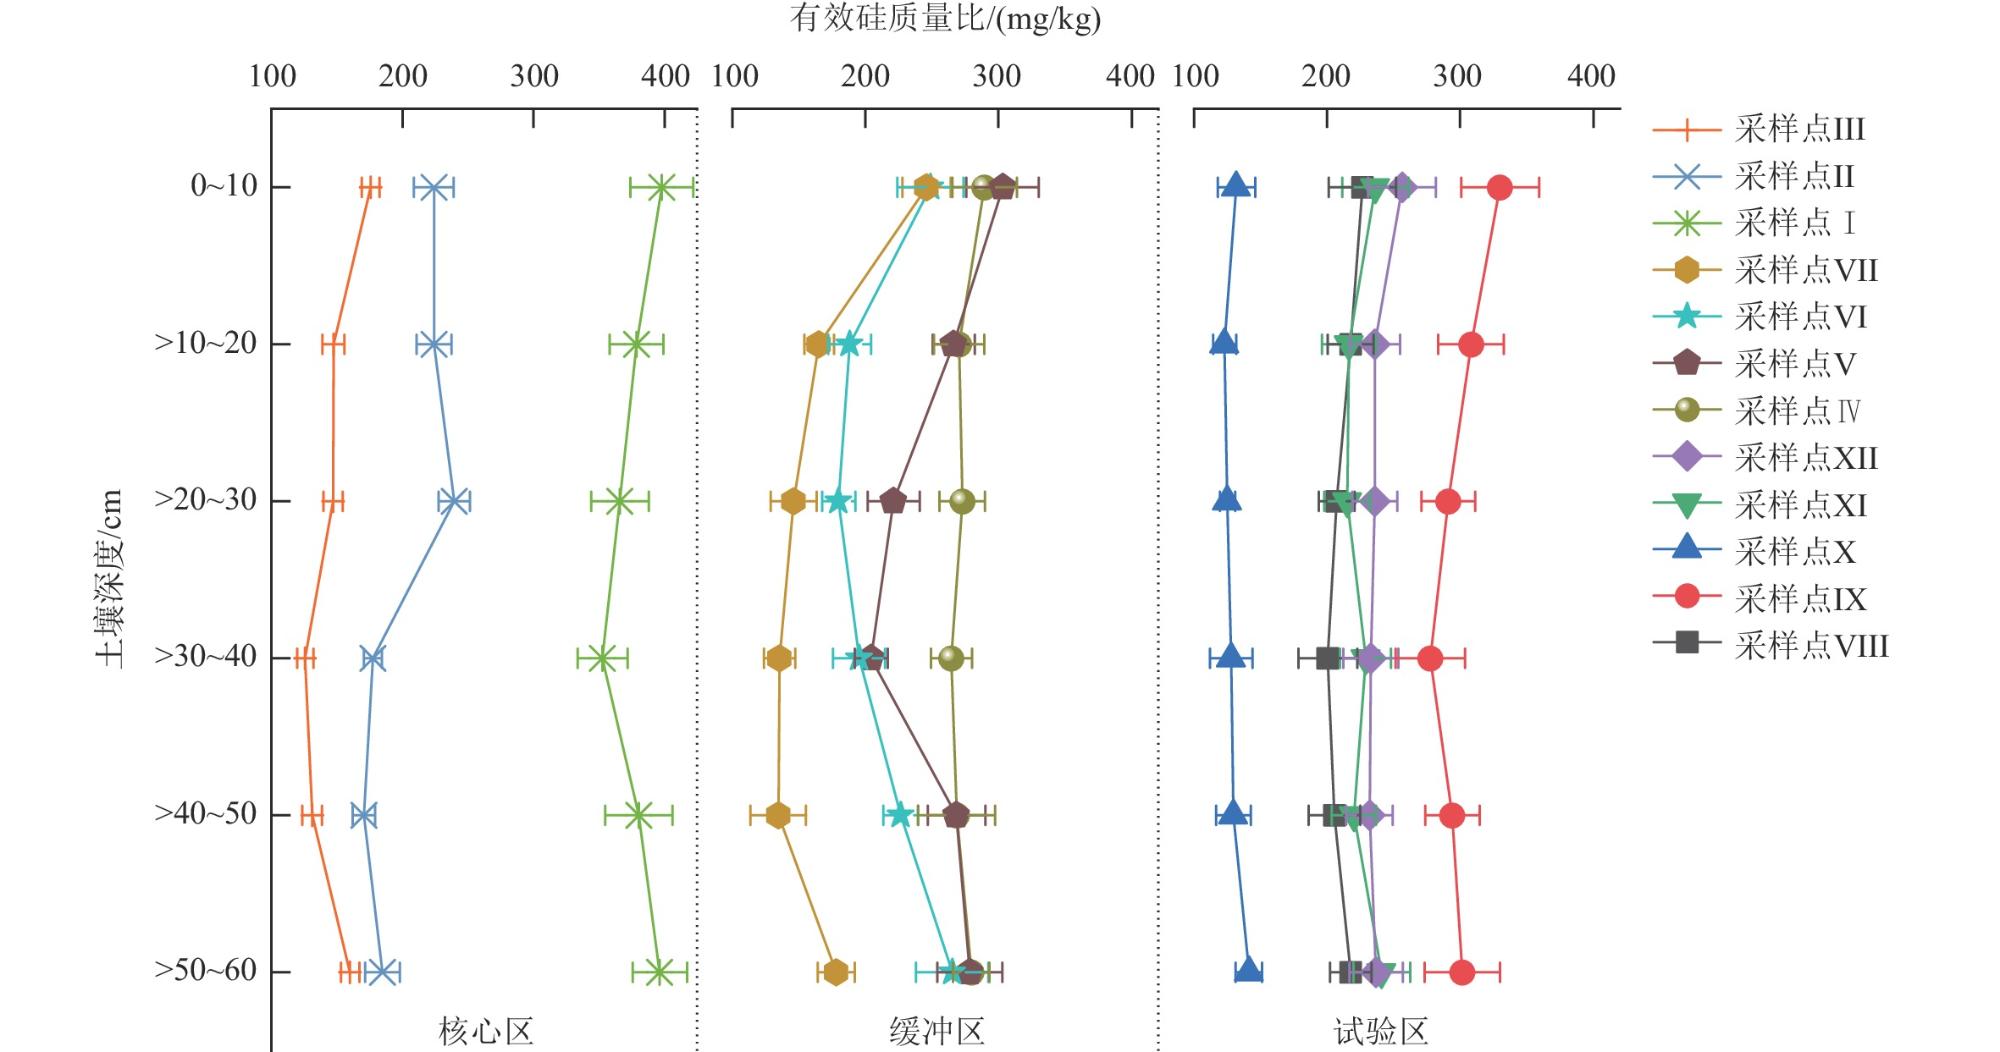
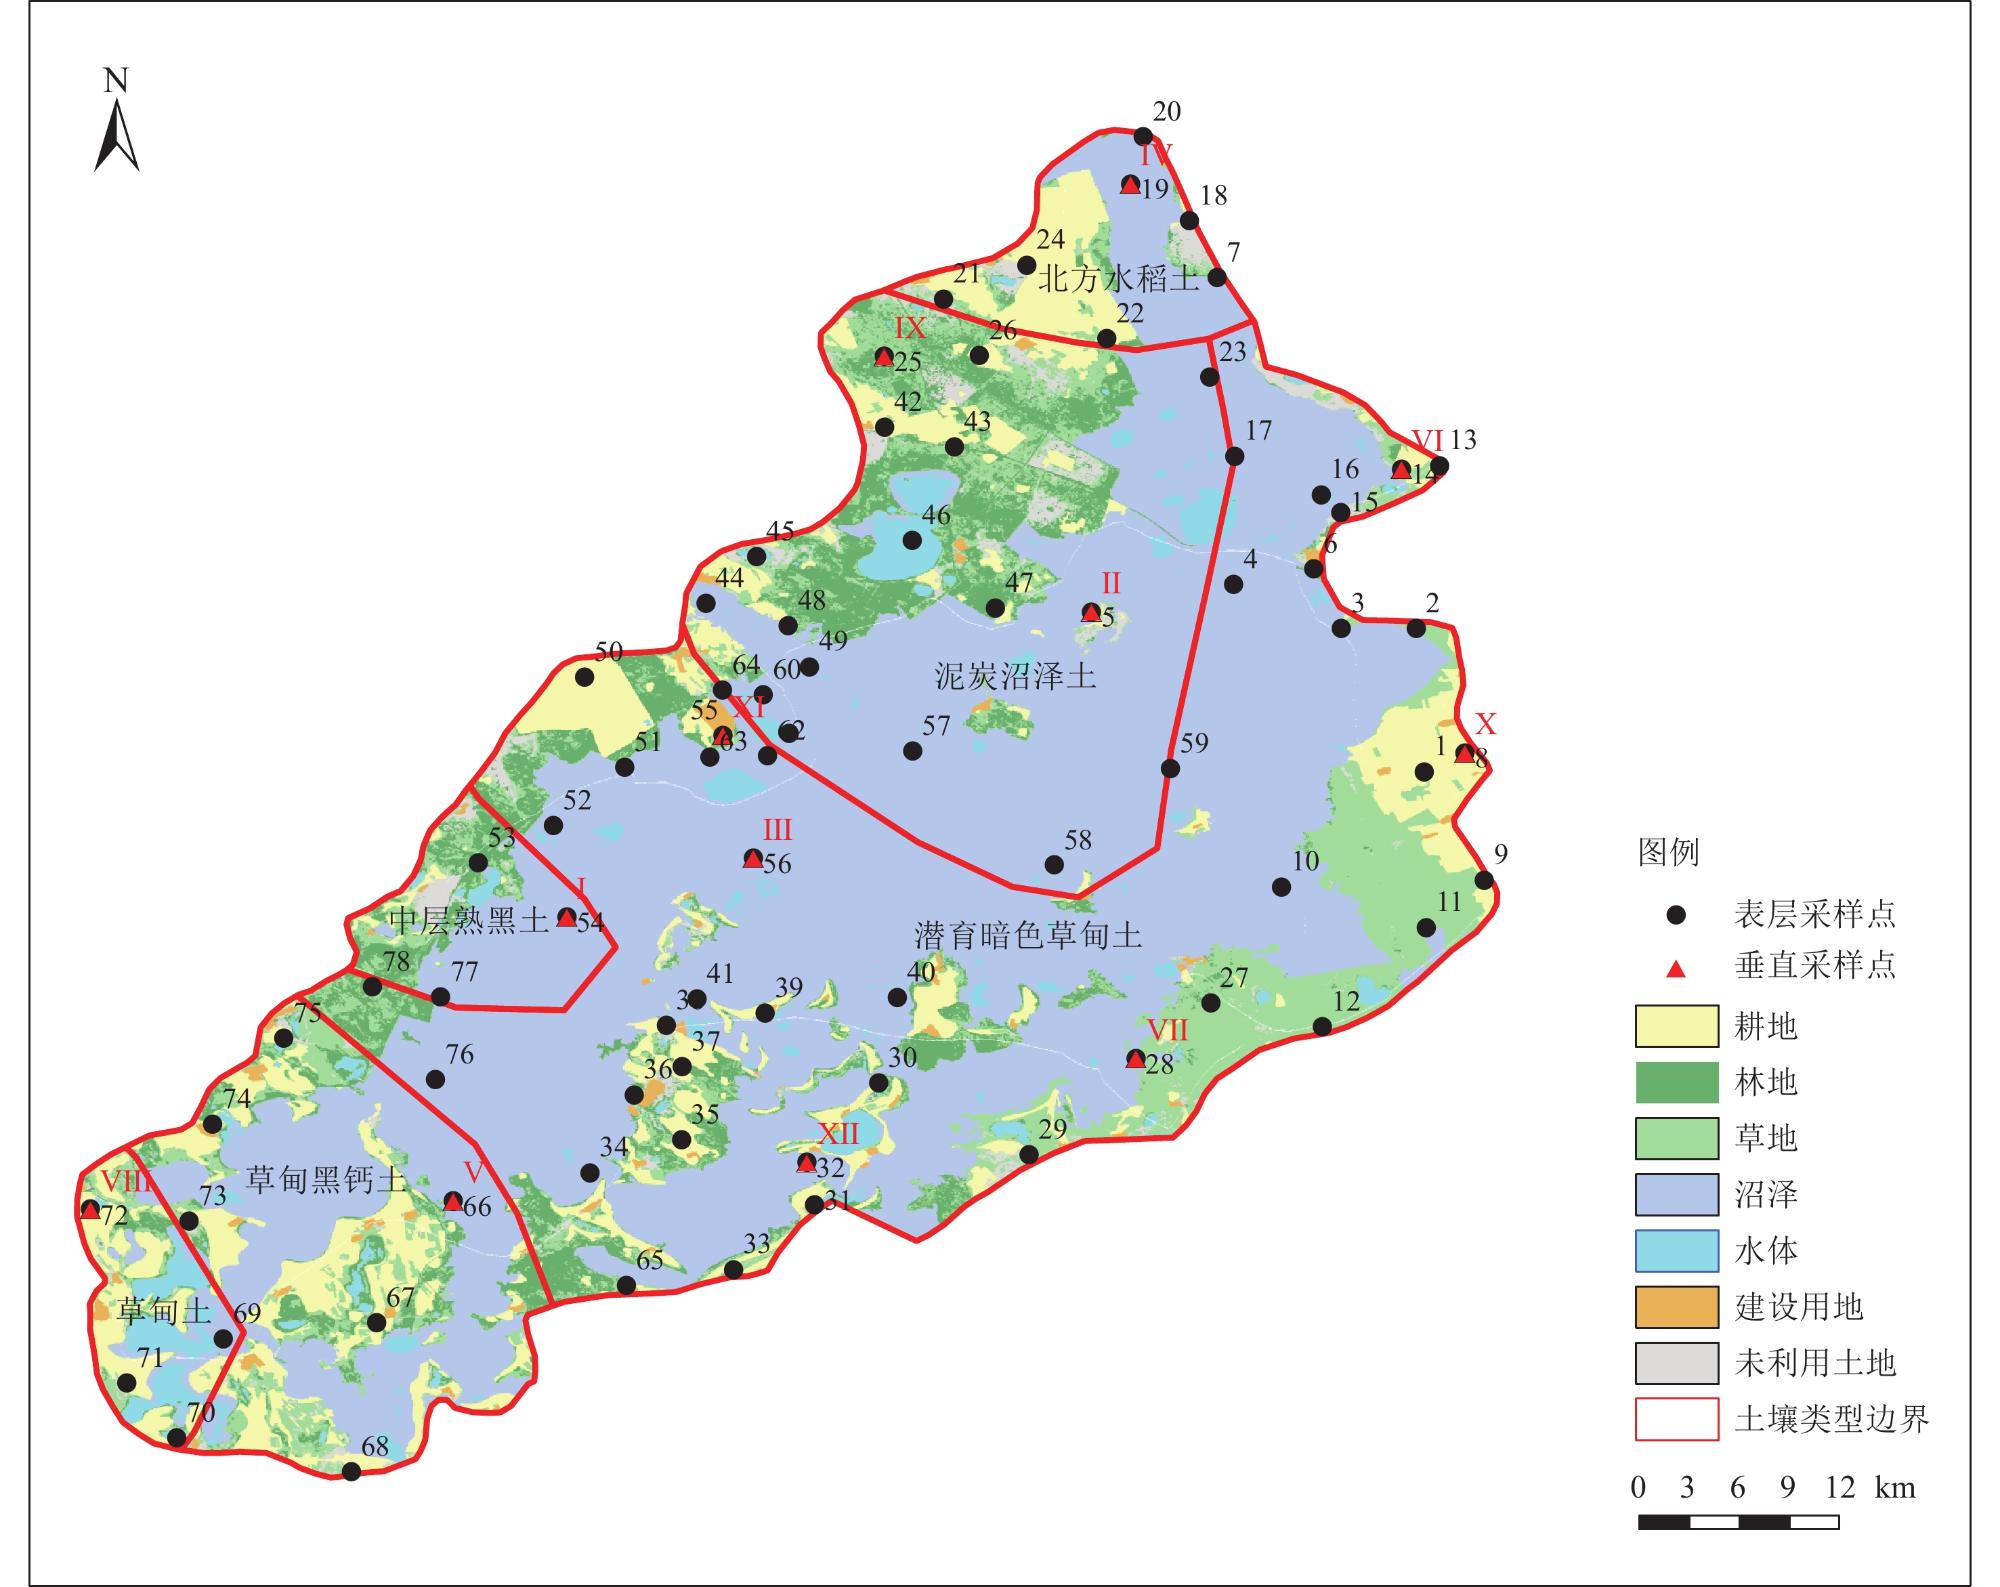
硅是湿地生态系统的重要元素之一,土壤有效硅是植物可吸收硅素的核心组分。为了解扎龙湿地土壤有效硅含量分布特征及影响因素,在扎龙湿地设置了78个表层土壤采样点和12个剖面土壤采样点,测定各采样点土壤有效硅含量,并分析其与土壤理化指标之间的关系。研究结果表明,扎龙湿地表层土壤有效硅质量比平均值为225.71 mg/kg,属于丰富水平,变异系数为33.16%,属于中度变异。扎龙湿地土壤有效硅空间分布存在较大差异,整体呈现为由西向东递减的分布特征,北部、中南部和东南部土壤有效硅含量高于其他区域。在剖面土样中,随着土壤深度的增加,土壤有效硅含量整体呈先减少后增加的规律。扎龙湿地土壤有效硅含量受土壤养分和理化性质的影响,表层和剖面土壤有效硅含量与土壤全磷和无机磷含量极显著正相关,与土壤pH分别显著负相关和极显著负相关,表层土壤有效硅含量与土壤黏粒含量极显著正相关,与砂粒含量显著负相关。土壤类型和土地利用方式对土壤有效硅含量也有影响,其中中层熟黑土有效硅含量高,潜育暗色草甸土有效硅含量低;林地土壤有效硅含量高,草地土壤有效硅含量低。本研究结果为揭示湿地生态系统生源要素硅的生物地球化学循环过程提供理论依据,对了解扎龙湿地土壤的供硅能力具有重要参考价值。
张晴 , 叶华香 , 臧淑英 , 徐明 , 王鸿洋 . 扎龙湿地土壤有效硅含量分布特征及影响因素[J]. 湿地科学, 2025 , 23(2) : 309 -319 . DOI: 10.13248/j.cnki.wetlandsci.20240110
Silicon is one of the important contents of the element cycle in wetland system, and soil available silicon is the core component of plant absorbable silicon. To understand the distribution characteristics and influencing factors of soil available silicon content in Zhalong Wetland, 78 surface soil sampling points and 12 profile soil sampling points were set up in Zhalong Wetland to measure the soil available silicon content at each sampling point and analyze the relationship between soil available silica content and soil physical and chemical indexes. The results showed that the average effective silicon mass ratio of the surface soil in Zhalong Wetland was 225.71 mg/kg, which belonged to the abundance level, and the coefficient of variation was 33.16%, which belonged to the moderate variation. There were great differences in the spatial distribution of soil available silica in Zhalong Wetland, and the overall distribution characteristics showed a decreasing distribution from west to east, and the soil available silica content in the northern, south-central and southeastern parts of the study area was higher than that in other regions. In the profile soil samples, with the increase of soil depth, the available silicon content of soil decreased first and then increased. The soil available silicon content in Zhalong Wetland was affected by soil nutrients and physicochemical properties, and the available silicon content in the surface and profile soil was significantly positively correlated with the soil total phosphorus and inorganic phosphorus content, and was significantly negatively correlated with the soil pH, respectively, and the available silicon content in the surface soil was significantly positively correlated with the soil clay content, and negatively correlated with the sand content. Soil type and land use also had an effect on the available silicon content of soil, among which the available silicon content of the middle cooked black soil was high, and the available silicon content of the latent dark meadow soil was low. The available silicon content of woodland soil was high, and the available silicon content of grassland soil was low. The results of this study provided a theoretical basis for revealing the biogeochemical cycle process of silicon, a biogenous factor in wetland ecosystems, and had important reference value for understanding the silica supply capacity of soil in Zhalong Wetland.
1 Available silicon content in surface soil of each functional area in Zhalong Wetland扎龙湿地各功能区表层土壤有效硅含量 |
| 功能区 | 有效硅质量比/(mg/kg) | 标准差 | 变异系数/% | ||
| 最小值 | 最大值 | 平均值 | |||
| 核心区 | 128.79 | 414.43 | 227.59 | 79.42 | 34.90 |
| 缓冲区 | 128.79 | 376.73 | 233.27 | 74.88 | 32.10 |
| 试验区 | 111.97 | 371.38 | 226.39 | 72.11 | 31.85 |
| 整个研究区 | 111.97 | 414.43 | 225.71 | 74.86 | 33.16 |
4 Soil types and land use patterns at each sampling site in Zhalong Wetland扎龙湿地各采样点的土壤类型和土地利用方式 |
2 Available silicon content in surface soil by soil type in Zhalong Wetland扎龙湿地各土壤类型表层土壤有效硅含量 |
| 土壤类型 | 有效硅质量比/(mg/kg) | 标准差 | ||
| 最小值 | 最大值 | 平均值 | ||
| 北方水稻土 | 111.97 | 376.73 | 272.60 | 101.68 |
| 草甸黑钙土 | 191.64 | 345.09 | 272.45 | 59.31 |
| 草甸土 | 186.04 | 254.20 | 223.59 | 30.88 |
| 泥炭沼泽土 | 135.28 | 371.38 | 220.37 | 64.94 |
| 潜育暗色草甸土 | 128.79 | 357.18 | 208.72 | 70.86 |
| 中层熟黑土 | 178.95 | 414.43 | 288.23 | 118.65 |
3 Available silicon content in surface soil by land use patterns in Zhalong Wetland扎龙湿地各土地利用方式表层土壤有效硅含量 |
| 土地利用方式 | 有效硅质量比/(mg/kg) | 标准差 | ||
| 最小值 | 最大值 | 平均值 | ||
| 林地 | 226.46 | 355.19 | 279.01 | 67.54 |
| 耕地 | 137.35 | 371.38 | 245.85 | 80.02 |
| 沼泽 | 128.79 | 414.43 | 229.84 | 81.51 |
| 水体 | 135.28 | 254.20 | 204.43 | 61.78 |
| 草地 | 111.97 | 355.19 | 198.15 | 54.67 |
4 Soil nutrient content in Zhalong Wetland扎龙湿地土壤养分含量 |
| 土壤样品 | 指标 | 最小值/(mg/kg) | 最大值/(mg/kg) | 平均值/(mg/kg) | 标准差 |
| 表层样品 | 全磷 | 240.44 | 1 032.44 | 503.66 | 143.49 |
| 有机磷 | 64.52 | 368.17 | 213.64 | 59.25 | |
| 无机磷 | 196.10 | 899.54 | 318.60 | 113.03 | |
| 全氮 | 99.70 | 1 537.41 | 509.31 | 223.41 | |
| 硝态氮 | 0.72 | 115.63 | 31.49 | 41.09 | |
| 铵态氮 | 1.80 | 87.00 | 28.70 | 0.64 | |
| 剖面样品 | 全磷 | 210.07 | 680.72 | 352.76 | 122.09 |
| 有机磷 | 12.65 | 304.91 | 115.87 | 85.40 | |
| 无机磷 | 31.63 | 340.33 | 138.41 | 68.81 | |
| 全氮 | 18.99 | 755.790 | 334.07 | 167.68 | |
| 铵态氮 | 23.07 | 36.00 | 29.78 | 3.29 | |
| 硝态氮 | 11.90 | 132.20 | 30.07 | 167.68 |
5 Correlation coefficients between soil available silicon content and soil nutrient indexes土壤有效硅含量与土壤养分指标的相关系数 |
| 全磷含量 | 有机磷含量 | 无机磷含量 | 全氮含量 | 铵态氮含量 | 硝态氮含量 | |
| 注:*和**分别表示在 p<0.05 和p<0.01水平上显著相关。表层样品 n=78,剖面样品n=72。 | ||||||
| 表层有效硅含量 | 0.288* | −0.146 | 0.326** | 0.022 | 0.122 | 0.101 |
| 0.011 | 0.202 | 0.004 | 0.845 | 0.286 | 0.381 | |
| 剖面有效硅含量 | 0.390** | 0.164 | 0.429** | 0.099 | 0.135 | 0.083 |
| 0.001 | 0.168 | 0.000 | 0.416 | 0.270 | 0.509 | |
6 Soil physicochemical index content in Zhalong Wetland扎龙湿地土壤理化指标 |
| 土壤样品 | 指标 | 最小值 | 最大值 | 平均值 | 标准差 |
| 表层样品 | pH | 7.29 | 10.91 | 8.80 | 0.86 |
| 含水率/% | 1.75 | 86.97 | 29.00 | 18.38 | |
| 盐度/% | 0. 01 | 0. 45 | 0. 05 | 0. 07 | |
| 氧化还原电位/mv | −188.00 | 602.00 | 97.92 | 170.60 | |
| 黏粒/% | 4.00 | 74.00 | 35.46 | 14.65 | |
| 粉粒/% | 8.00 | 63.00 | 48.46 | 13.44 | |
| 砂粒/% | 20.00 | 86.00 | 36.47 | 13.03 | |
| 剖面样品 | pH | 8.20 | 10.72 | 9.10 | 0.81 |
| 含水率/% | 15.41 | 31.32 | 23.26 | 4.37% | |
| 盐度/% | 0.00 | 0.20 | 0.04 | 0.04 | |
| 氧化还原电位/mv | −133.00 | 261.00 | 87.43 | 92.88 |
7 Correlation coefficients of available silicon content and other physical and chemical indexes in surface soil表层土壤有效硅含量与其他理化指标的相关系数 |
| pH | 含水率 | 盐度 | 氧化还原电位 | 砂粒 | 粉粒 | 黏粒 | |
| 注:*和**分别表示在 p<0.05 和p<0.01水平上显著相关。n=78。 | |||||||
| 有效硅含量 | −0.286* | 0.174 | −0.116 | −0.018 | −0.228* | 0.211 | 0.307** |
| 0.012 | 0.162 | 0.328 | 0.877 | 0.045 | 0.064 | 0.006 | |
8 Correlation coefficients between profile soil available silicon content and other physical and chemical indexes剖面土壤有效硅含量与其他理化指标的相关系数 |
| pH | 含水率 | 盐度 | |
| 注:*和**分别表示在 p<0.05 和p<0.01水平上显著相关。n=72。 | |||
| 有效硅含量 | −0.458** | −0.140 | −0.059 |
| 0.000 | 0.240 | 0.624 | |
/
| 〈 |
|
〉 |