
1991—2020年长沙市湿地面积与生态系统服务价值的变化及其驱动力
|
李旭(1985—),男,湖南省湘阴人,高级工程师,从事湿地生态学研究。E-mail: lixu@isa.ac.cn |
收稿日期: 2024-03-12
修回日期: 2024-04-30
网络出版日期: 2026-03-12
版权
Changes of wetland area, ecosystem service value and their driving forces in Changsha City from 1991 to 2020
Received date: 2024-03-12
Revised date: 2024-04-30
Online published: 2026-03-12
Copyright
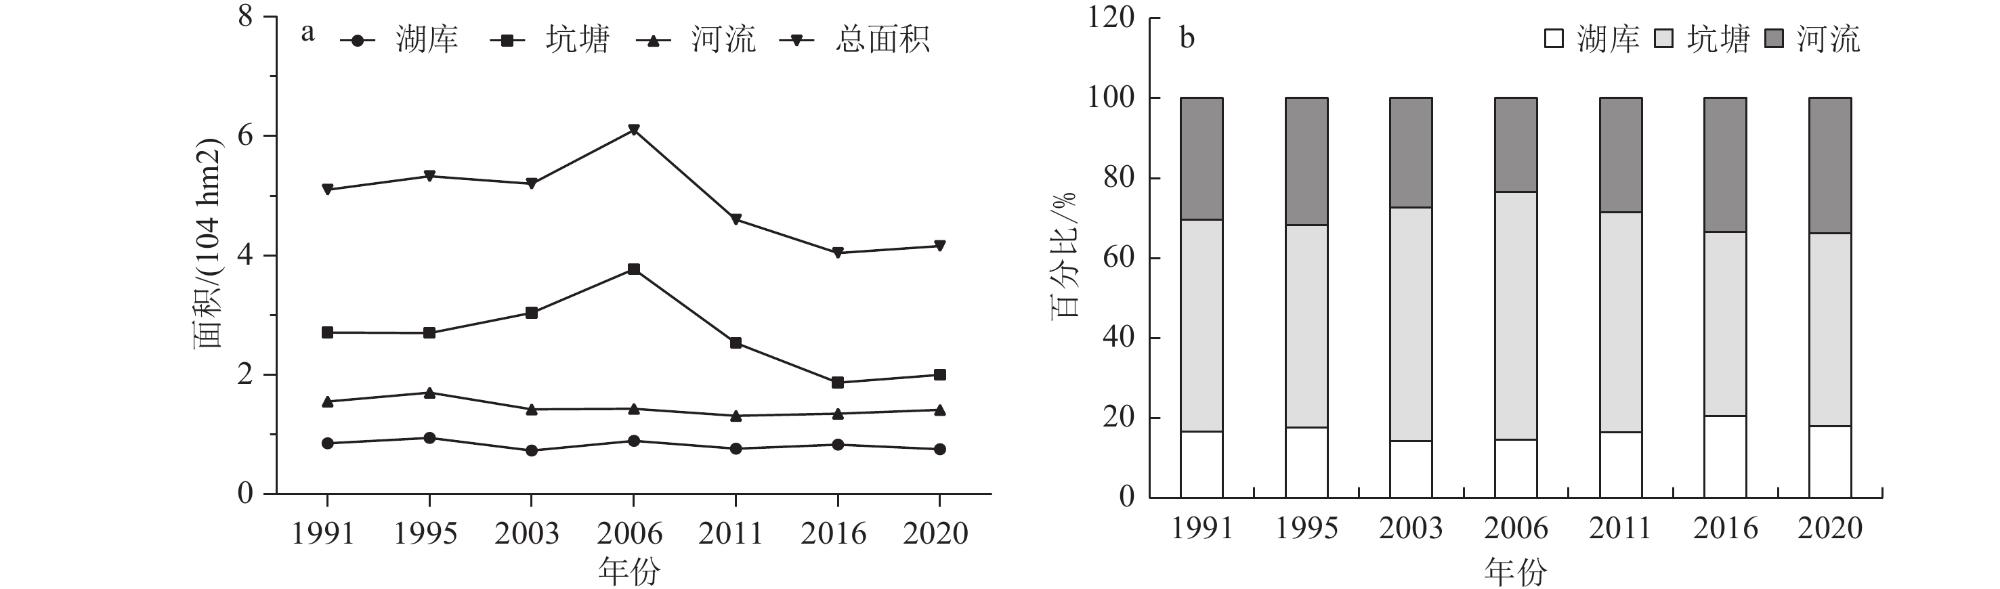
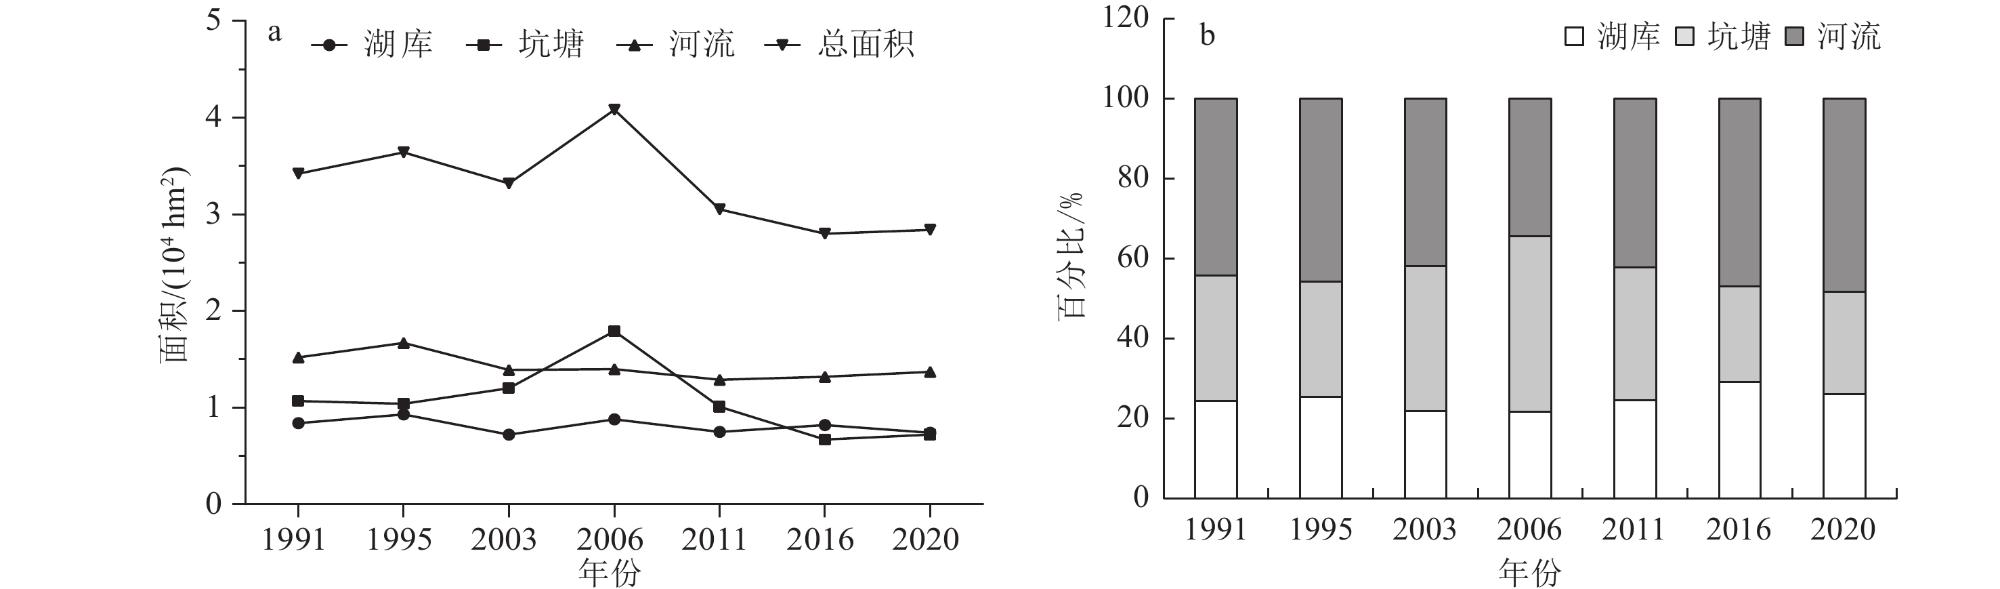
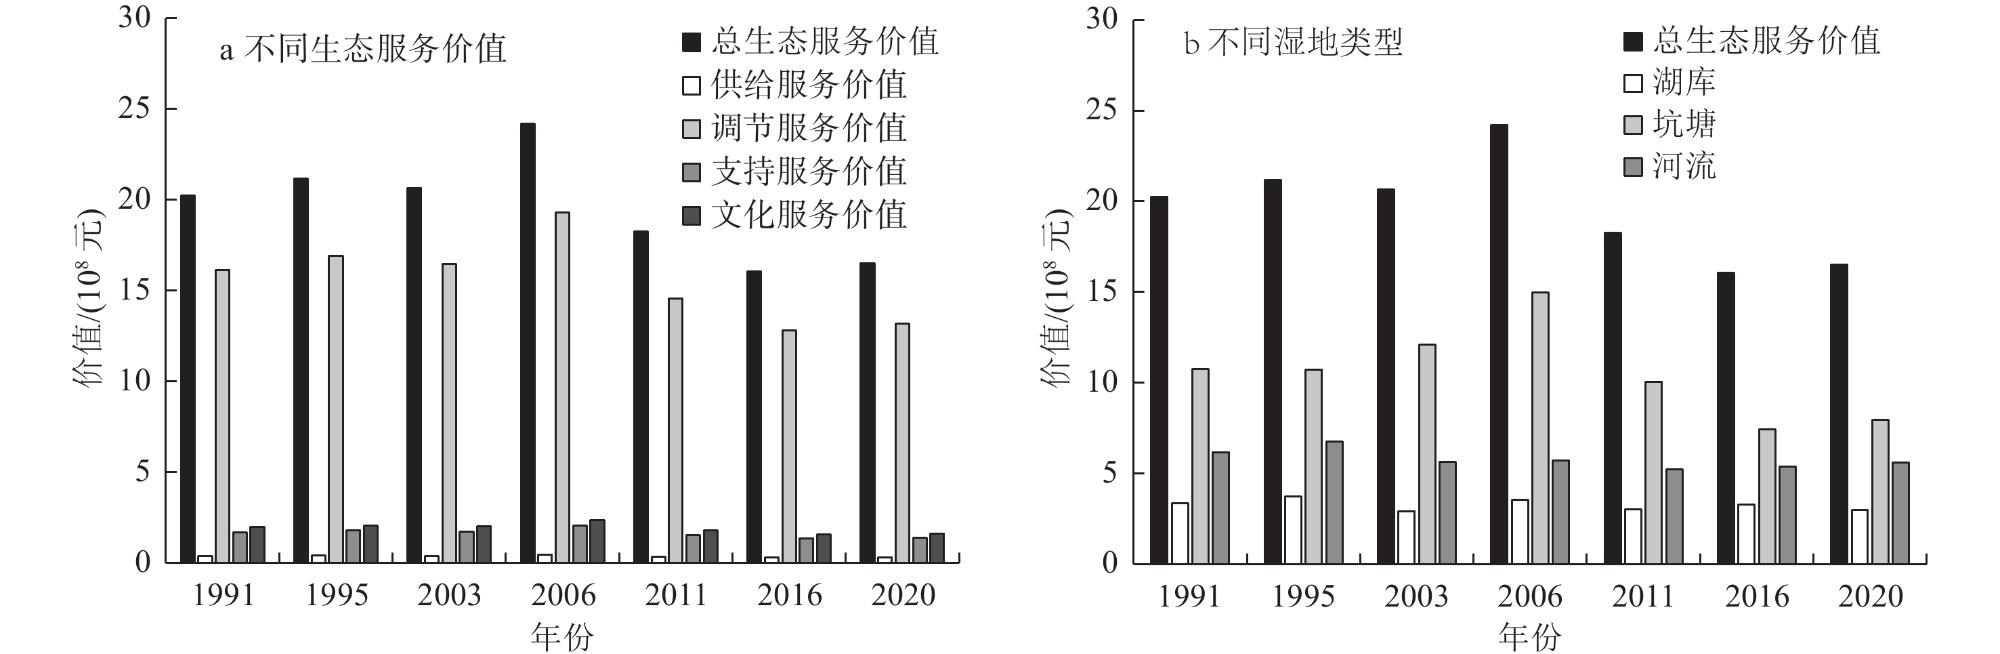
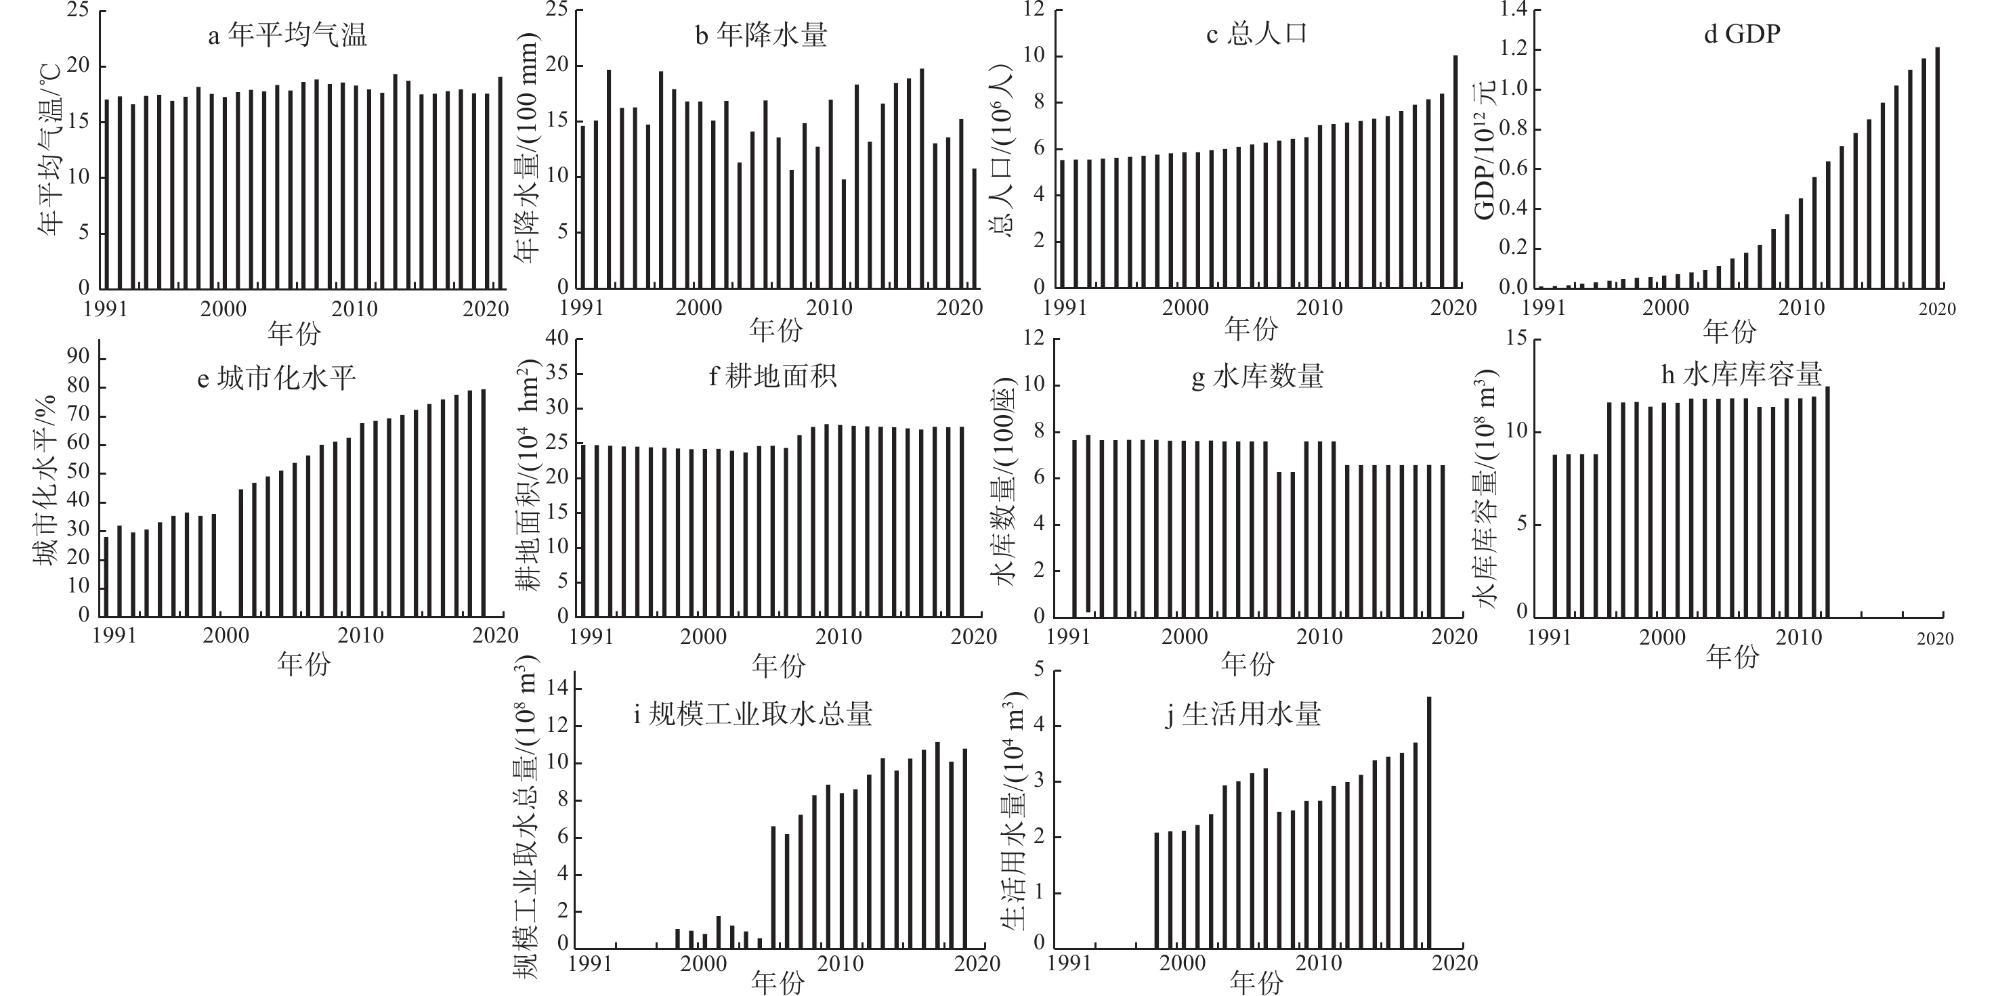
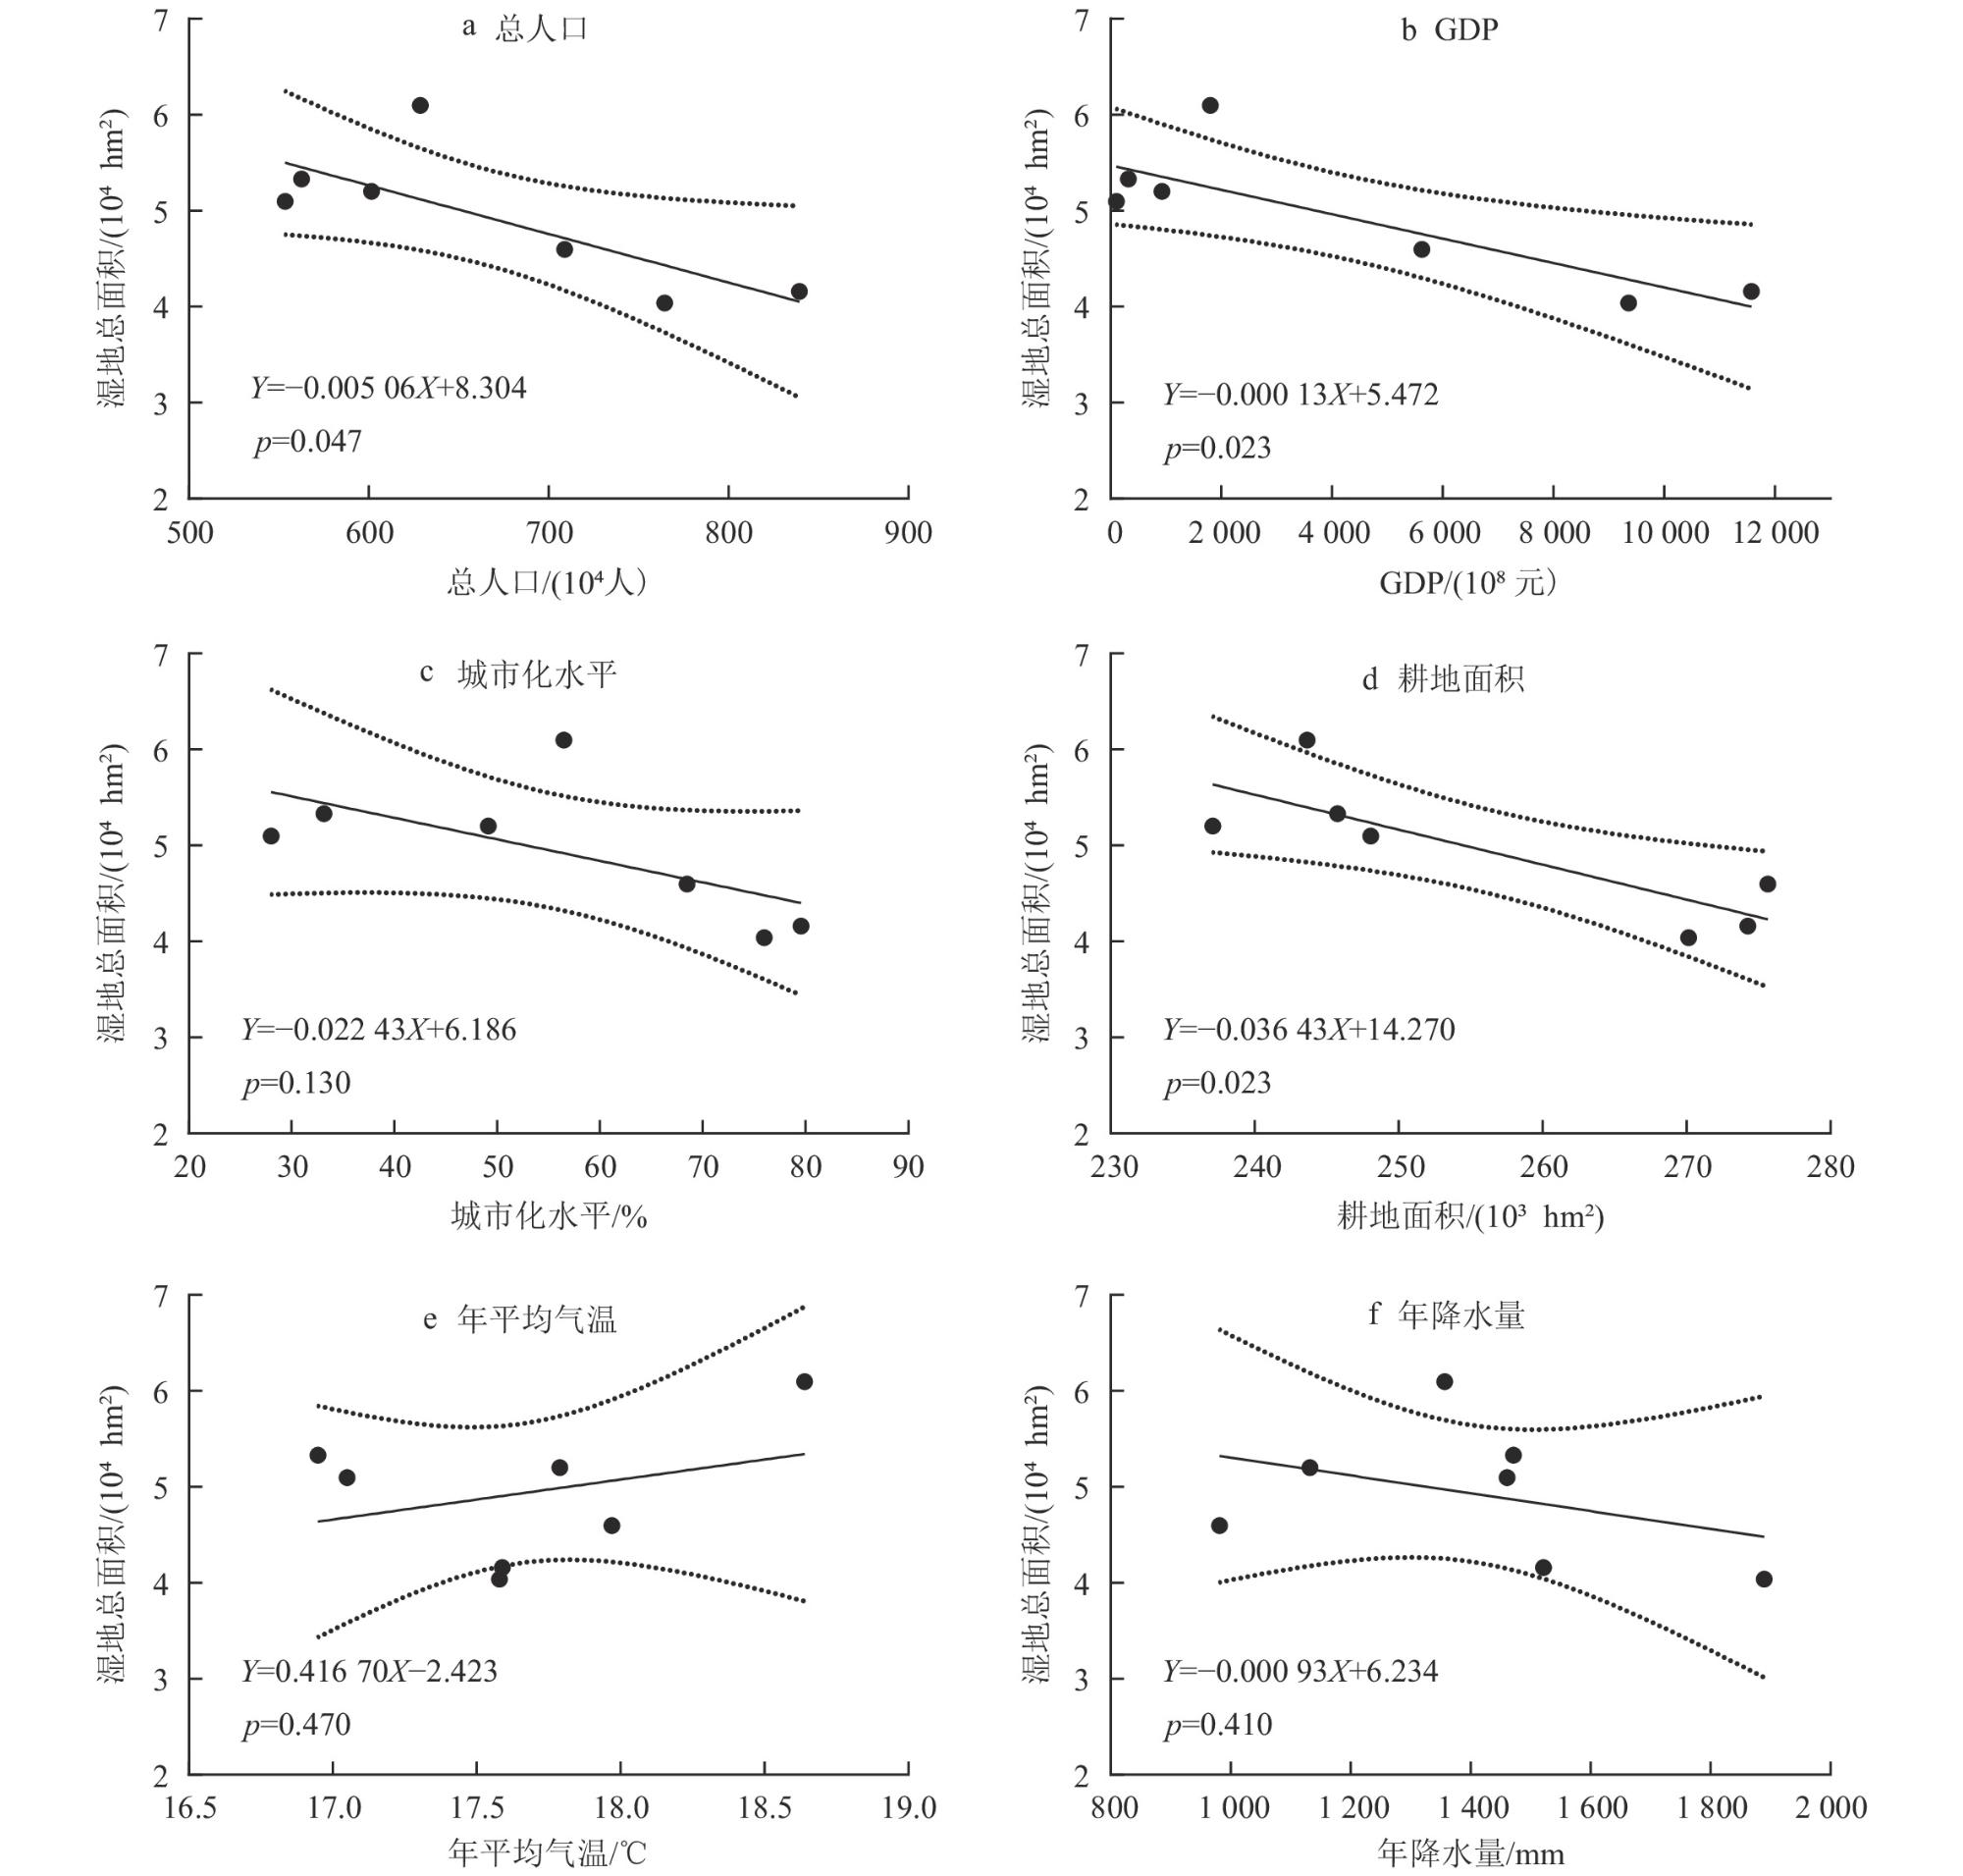
湿地面积变化是人与自然共同作用的结果,深刻影响着湿地生态系统的服务功能和可持续发展。利用1991—2020年7期Landsat卫星遥感影像和野外实测数据,并结合长沙市统计年鉴等数据,探究了长沙市近30年来湿地面积的变化,量化评估了长沙市湿地生态系统服务价值,从社会经济因素(总人口数量、GDP、城市化水平、耕地面积)和自然因素(年平均气温、年降雨量)两方面分析了湿地面积变化的原因。研究结果表明,1991—2020年长沙市湿地总面积和湿地生态系统服务价值整体呈不断下降趋势,湿地面积由1991年的5.1×10⁴ hm2下降到2020年的4.2×10⁴ hm2,主要由坑塘面积的减少所致;湿地生态系统服务价值由20.2×10⁸元下降到16.5×10⁸元,其中湿地调节服务价值最高,供给服务价值最低;从不同湿地类型来看,坑塘湿地生态系统服务价值最大,其次为河流,最低为湖库;回归分析表明,湿地总面积与总人口数量、GDP、耕地面积均呈显著负线性关系(p<0.05),长沙市湿地总面积的下降与社会经济因素密切相关。
李旭 , 邹业爱 , 李峰 , 谢永宏 , 曾静 , 侯志勇 . 1991—2020年长沙市湿地面积与生态系统服务价值的变化及其驱动力[J]. 湿地科学, 2025 , 23(3) : 435 -446 . DOI: 10.13248/j.cnki.wetlandsci.20240068
Wetland transformations emerge from complex human-natural interactions, exerting a profound influence on wetland ecosystem service values and regional sustainability. This investigation employed multi-temporal Landsat imagery (7 epochs) and field datasets from 1991 to 2020, supplemented with socioeconomic records from the Changsha City Statistical Yearbook, to analyze wetland area changes and quantify ecosystem service values (ESVs). The study systematically examined drivers of area changes through integrated analysis of socioeconomic indicators (population growth, GDP expansion, urbanization rate, agricultural land use) and environmental parameters (mean annual temperature, precipitation patterns). Key findings revealed persistent declines in both wetland extent and associated ESVs over three decades. Total wetland area decreased by 17.6% (51 000 to 42 000 hm2), predominantly through pond wetland conversion. Concurrently, ESVs declined by 18.3% (2.02 to 1.65 billion Yuan), with regulatory services constituting the largest contribution and provisioning services the smallest. Among wetland types, pond wetland demonstrated the highest service value, followed by riverine wetland, with lake-reservoir wetland exhibiting the lowest valuation. Regression analysis identified significant negative correlations (p<0.05) between total wetland area and key socioeconomic drivers (population density, GDP growth, and agricultural expansion). These relationships highlight the dominant role of anthropogenic pressures over natural climatic factors in wetland transformations, particularly the conversion of peri-urban wetland ecosystems to meet demands for urban expansion and agricultural development.
1 Equivalent and value of ecological services per unit area of wetlands in Changsha City长沙市湿地单位面积生态服务价值当量和价值 |
| 生态系统服务功能 | 单位面积生态服务价值当量 | 单位面积生态服务价值/[元/(hm2·a)] | |
| 一级类型 | 二级类型 | ||
| 供给功能 | 食物生产 | 0.53 | 464.14 |
| 原材料生产 | 0.35 | 306.51 | |
| 调节功能 | 气体调节 | 0.51 | 446.63 |
| 气候调节 | 2.06 | 1 804.03 | |
| 水文调节 | 18.77 | 16 437.73 | |
| 废物处理 | 14.85 | 13 004.81 | |
| 支持功能 | 保持土壤 | 0.41 | 359.06 |
| 维持生物多样性 | 3.43 | 3 003.81 | |
| 文化功能 | 提供美学景观 | 4.44 | 3 888.31 |
| 合计 | 45.35 | 39 715.04 | |
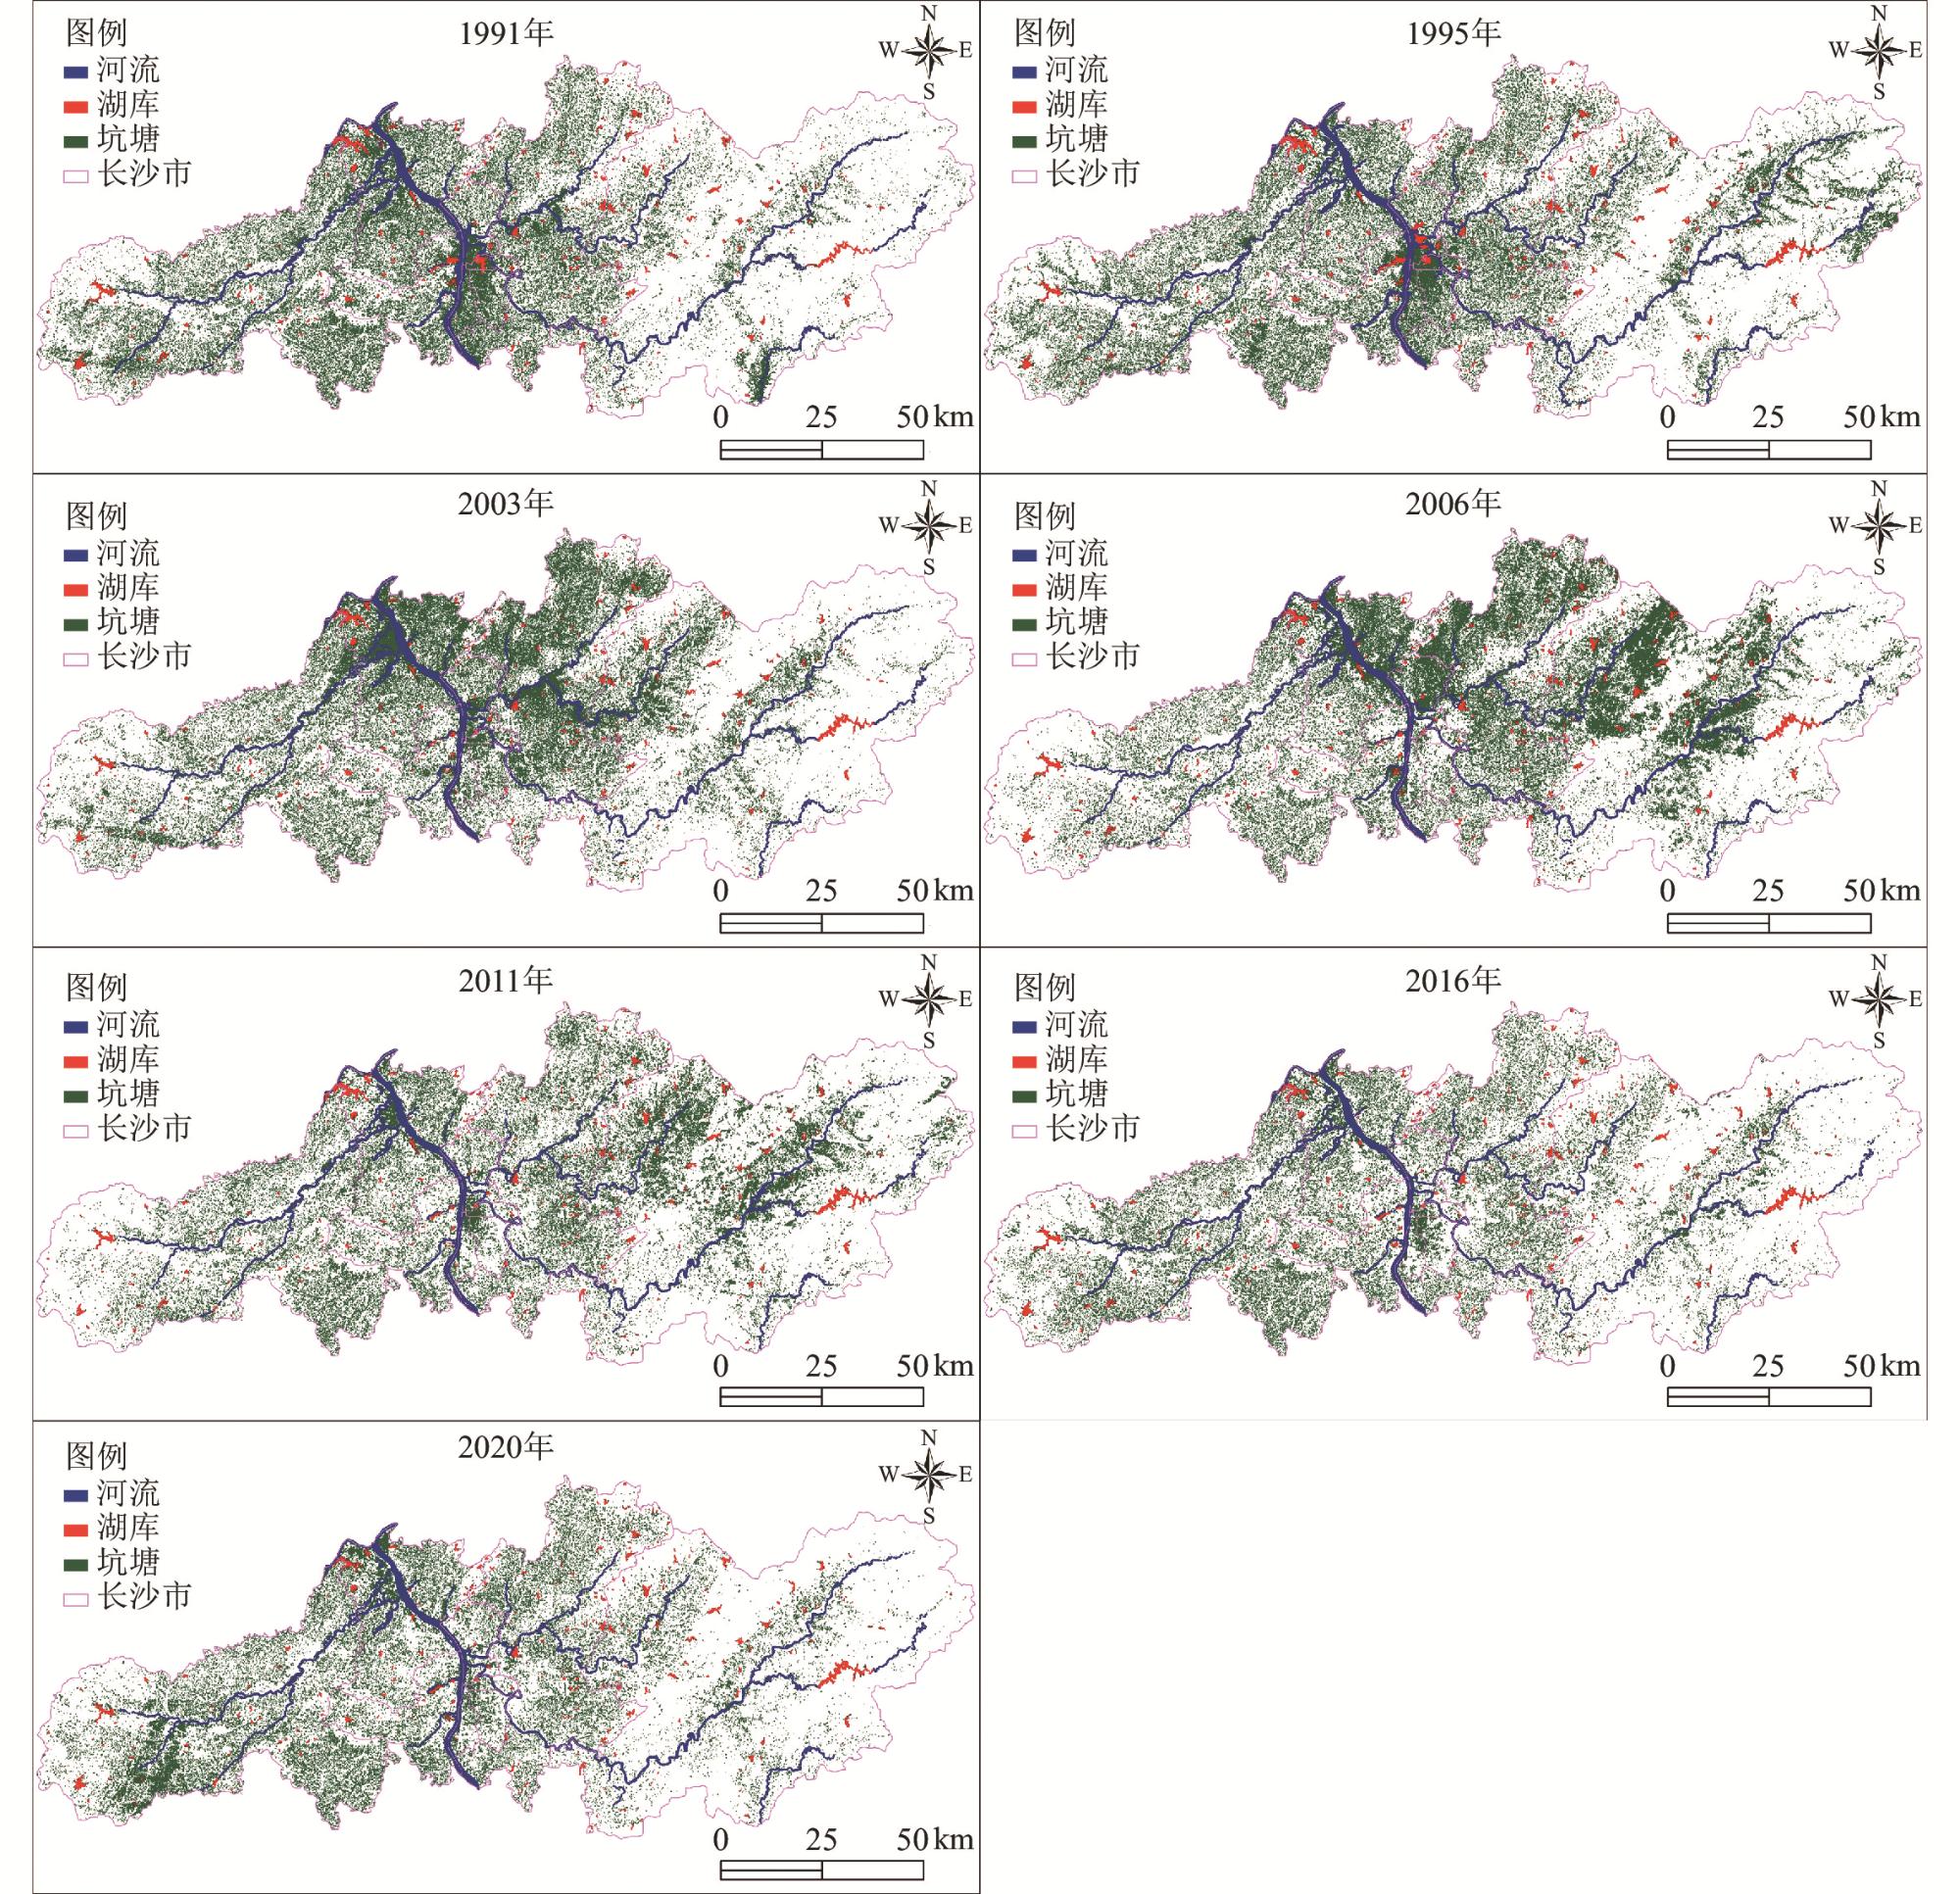
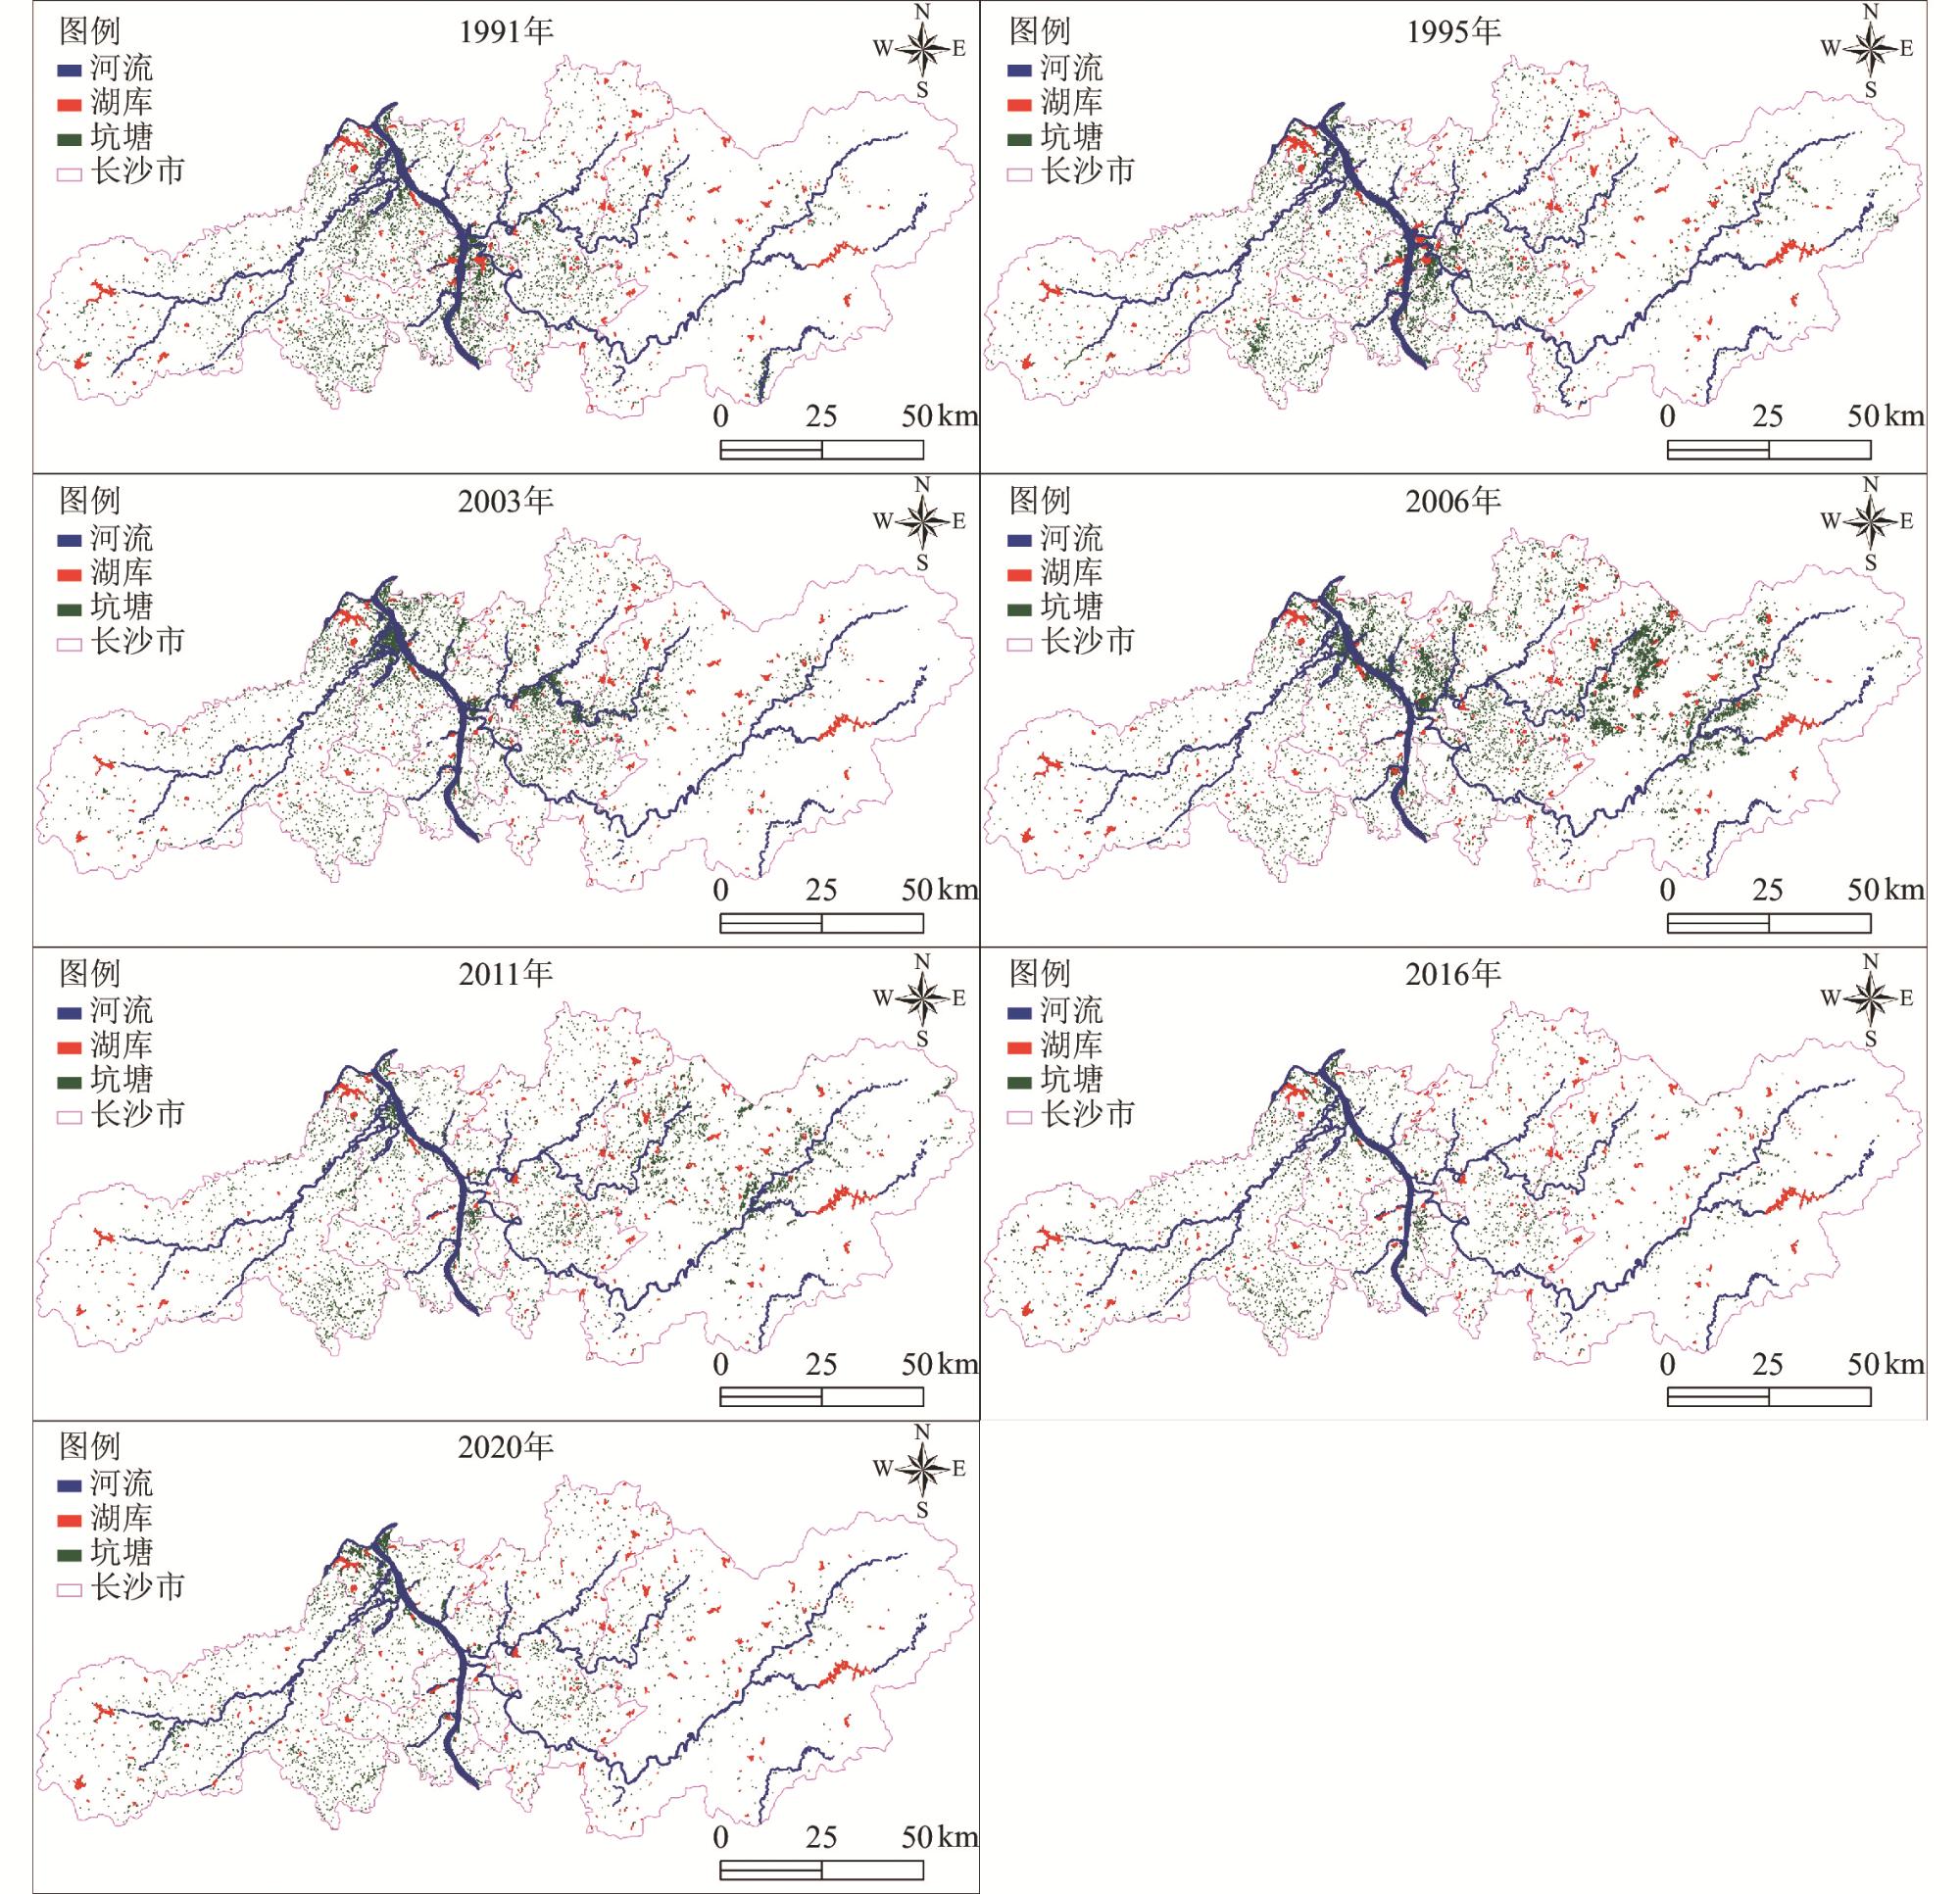
3 Spatial distribution of different types of wetlands larger than 1 hm2 in Changsha City from 1991 to 20201991—2020年长沙市>1 hm2的各类型湿地的空间分布 |
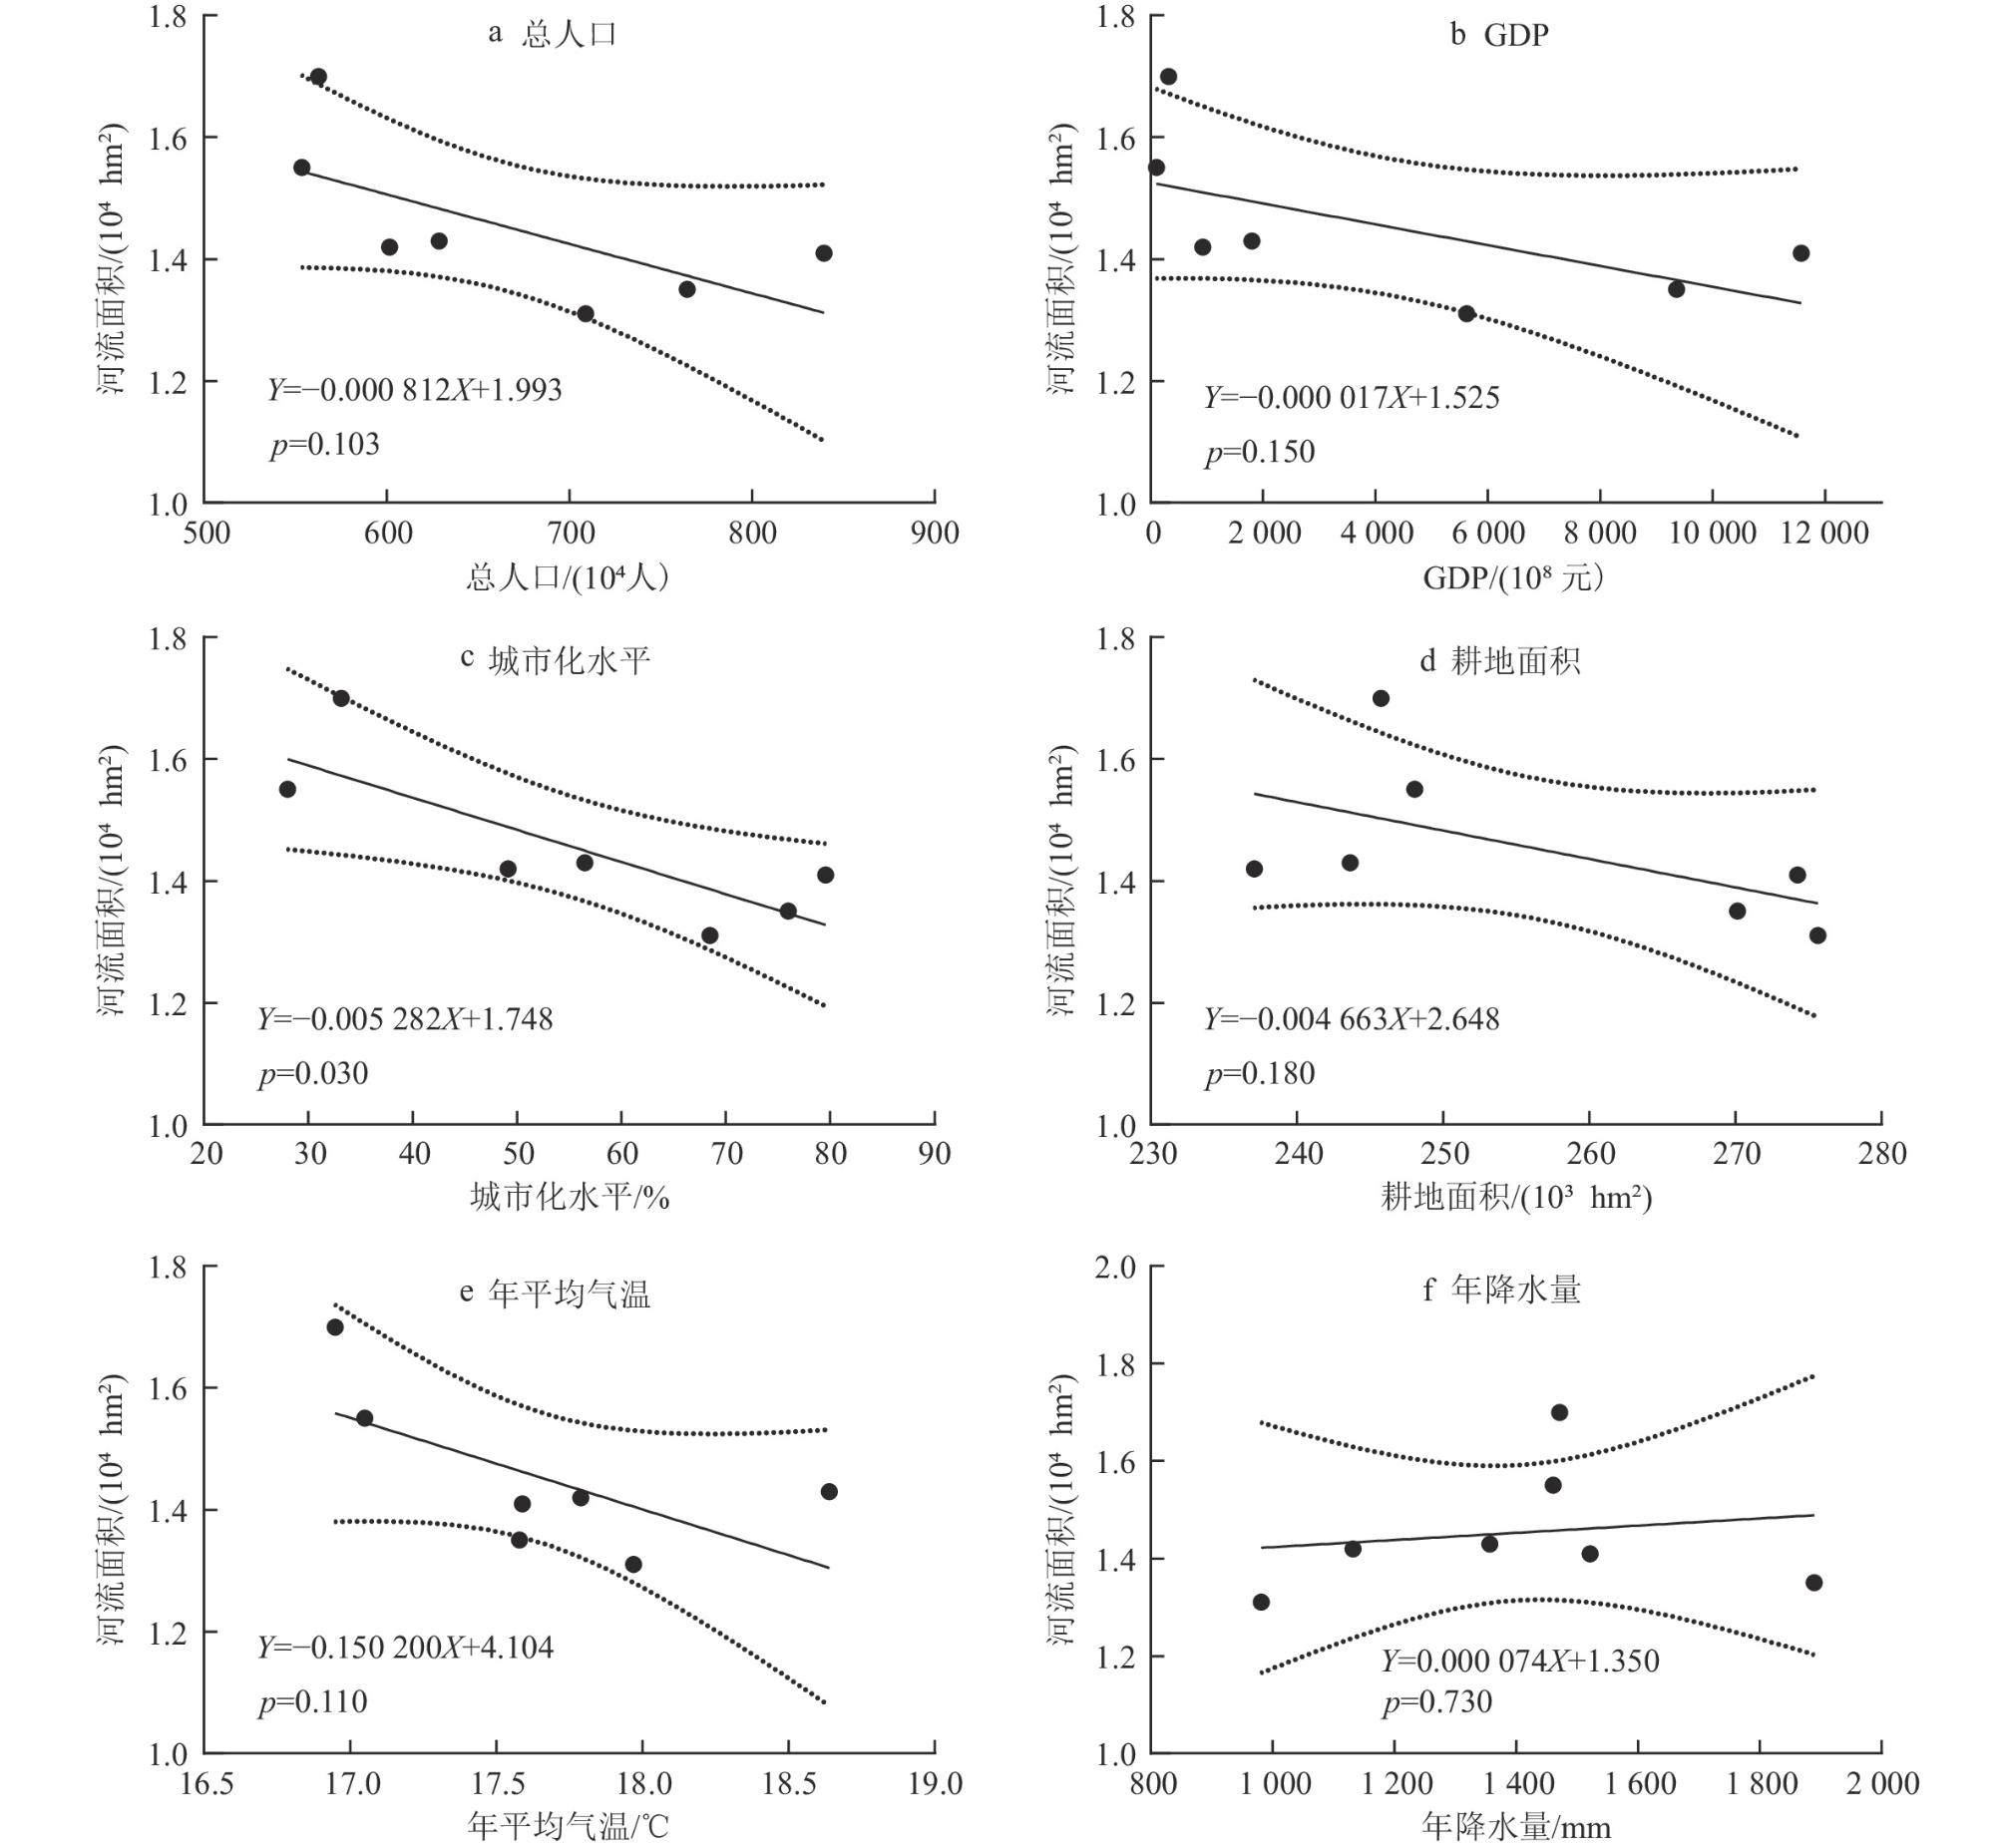
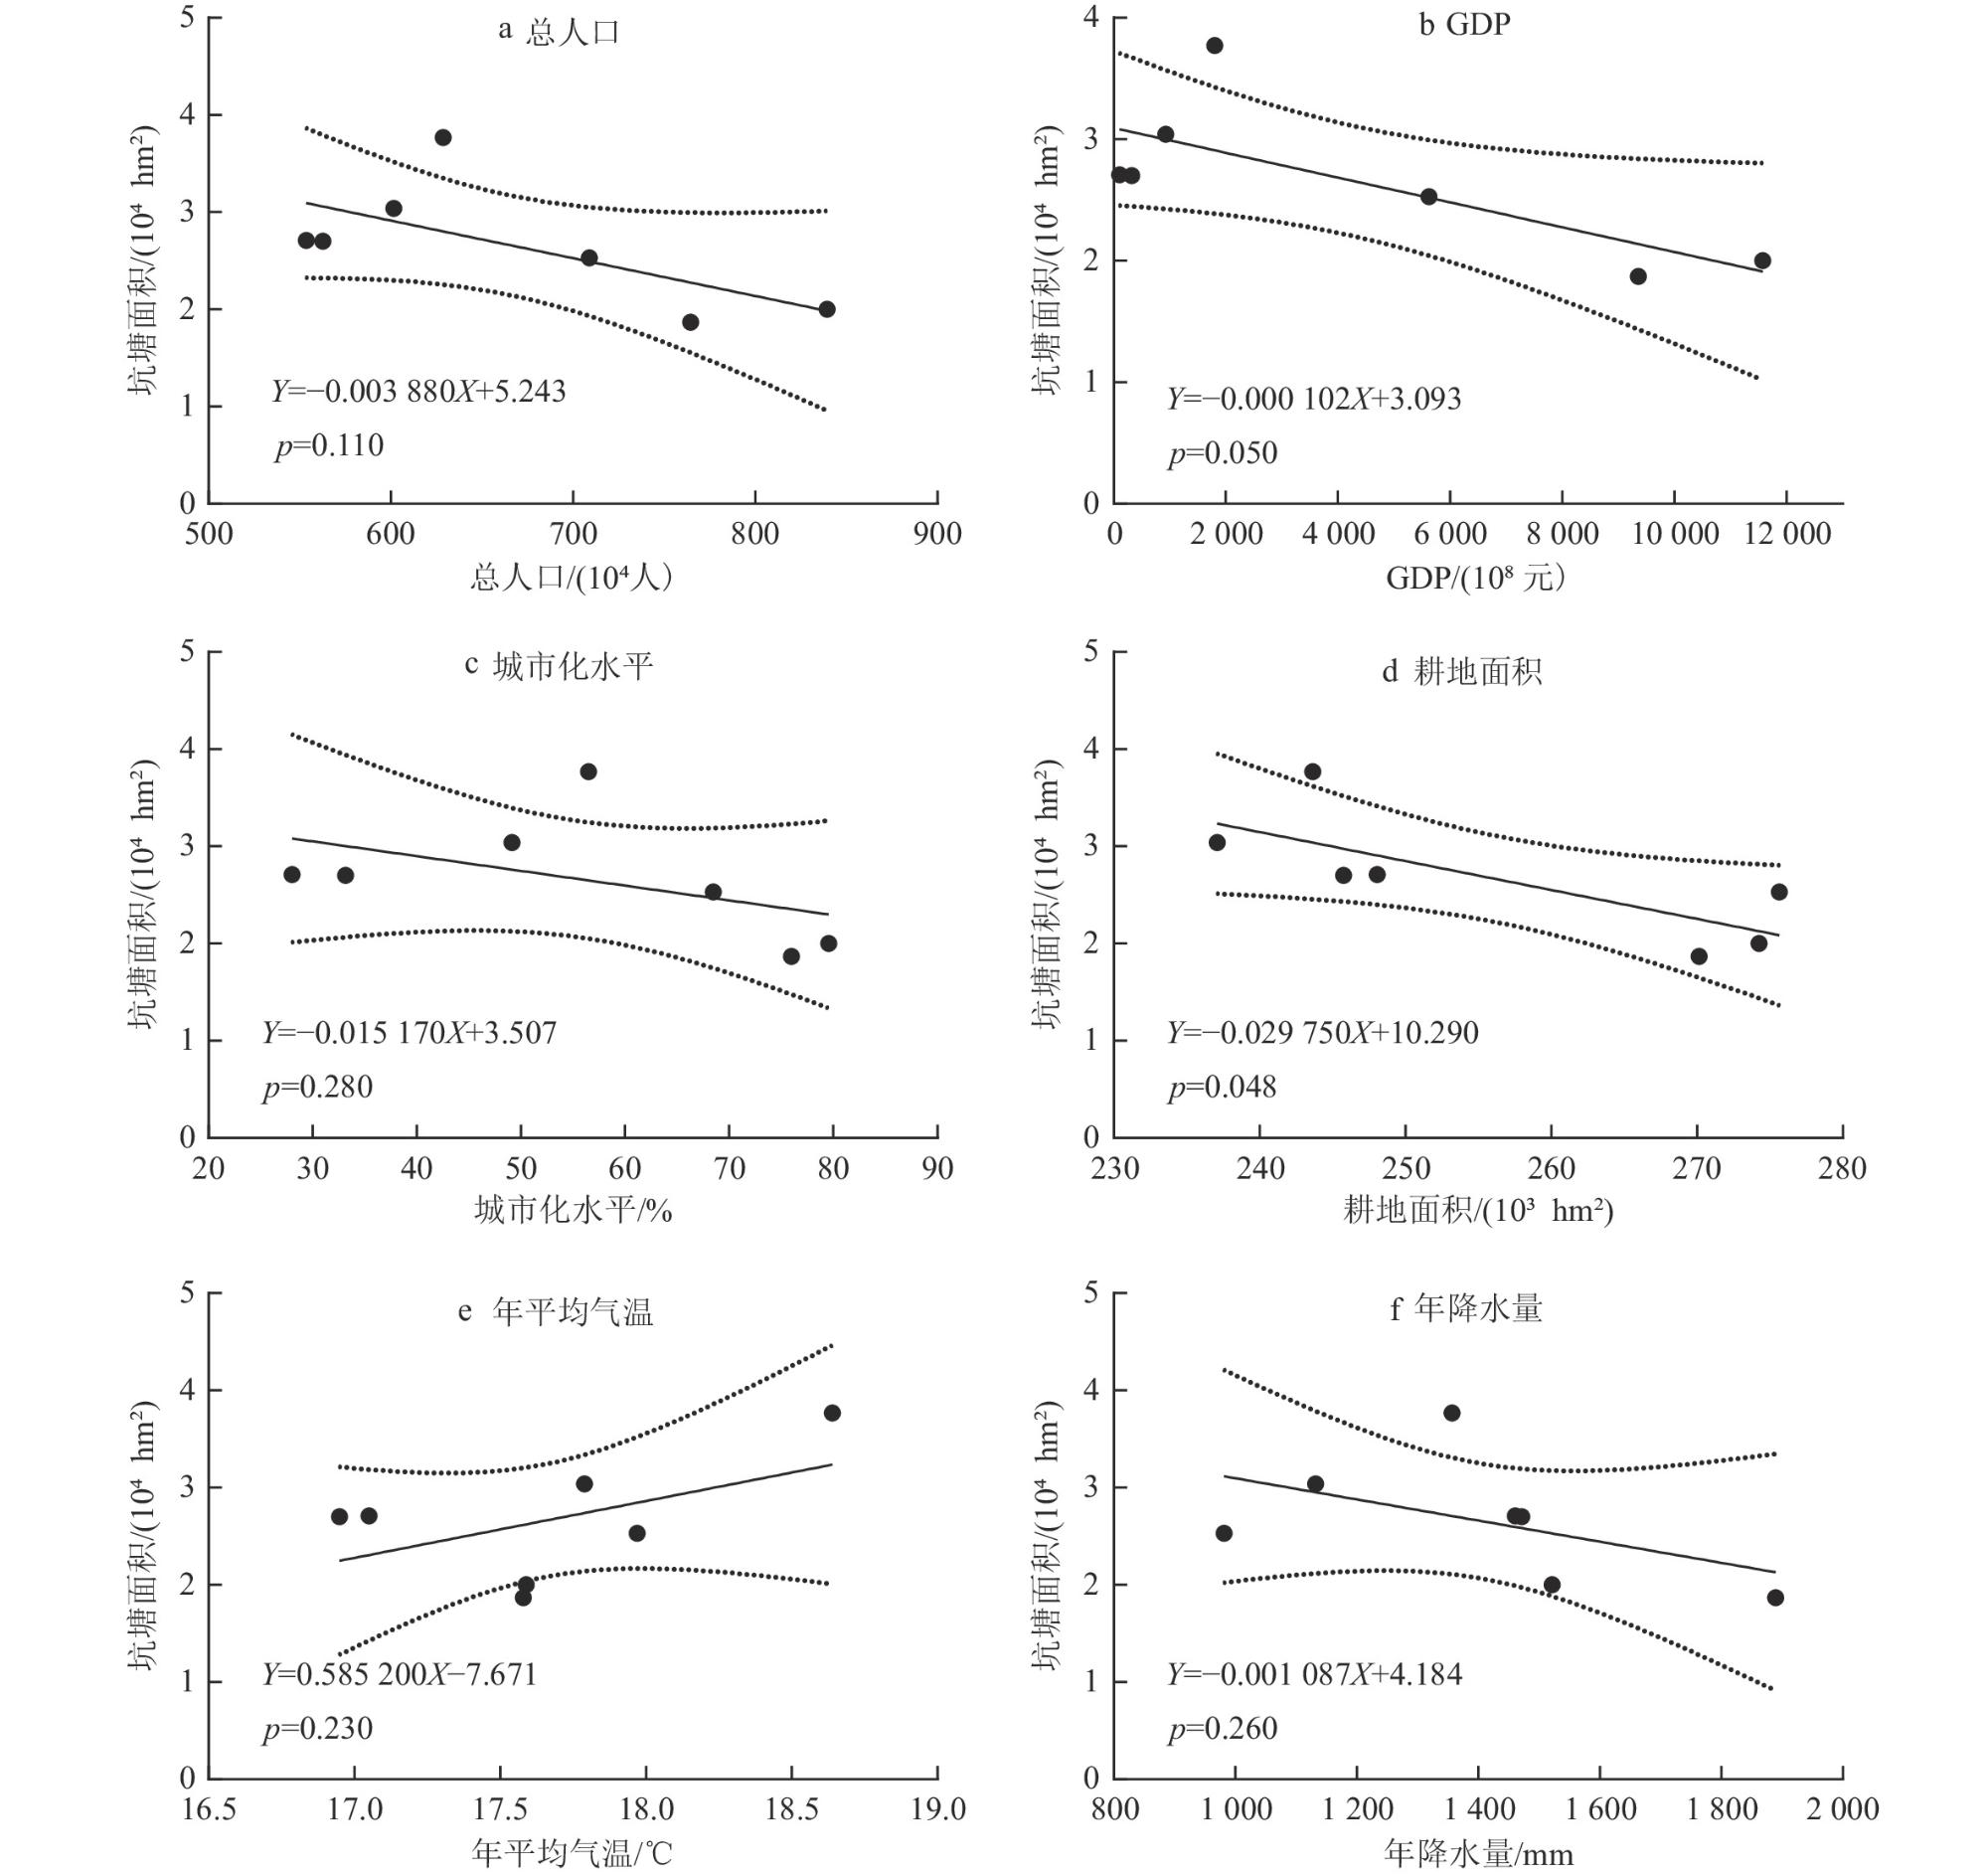
8 Regression analysis results of riverine wetland area in Changsha City with socio-economic factors (a, b, c, d) and natural factors (e, f)长沙市河流湿地面积与社会经济因素(a、b、c、d)和自然因素(e、f)的回归分析结果 |
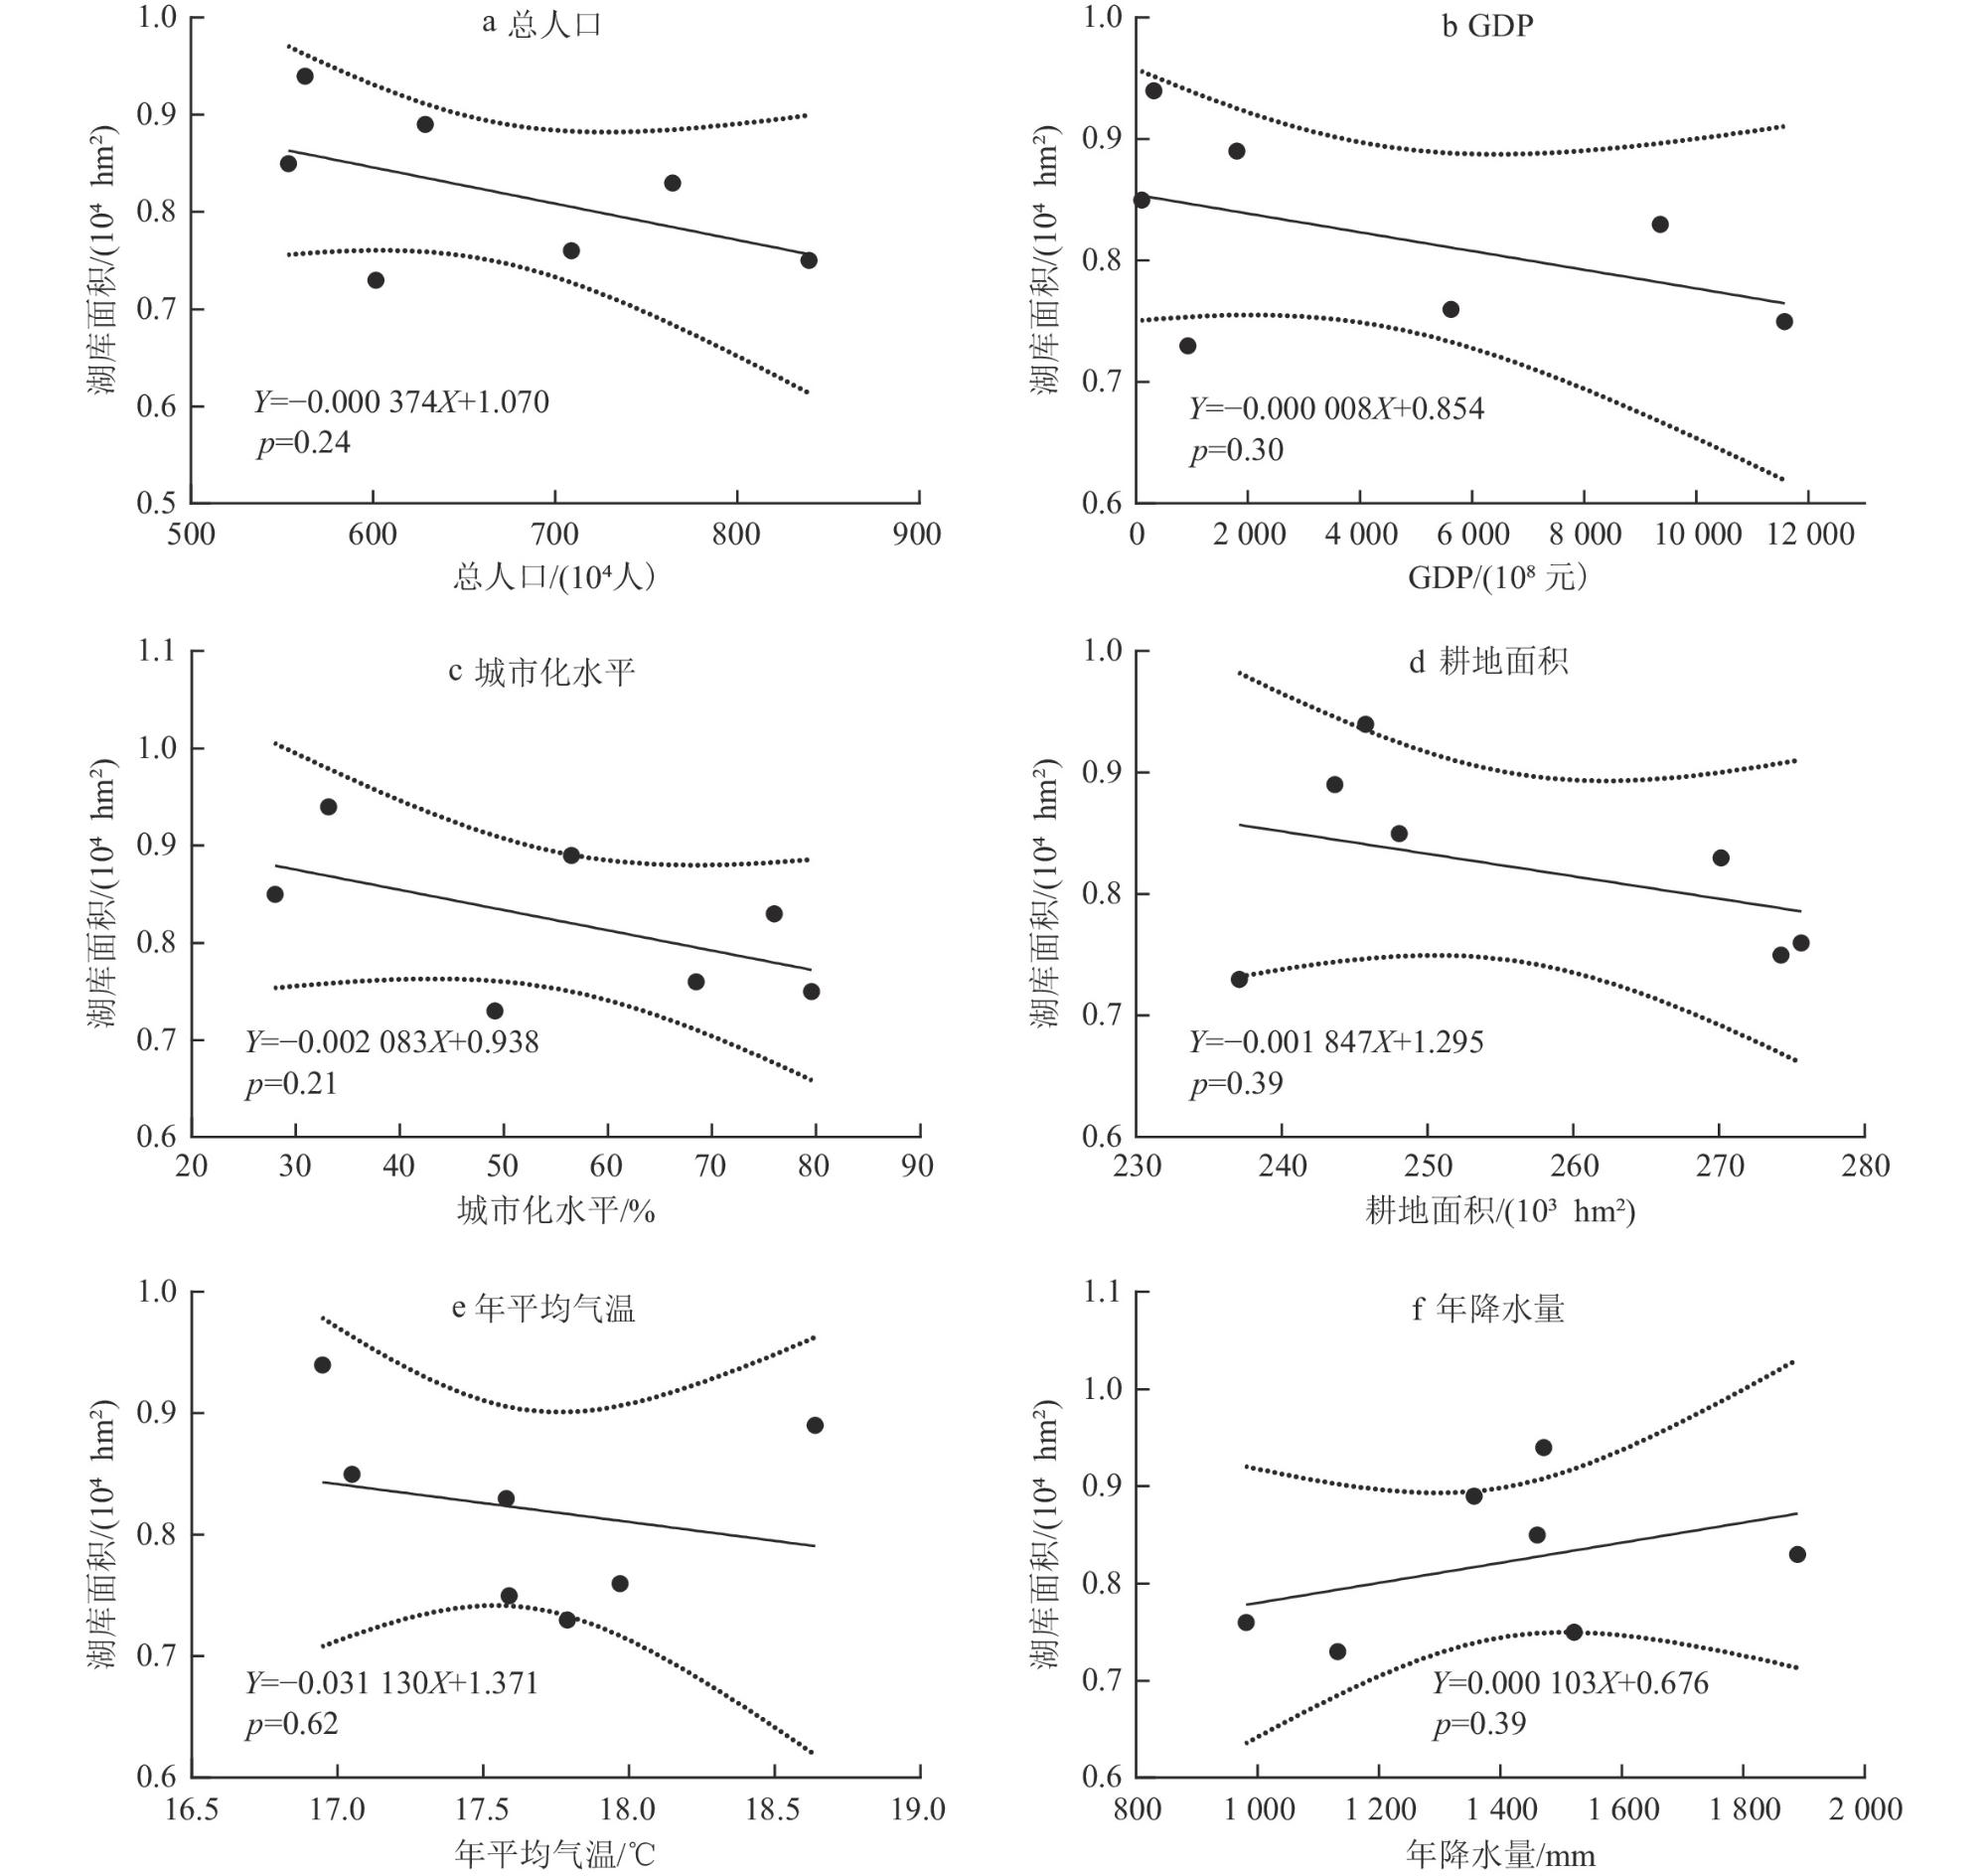
9 Regression analysis results of lake-reservoir wetland area in Changsha City with socio-economic factors (a, b, c, d) and natural factors (e, f)长沙市湖库湿地面积与社会经济因素(a、b、c、d)和自然因素(e、f)的回归分析结果 |
/
| 〈 |
|
〉 |