
香港米埔红树林湿地土壤温室气体排放的时空变化特征
|
许加星(1987—),女,山东省潍坊人,博士,讲师,从事湿地生态水文过程研究。E-mail: xujiaxing1987@163.com |
收稿日期: 2024-02-05
修回日期: 2024-04-03
网络出版日期: 2026-03-12
版权
Spatial and temporal variations of soil greenhouse gas emissions in the Mai Po mangrove wetland of Hong Kong
Received date: 2024-02-05
Revised date: 2024-04-03
Online published: 2026-03-12
Copyright
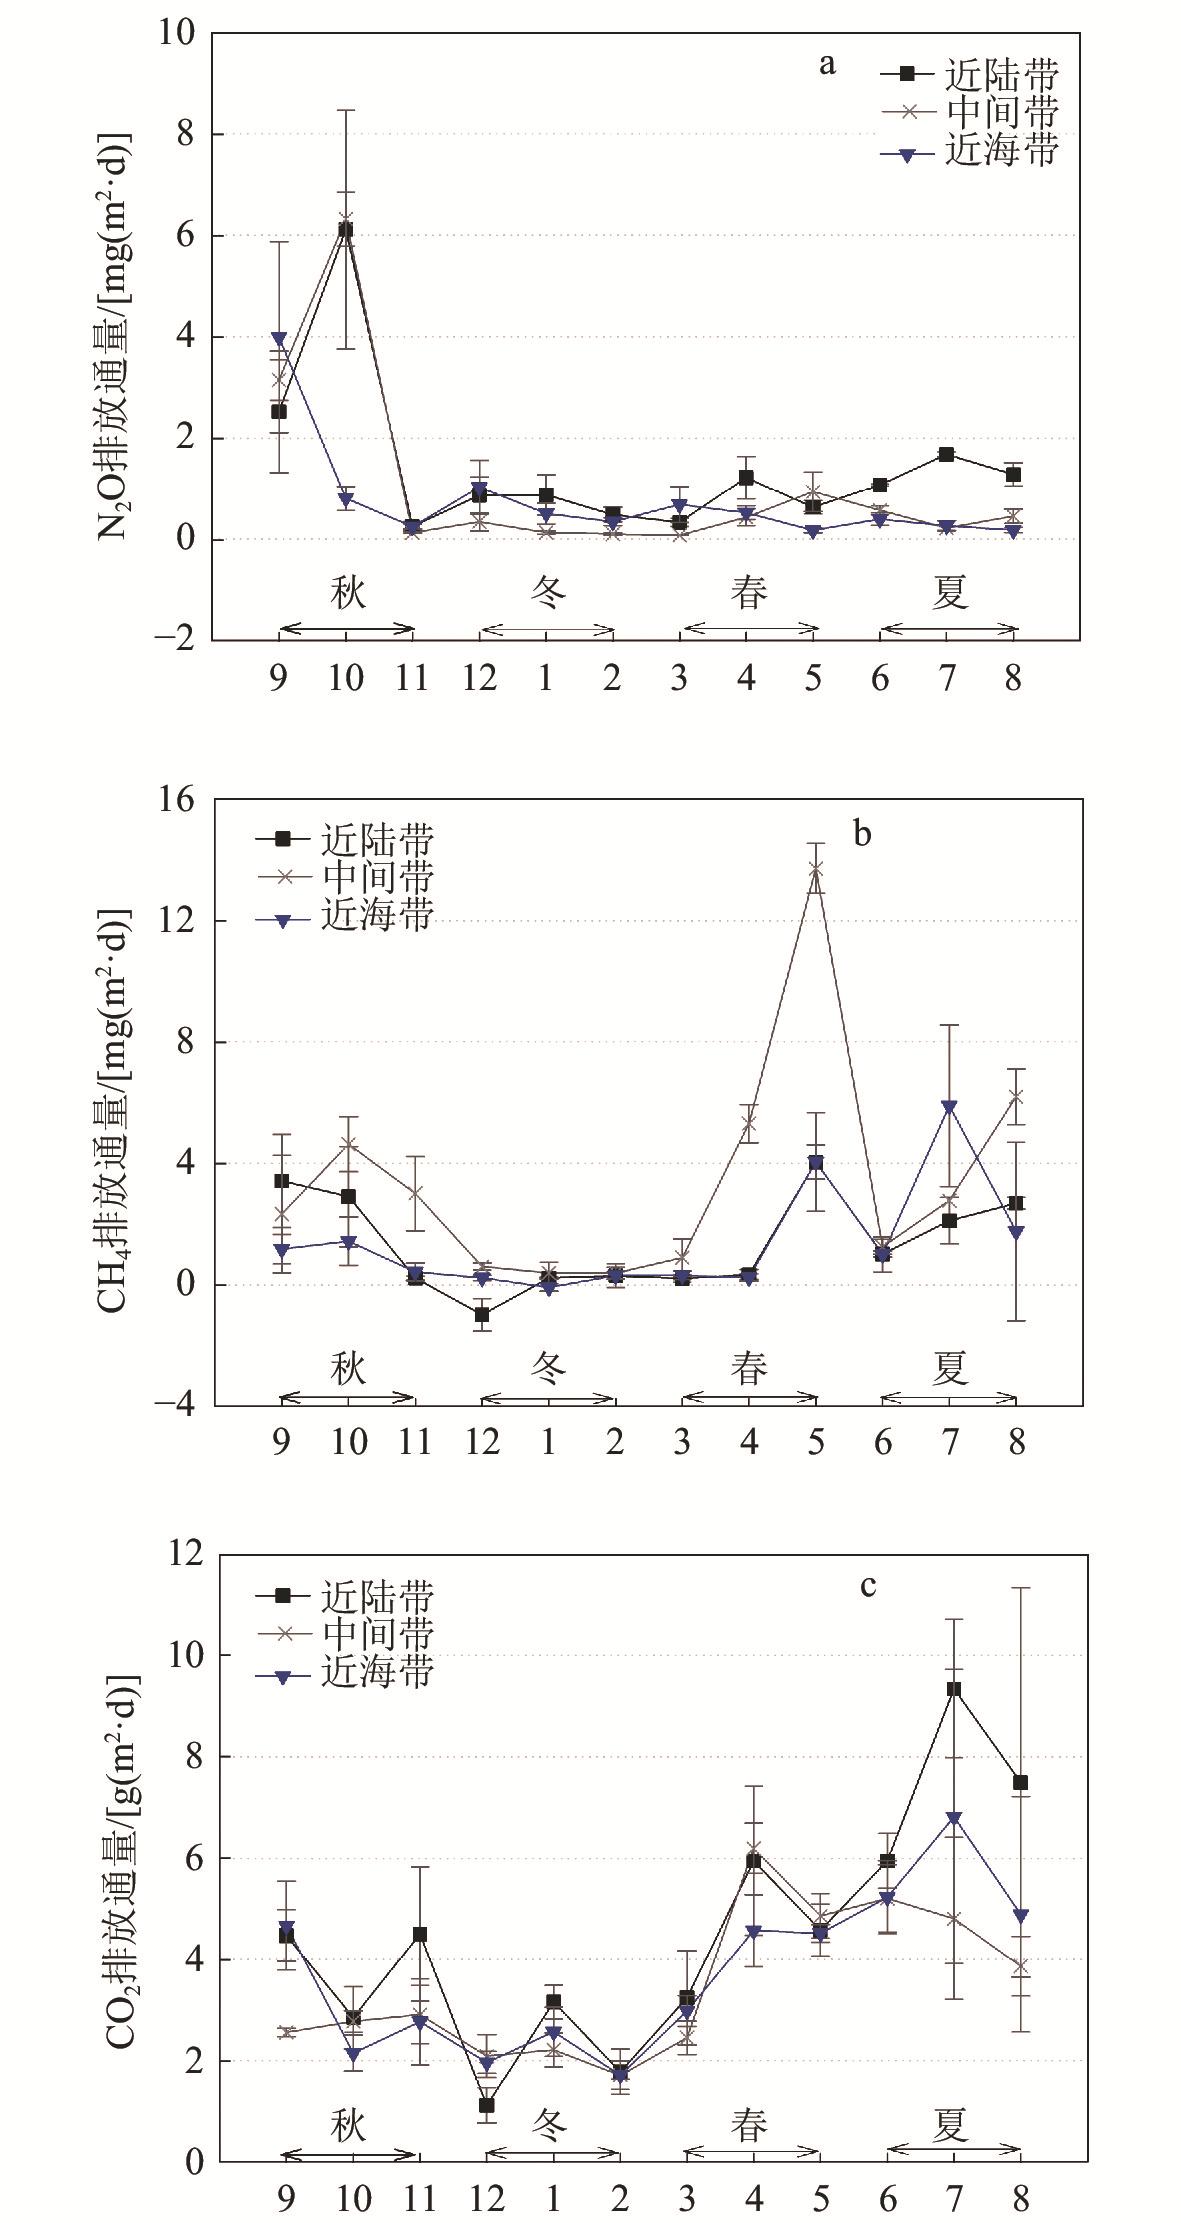
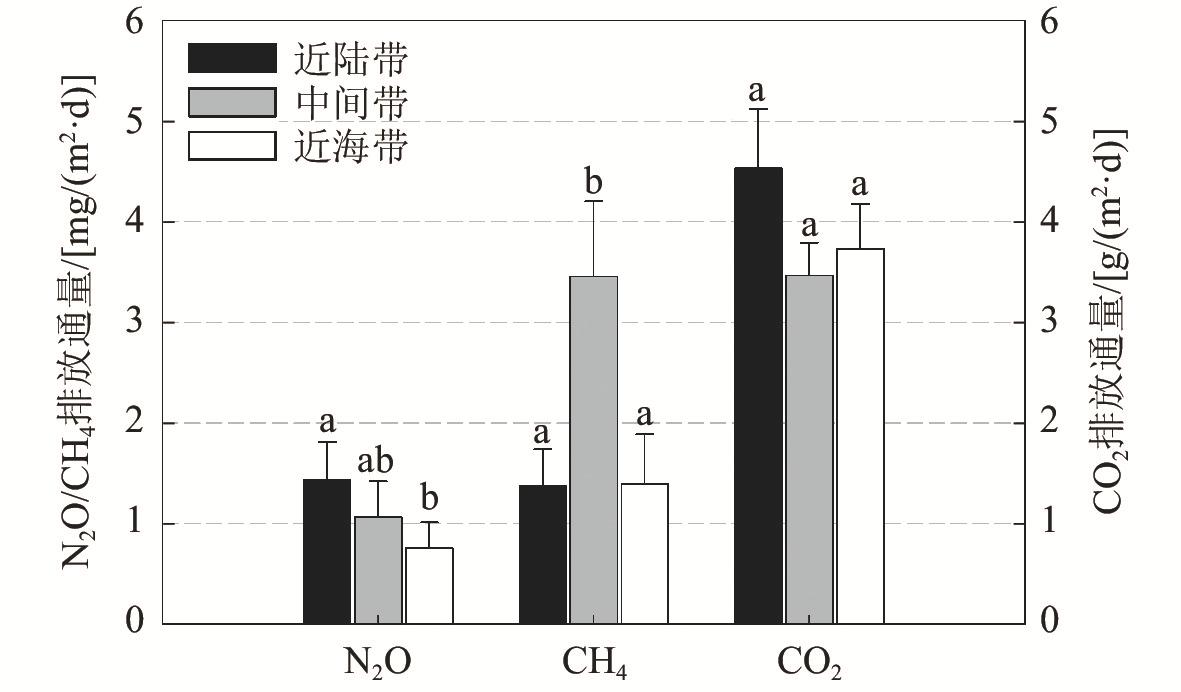
红树林湿地被视为热带和亚热带地区最富含碳的湿地之一,但由于受到潮水频繁淹没以及周围地区大量营养物质输入的影响,红树林湿地成为甲烷(CH4)、一氧化二氮(N2O)等温室气体的潜在排放源。为了揭示红树林湿地土壤温室气体排放的时空变异性及其环境影响因子,在香港米埔红树林湿地开展了为期1 a的月尺度野外监测。结果表明,近陆带、中间带和近海带的红树林湿地土壤平均CO2通量差异不显著,而CH4通量在中间带明显较高,主要由于厌氧环境促进了CH4生成,土壤N2O通量平均值则在近陆带显著较高,可能因为近陆带土壤中较高的有机物含量刺激了硝酸盐供应及反硝化作用。红树林湿地土壤温室气体排放在不同季节差异显著,冬季CH4排放显著较低,这是由于低温和高盐度抑制了CH4产生;夏季土壤CO2排放通量显著高于其他季节,而冬季显著低于其他季节,主要与土壤温度和有机物含量的变化对微生物活动的影响有关。此外,土壤温室气体排放通量还存在显著的年内变异性,月平均CH4和N2O通量的相对标准偏差均超过115%,红树林湿地土壤温室气体排放具有较高的时空变异性。研究结果可为准确评估红树林在未来气候变化中的作用提供参考。
许加星 , 罗明汉 , 程俊翔 . 香港米埔红树林湿地土壤温室气体排放的时空变化特征[J]. 湿地科学, 2025 , 23(1) : 108 -121 . DOI: 10.13248/j.cnki.wetlandsci.20240041
While mangroves are regarded as one of the most carbon-rich forests in the tropical and subtropical regions, their soils could at the same time be potential net sources of greenhouse gases (GHGs) such as methane (CH4) and nitrous oxide (N2O) owing to frequent flooding by tidal water and considerable nutrient inputs from upland areas. In this study, we characterized the spatial and temporal variabilities, as well as the environmental and biotic controls, of soil GHGs emissions from a subtropical mangrove in Hong Kong through intensive field measurements at monthly intervals over one full year. The average soil CO2 flux was not significantly different among the three tidal positions of the mangrove (from far to near along the direction perpendicular to the coastline), while that of CH4 was significantly higher in the middle zone owing to a more anaerobic environment for methanogenesis. A significantly higher mean soil N2O flux was observed in the landward zone, probably because of the greater organic matter content in soils that stimulated nitrate supply and denitrification. Significant seasonal variations in soil GHGs emissions were also detected in this mangrove, with significantly lower CH4 flux in winter in response to the low temperature and high salinity that suppressed CH4 production, as well as significantly higher and lower CO2 emissions in the summer and winter, respectively, owing to differences in soil temperature and organic matter content that governed microbial activities. Significantly higher mean N2O flux was found in the middle zone in autumn than the other three seasons, which could be related to the greater supply of soil available nitrogen for N2O production. Furthermore, we noted significant intra-annual variability of soil GHGs fluxes, with the relative standard deviations of both monthly CH4 and N2O fluxes being over 115%. Our findings highlight the need of taking into consideration the high spatial and temporal variability of soil GHGs fluxes in order to have an accurate assessment of the role of mangroves in future climate change.
1 Spatial and seasonal variations of environmental factors and soil nutrients in Mai Po mangrove wetland, Hong Kong香港米埔红树林湿地环境因子和土壤养分的空间和季节差异 |
| 近陆带 | 中间带 | 近海带 | 春季 | 夏季 | 秋季 | 冬季 | |
| 注:数据为平均值±标准误差;同一行不同字母表示在不同空间位置或不同季节之间差异显著(p<0.05)。 | |||||||
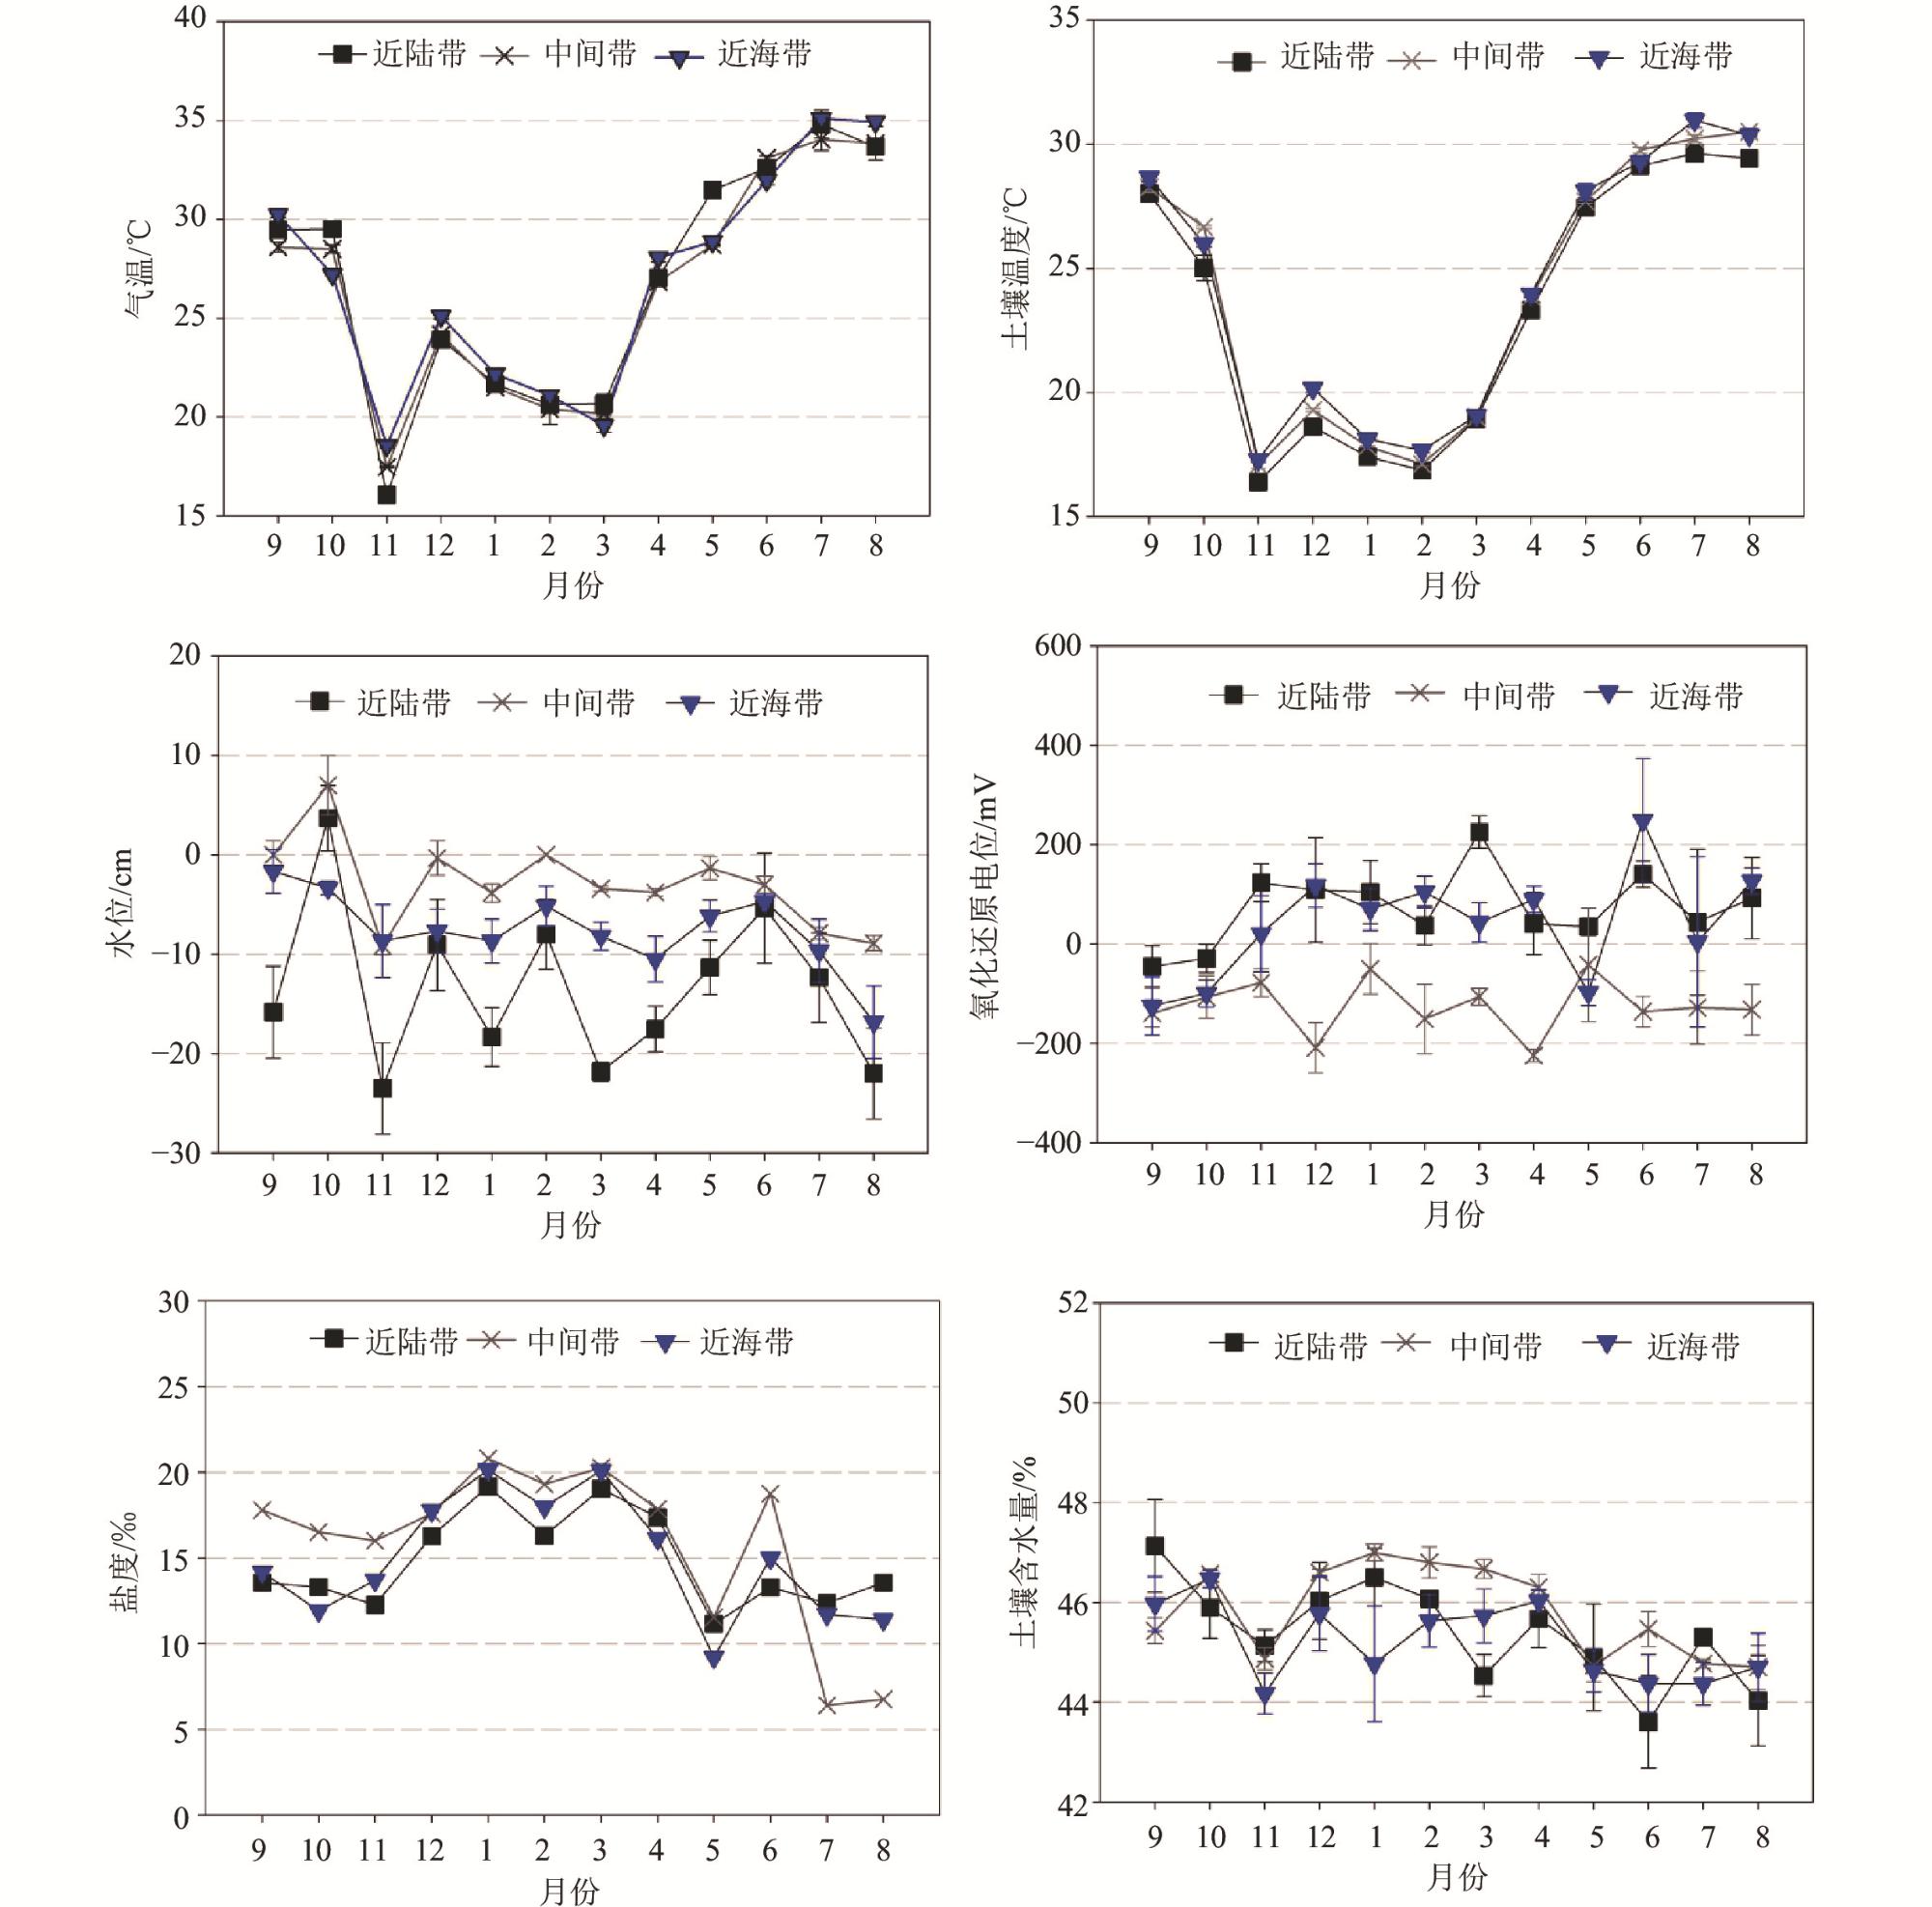
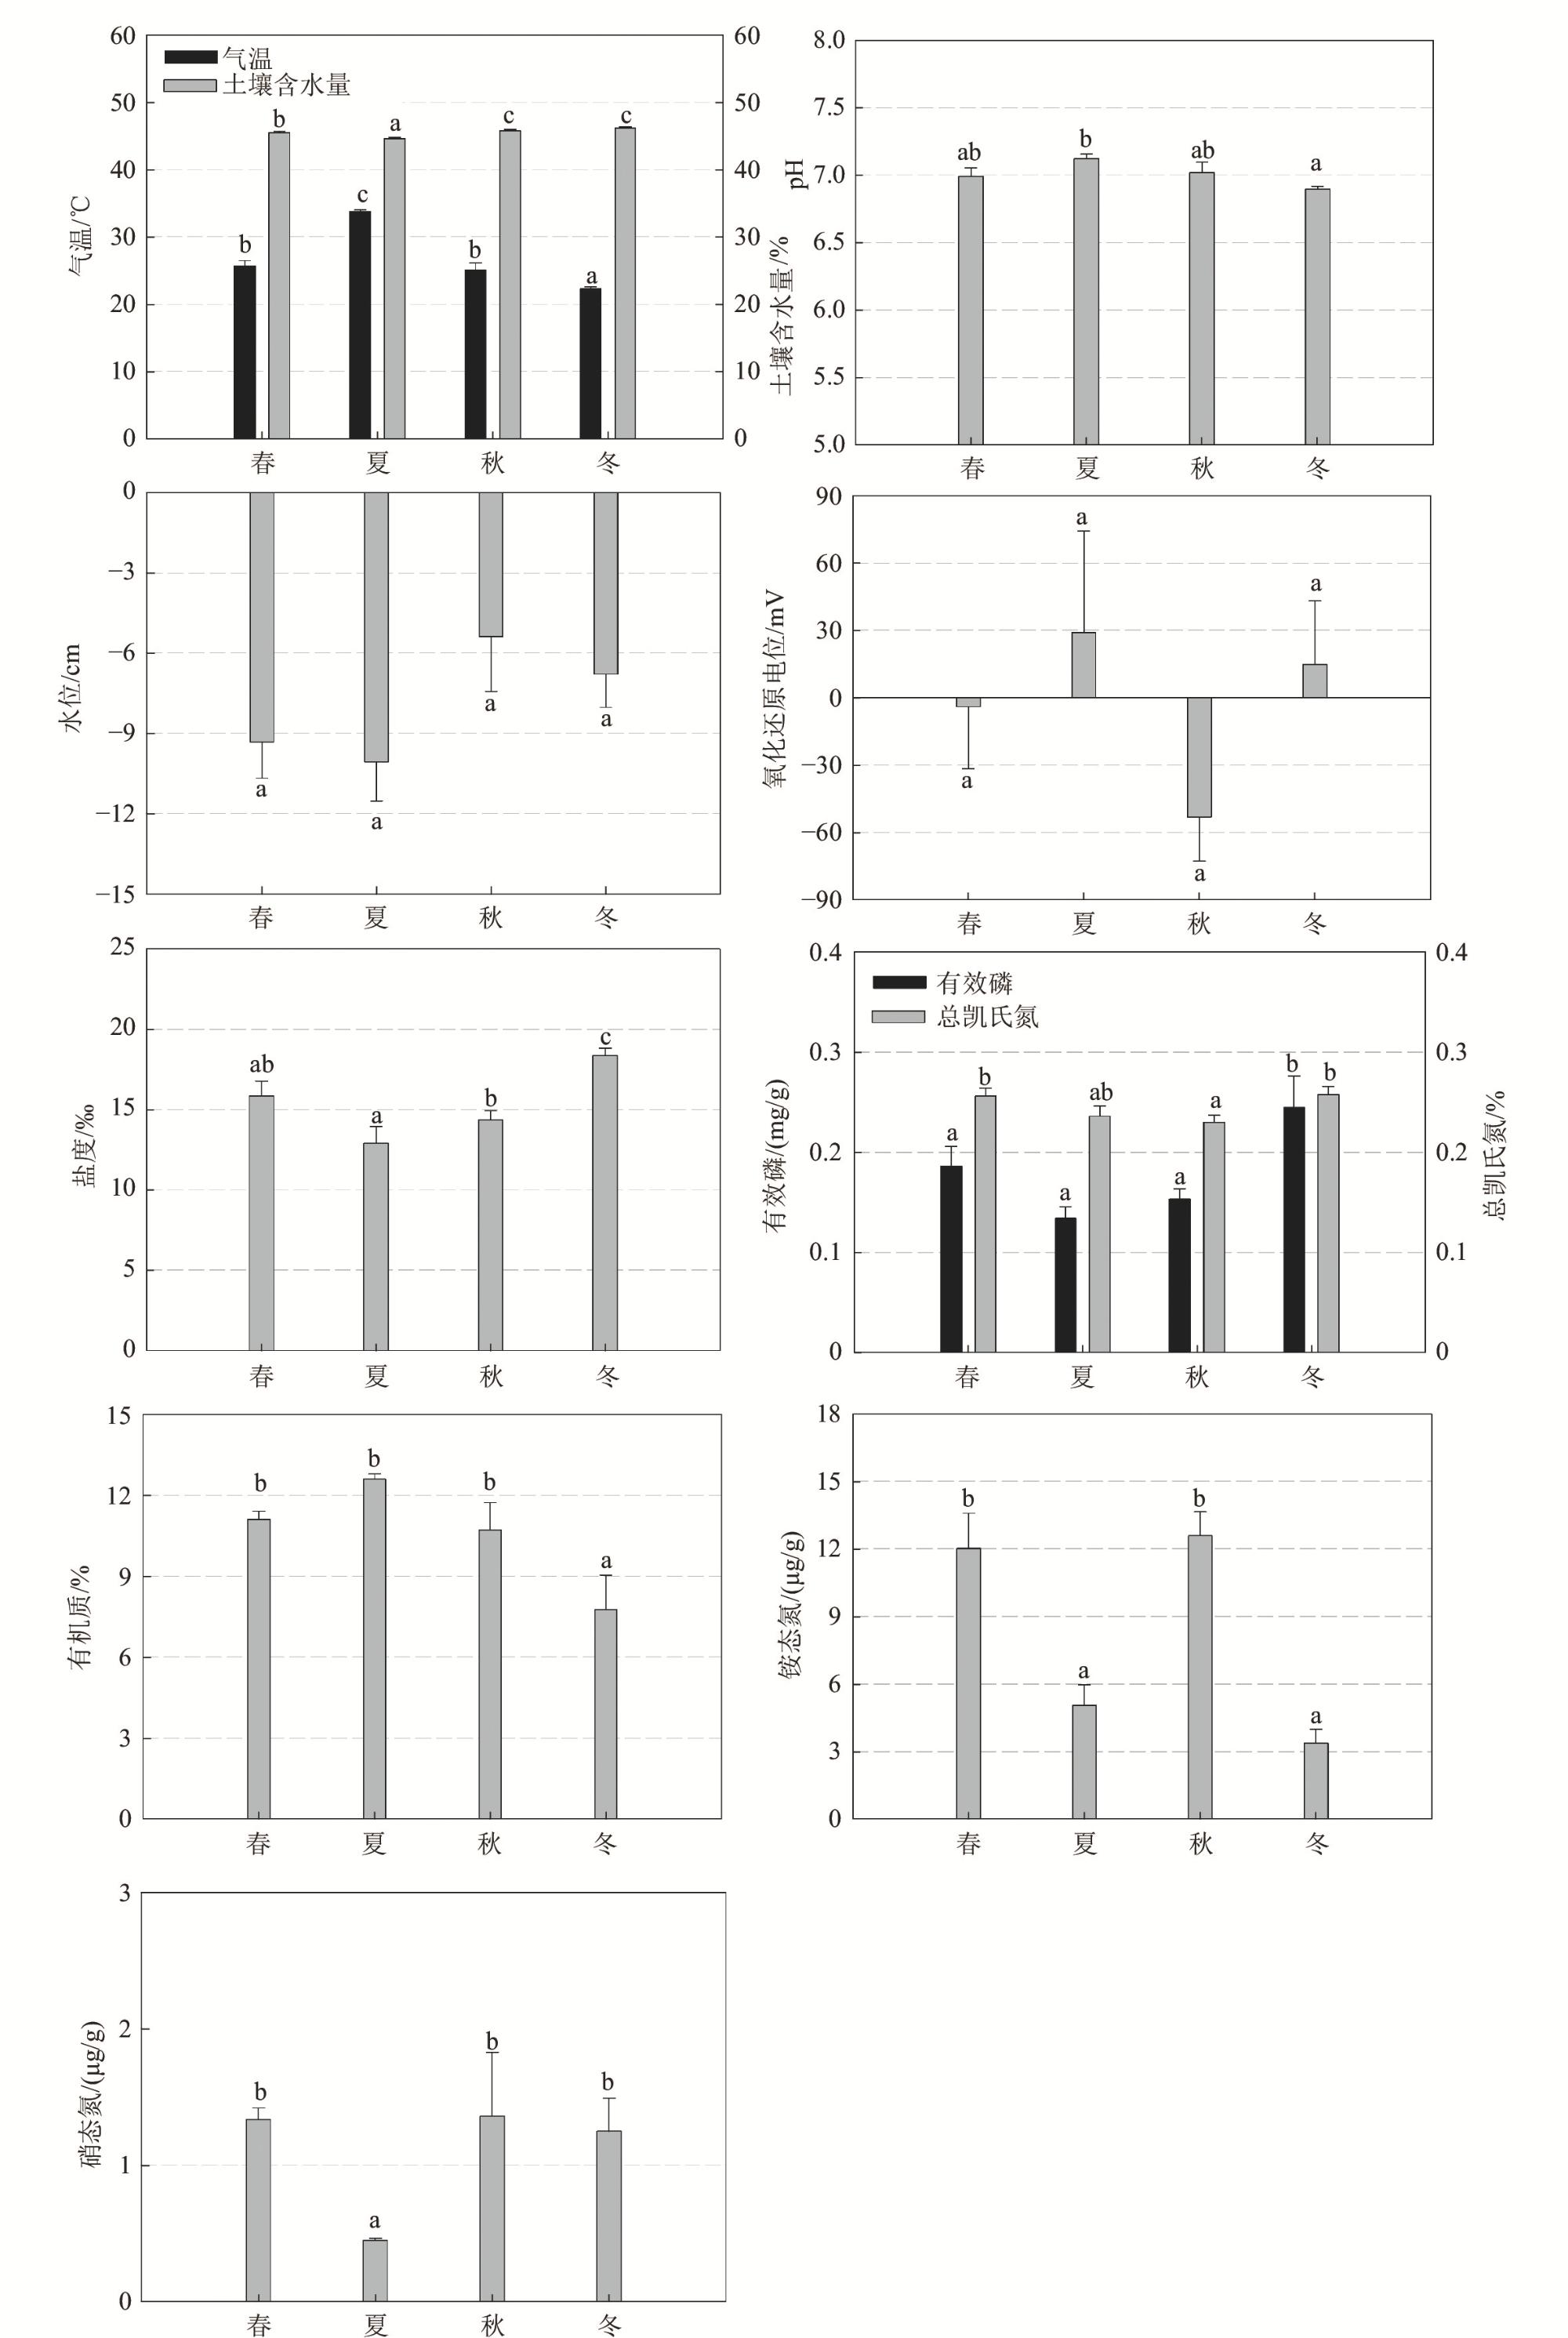
| 土壤温度/℃ | 23.4±0.9a | 24.0±0.9a | 24.1±0.9a | 23.5±0.7b | 29.9±0.1c | 23.7±1.0b | 18.1±0.2a |
| 土壤含水量/% | 45.4±0.2b | 45.8±0.2ab | 45.2±0.2a | 45.5±0.2b | 44.6±0.2a | 45.7±0.2c | 46.1±0.2c |
| 水位/cm | −13.5±1.6a | −2.6±0.9c | −7.6±0.9b | −9.3±1.3a | −10.1±1.5a | −5.4±2.0a | −6.8±1.2a |
| 氧化还原电位/mV | 73.2±20.3b | −125.2±15.8a | 42.1±24.8b | −4.0±27.7a | 28.9±45.3a | −53.2±19.7a | 14.9±28.0a |
| 盐度/‰ | 14.8±0.7a | 15.8±0.8a | 14.9±0.7a | 15.9±1.1ab | 12.9±1.1a | 14.4±0.6b | 18.4±0.5c |
| pH | 6.89±0.05a | 7.09±0.03b | 7.03±0.04b | 6.99±0.06ab | 7.12±0.03b | 7.02±0.08ab | 6.89±0.03a |
| 有效磷质量分数/(mg/g) | 0.13±0.01a | 0.25±0.02b | 0.17±0.01a | 0.19±0.02a | 0.13±0.01a | 0.15±0.01a | 0.24±0.03b |
| 铵态氮质量分数/(μg/g) | 7.23±1.48a | 9.92±1.64a | 8.49±1.79a | 13.20±1.85b | 5.05±0.91a | 12.56±0.93b | 3.37±0.54a |
| 硝态氮质量分数/(μg/g) | 1.32±0.32a | 1.00±0.26a | 1.14±0.17a | 1.55±0.17b | 0.45±0.02a | 1.36±0.10b | 1.31±0.24b |
| 有机质质量分数/% | 11.18±0.39a | 9.67±1.21a | 10.77±0.8a | 11.10±0.31b | 12.59±0.19b | 10.72±0.87b | 7.75±1.11a |
| 总凯氏氮质量分数/% | 0.24±0.01ab | 0.26±0.01ab | 0.23±0.00a | 0.26±0.01b | 0.24±0.01ab | 0.23±0.01a | 0.26±0.01b |
3 Monthly variations of soil N2O, CH4 and CO2 fluxes at three tidal positions in Mai Po mangrove wetland, Hong Kong香港米埔红树林湿地不同空间位置N2O、CH4 和CO2排放通量的月变化 |
4 Mean values of soil greenhouse gas fluxes at different seasons in Mai Po mangrove wetland, Hong Kong香港米埔红树林湿地温室气体排放通量在不同季节的平均值 n=27,p<0.05)。]]> |
2 Results of two-way ANOVA on the effects of seasons and tidal positions on soil greenhouse gas in Mai Po mangrove wetland, Hong Kong季节与潮汐位置对香港米埔红树林湿地土壤温室气体排放通量影响的双因素方差分析 |
| F值 | |||
| N2O | CH4 | CO2 | |
| 注:*和**分别表示p<0.05和p<0.01。 | |||
| 季节 | 5.87** | 6.40** | 25.59** |
| 空间位置 | 7.02** | 4.97** | 1.66 |
| 季节×空间位置 | 2.50* | 2.18 | 1.18 |
3 Pearson’s correlation coefficients between greenhouse gas fluxes and environmental parameters in Mai Po mangrove wetland, Hong Kong香港米埔红树林湿地土壤温室气体排放通量与环境因子之间的皮尔森相关系数 |
| 环境因子 | 温室气体排放通量 | ||
| N2O | CH4 | CO2 | |
| 注:*和**分别表示p<0.05和p<0.01; n=108。 | |||
| 气温 | 0.22* | 0.39** | 0.52** |
| 土壤温度 | 0.25** | 0.46** | 0.52** |
| 地下水位 | 0.27** | 0.14 | −0.27** |
| 氧化还原电位 | −0.17 | 0.32** | −0.08 |
| 盐度 | −0.05 | −0.33** | −0.23** |
| pH | −0.12 | 0.44** | 0.39 |
| 土壤含水量 | 0.17 | −0.11 | −0.37** |
4 Comparison of soil greenhouse gas fluxes in Mai Po mangrove wetland with other wetland ecosystems reported in previous studies香港米埔红树林湿地与其他地区湿地土壤温室气体排放通量对比 |
| 地点 | 生态类型 | 时间 | N2O通量/[mg/(m2·d)] | CH4通量/[mg/(m2·d)] | CO2通量/[g/(m2·d)] | 参考文献 |
| 注:“-”表示文献中未给出相关数据。 | ||||||
| 中国香港 | 亚热带红树林 | 2013—2014年 | 0.1~6.3 | −1.0-13.7 | 1.1~9.3 | 本研究 |
| 中国香港 | 亚热带红树林 | 2009—2010年 | 0.8~12.8 | - | 0.3~33.0 | [10] |
| 中国香港和深圳 | 亚热带红树林 | 2008年夏季 | 0.1~25.2 | 4.6~1 984.7 | 0.7~21.3 | [22] |
| 中国福建 | 亚热带红树林 | 2011—2012年 | 0.0~2.5 | 8.3~739.0 | 2.0~4.9 | [14] |
| 中国福建 | 亚热带红树林 | - | −0.04~1.2 | 0.03~128.6 | 0.7~12.3 | [27] |
| 中国福建 | 亚热带红树林 | 2002年7月;2003年9月 | 0.1~4.7 | 0.1~1.1 | 0.7~5.3 | [33] |
| 澳大利亚昆士兰 | 亚热带红树林 | 2005年夏季、冬季 | 0.2~4.8 | 1.1~37.7 | - | [12] |
| 澳大利亚昆士兰 | 亚热带红树林 | 1998—1999年7—10月 | −0.05~0.3 | 0.5~8.4 | - | [29] |
| 印度尼西亚北苏卡威西岛 | 热带红树林 | - | −6.9~13.9 | −0.1~0.2 | −1.4~4.1 | [32] |
| 印度 | 热带红树林 | - | 0.2~4.5 | 1.9~55.2 | - | [31] |
| 印度南部 | 热带红树林 | 2002—2003年 | 0.4~0.8 | 19.0~38.0 | - | [34] |
| 哥伦比亚 | 热带红树林 | 2005—2006年 | 0.8~28.3 | 0.0~758.0 | - | [35] |
| 坦桑尼亚 | 热带红树林 | - | - | 0.3-199.7 | - | [36] |
| 澳大利亚维多利亚 | 温带红树林 | 2009—2010年 | 0.0~0.1 | 0.2~0.7 | 3.2~5.2 | [37] |
| 芬兰波的尼亚湾 | 温带淡水湿地 | 2004年 | −1.2~1.4 | 1.6~ | - | [38] |
| 美国俄亥俄州 | 温带淡水湿地 | 2008—2009年 | - | 0.6~ | - | [39] |
| 德国东北部 | 温带半盐水湿地 | 2008—2009年 | - | 1.2~8.7 | - | [40] |
| 中国盐城 | 温带盐水湿地 | 2012—2013年 | 0.03~1.6 | −0.4~5.0 | 0.3~55.1 | [41] |
| 加拿大新不伦瑞克 | 温带盐水沼泽 | 1993年7—9月 | - | 0.2~11.0 | 0.3~3.7 | [42] |
| 美国弗吉尼亚 | 温带盐水沼泽 | 1980年 | - | 年均5.6 | - | [43] |
/
| 〈 |
|
〉 |