
|
卢向美(1997—),女,云南省丽江人,硕士研究生,从事城市地理信息系统研究。E-mail: 1765655153@qq.com |
收稿日期: 2023-09-13
修回日期: 2023-12-11
网络出版日期: 2024-04-10
基金资助
国家自然科学基金项目(42261073)
国家自然科学基金项目(41971369)
国家自然科学基金项目(41561086)
国家自然科学基金项目(42171392)
云南省中青年学术和技术带头人后备人才项目(202305AC160083)
云南省中青年学术和技术带头人后备人才项目(202205AC160014)
云南省基础研究专项重点项目(202201AS070024)
云南省基础研究专项重点项目(202001AS070032)
云南省基础研究计划青年项目(202101AU070037)
云南师范大学研究生科研创新基金(YJSJJ23-B146)
版权
Impacts of Human Activities and Climate Change on Wetland Landscape Pattern of the Nine Major Plateau Lake Basins in Yunnan Province
Received date: 2023-09-13
Revised date: 2023-12-11
Online published: 2024-04-10
Copyright
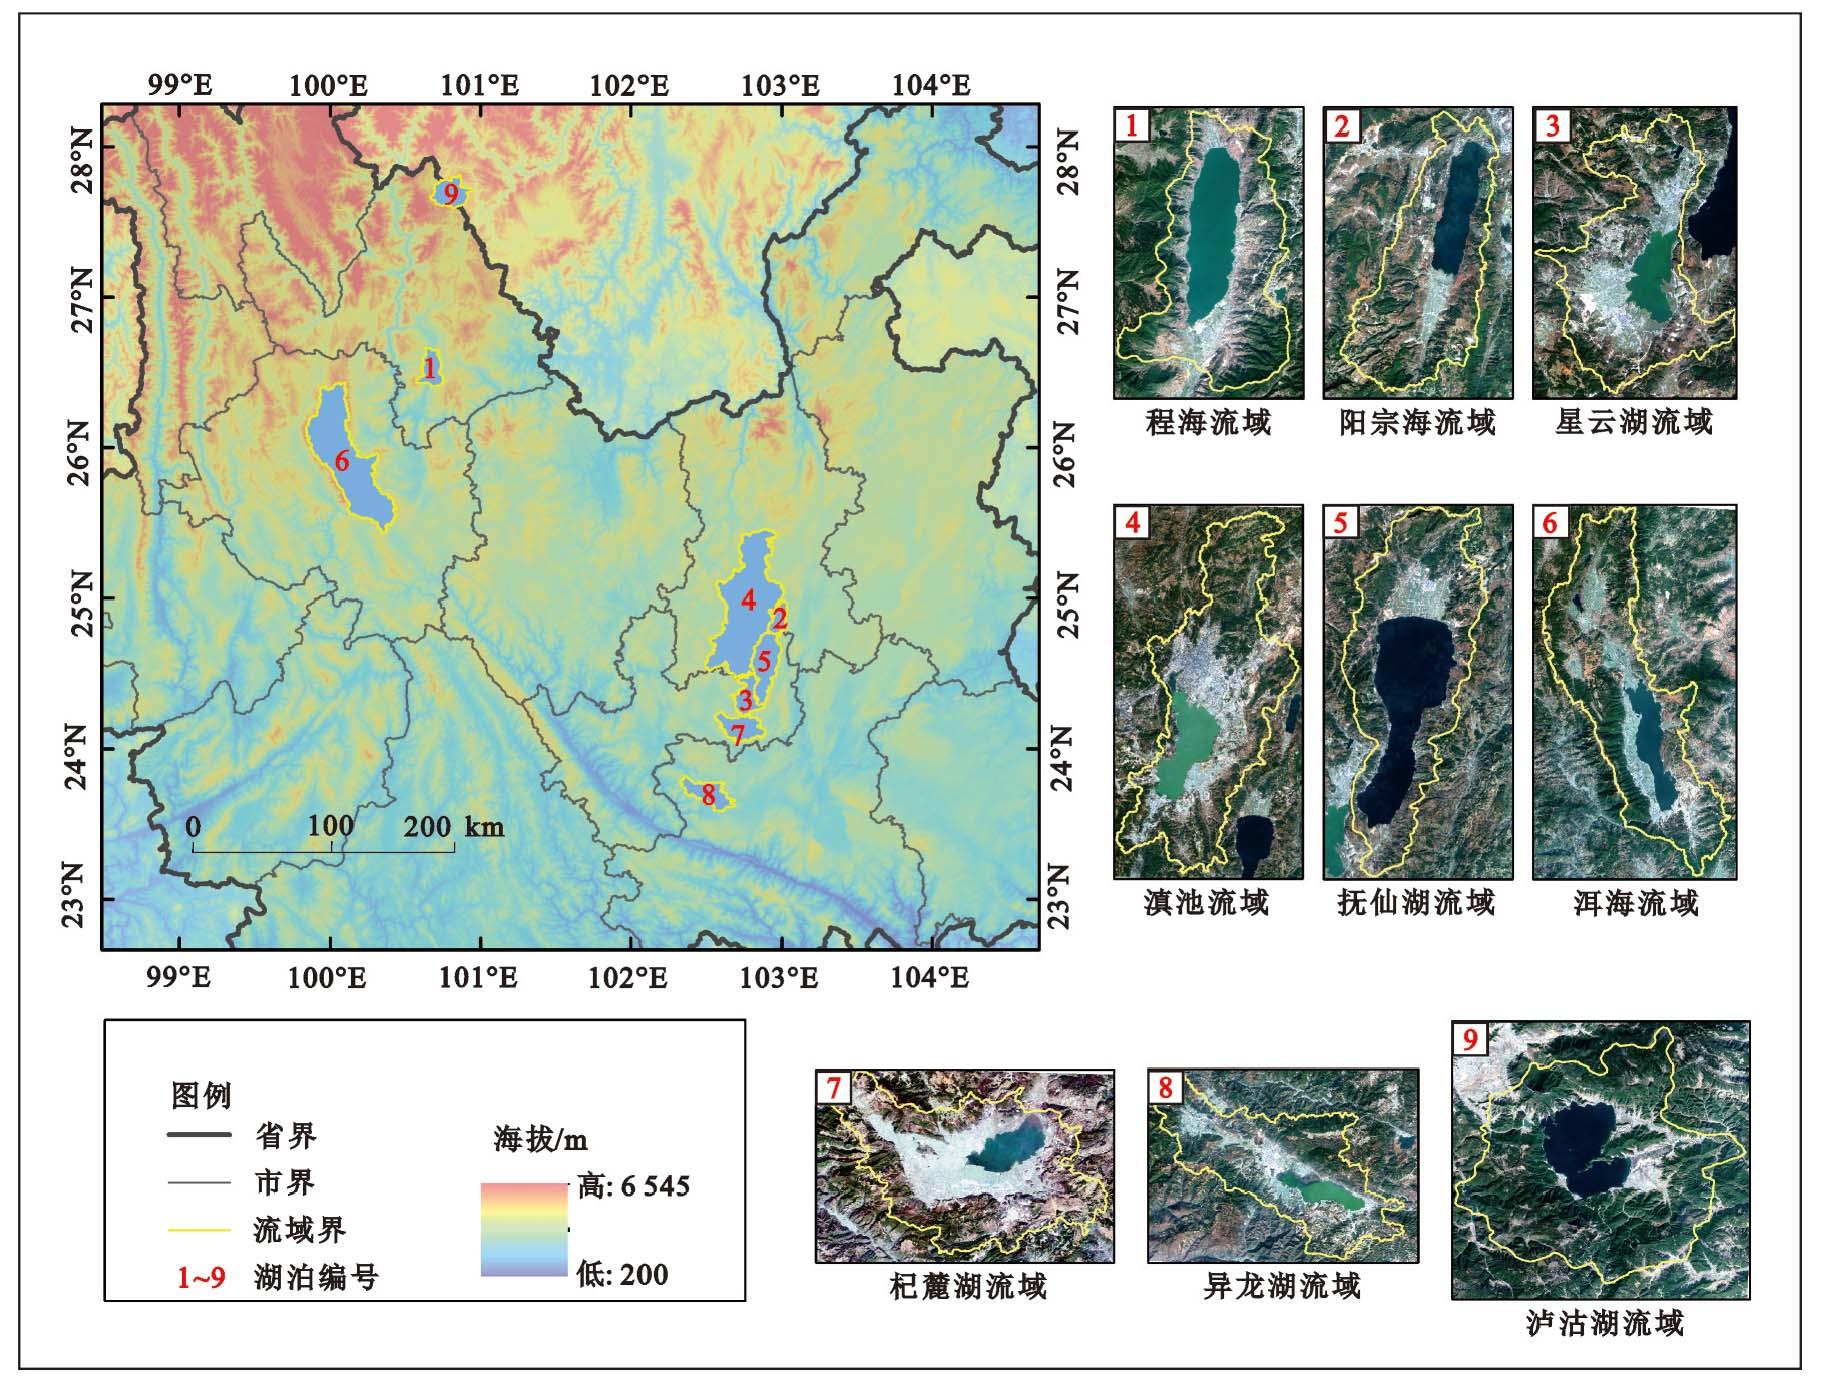
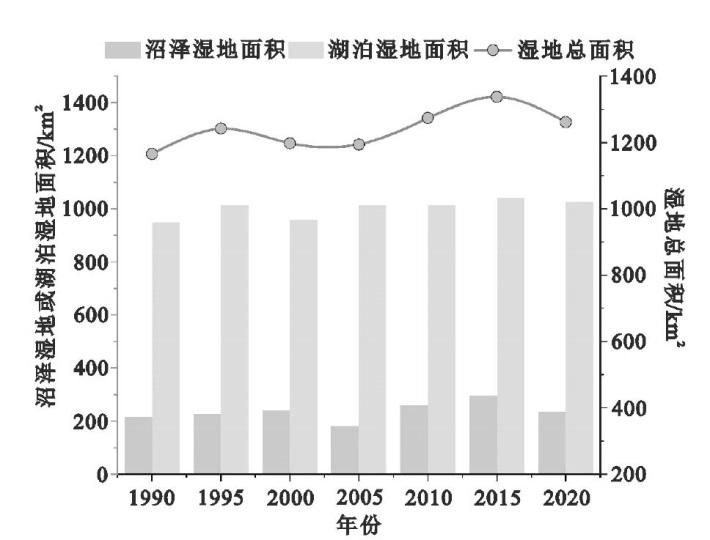
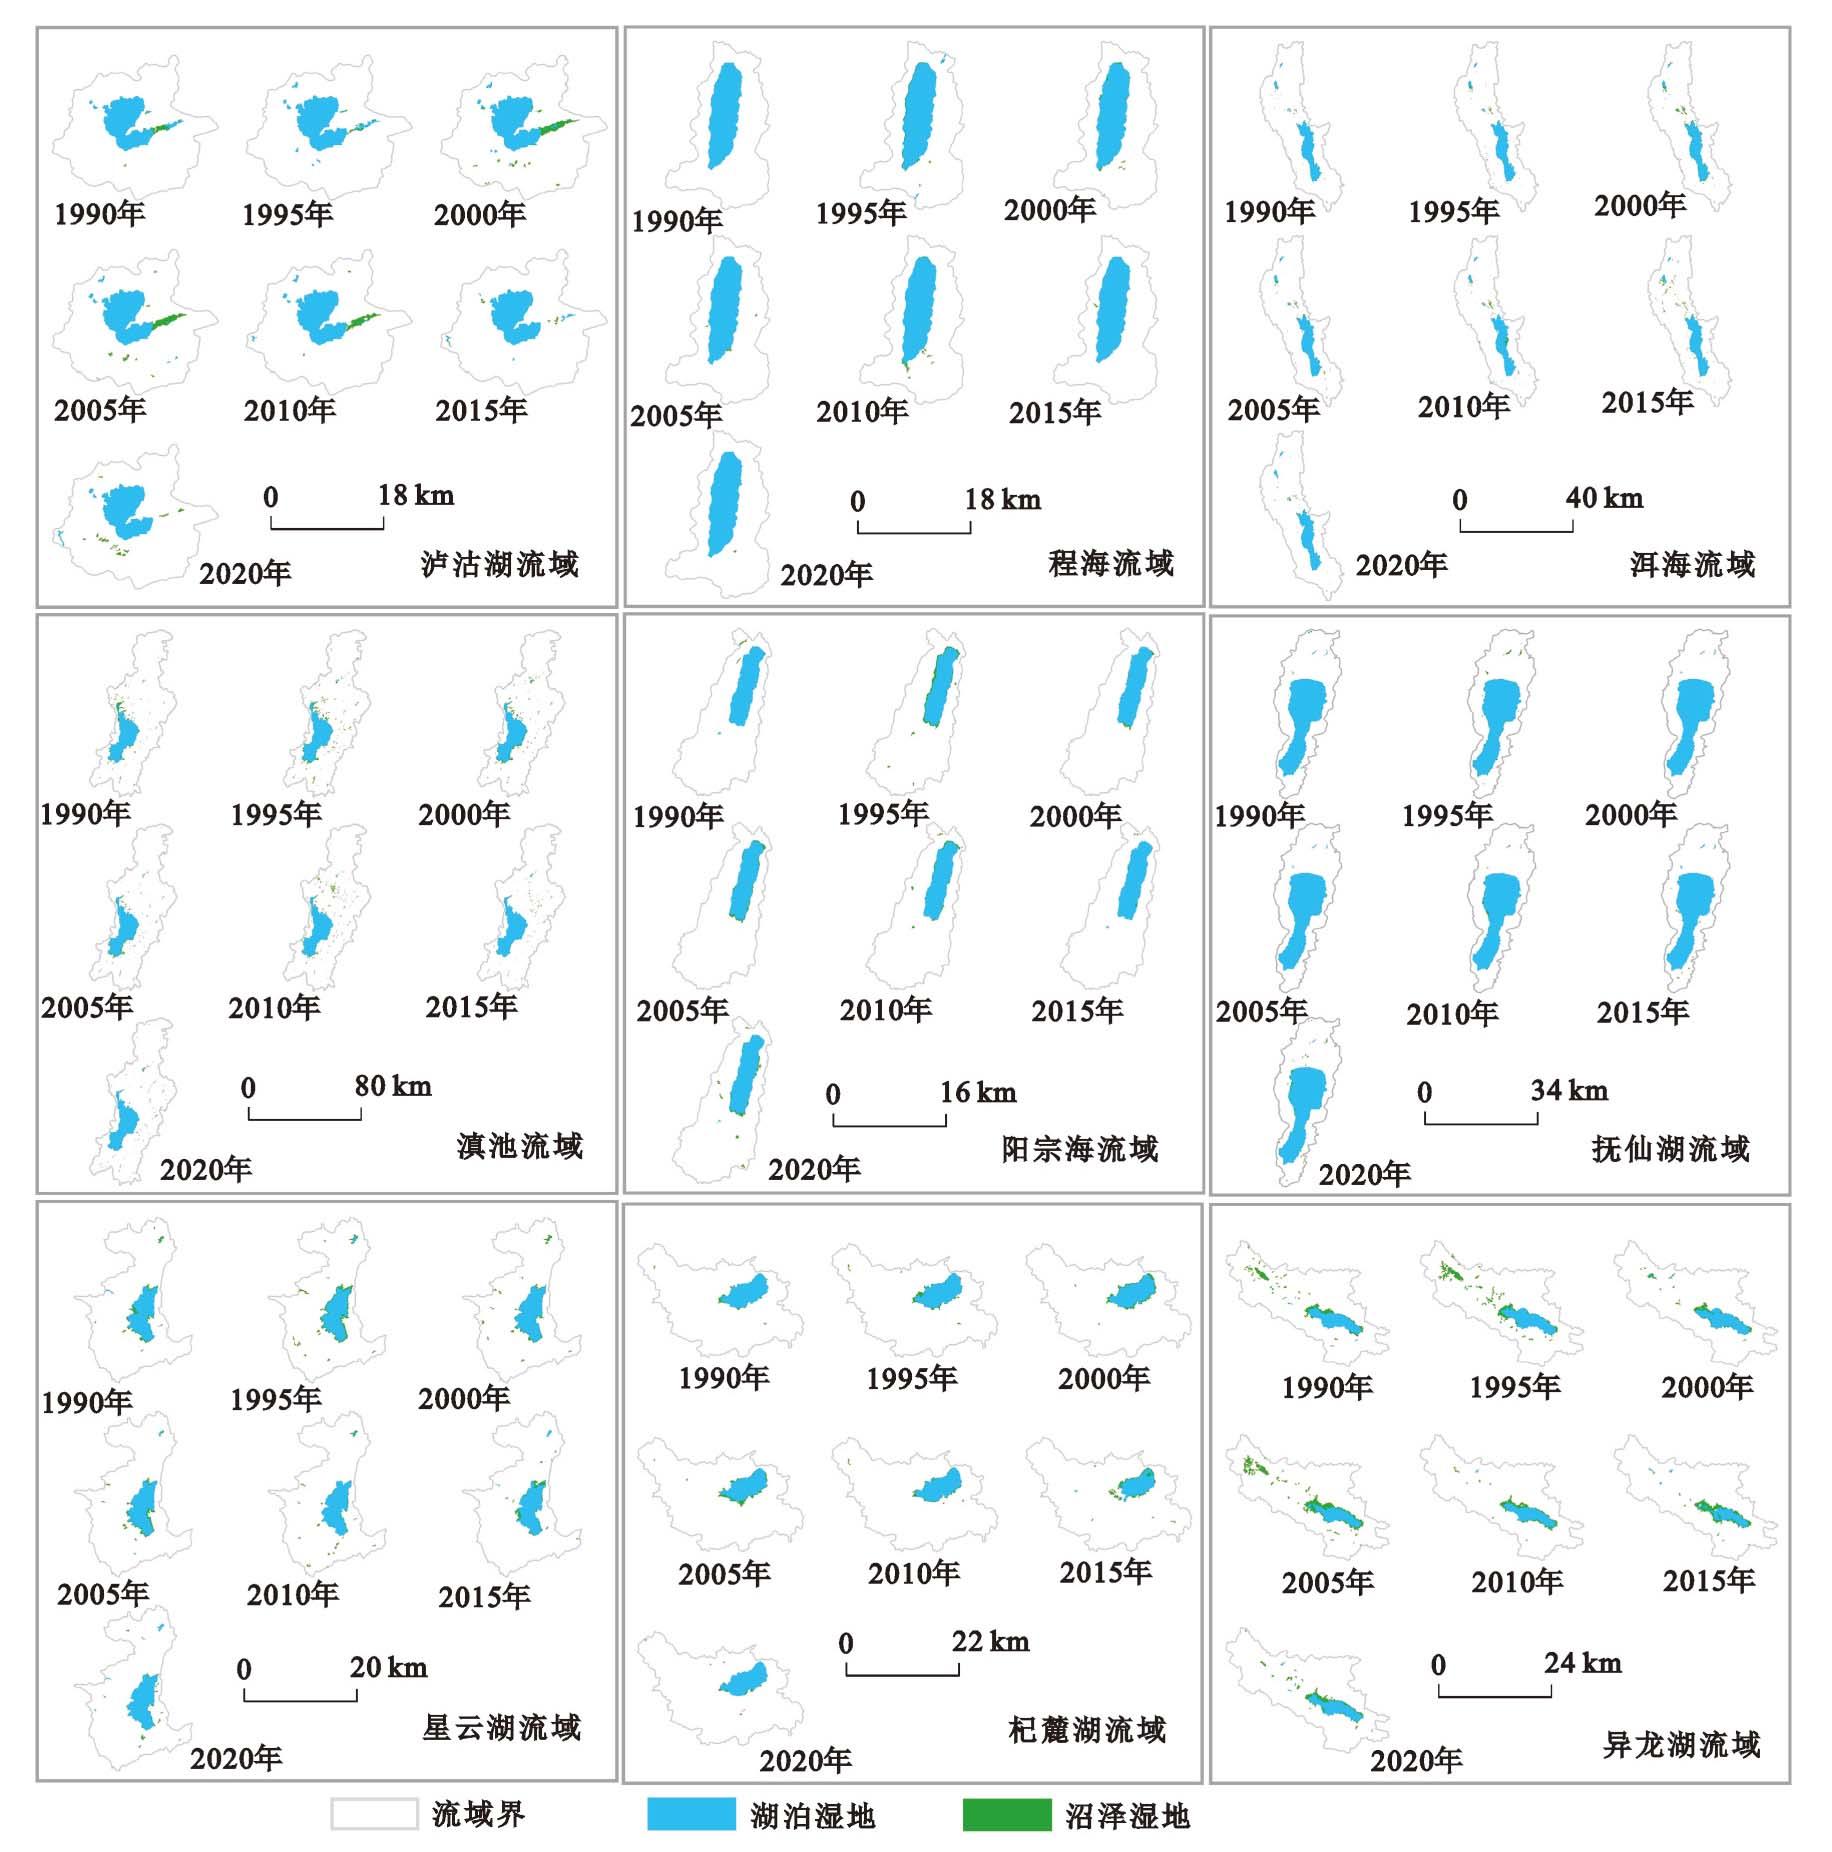
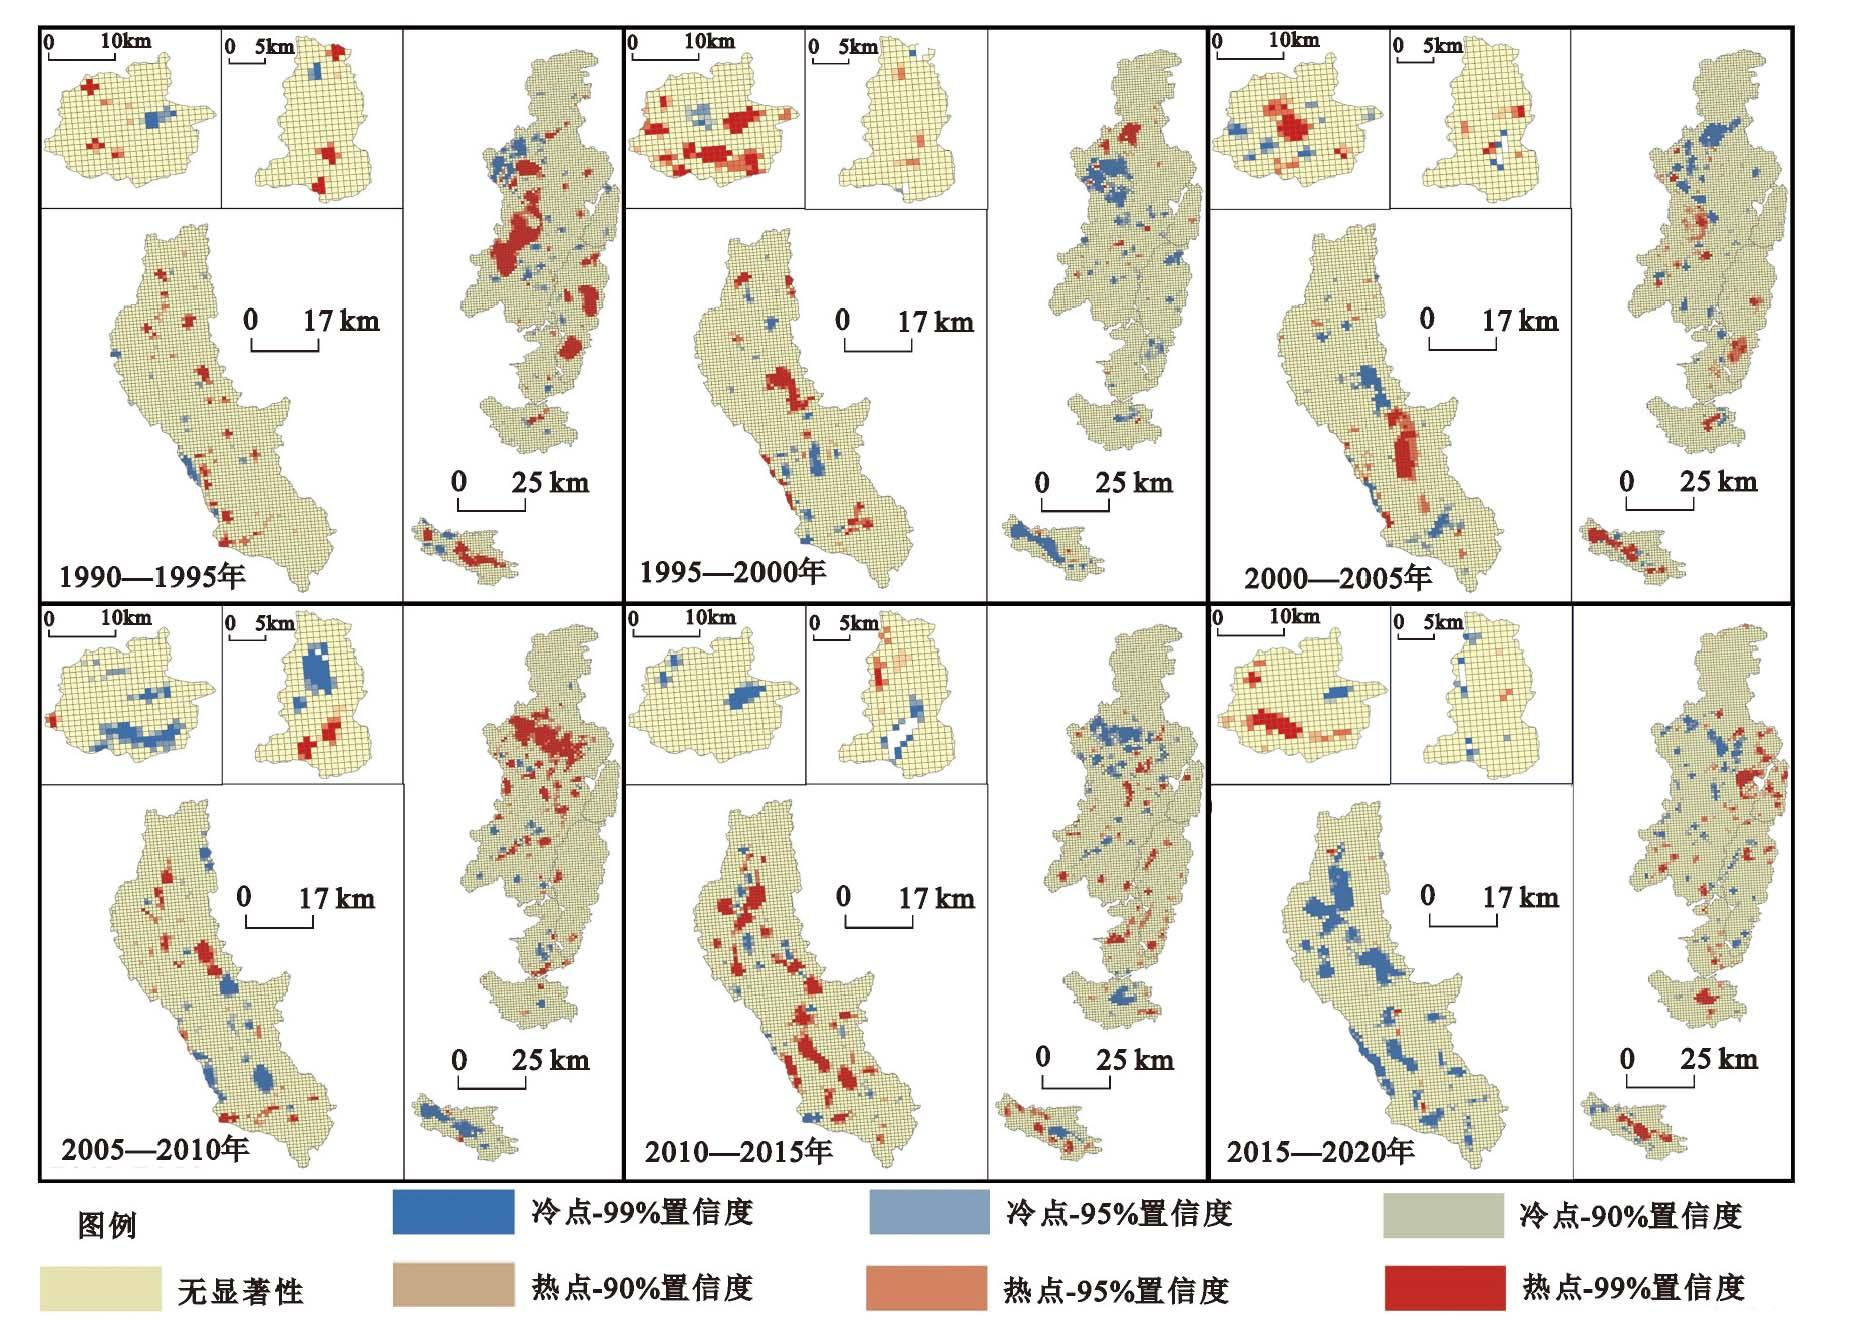
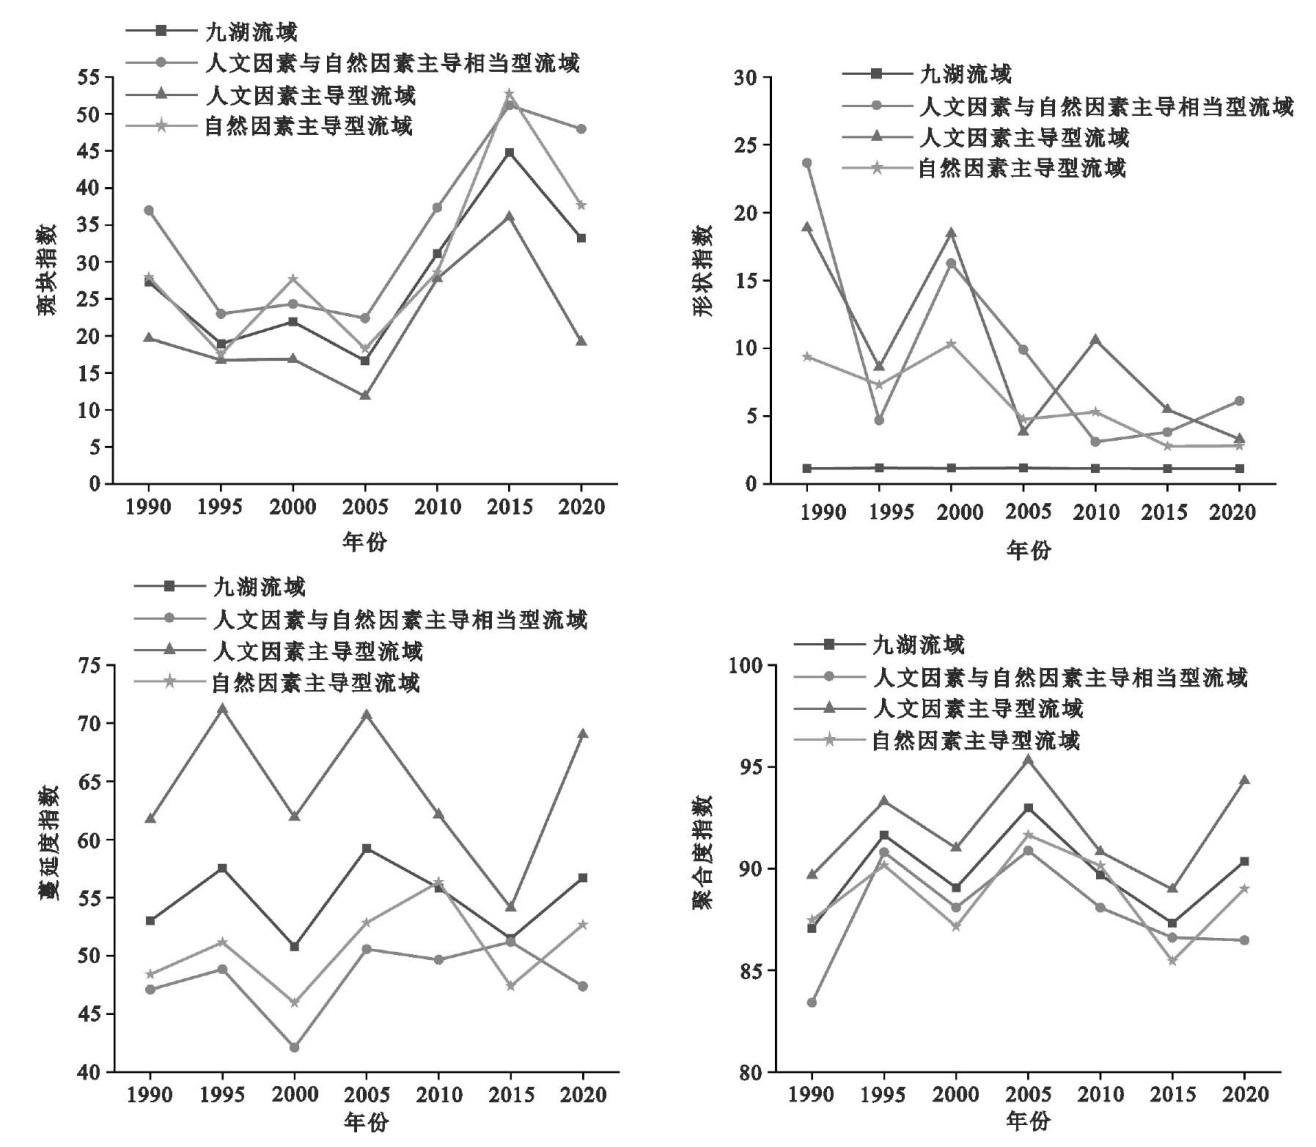
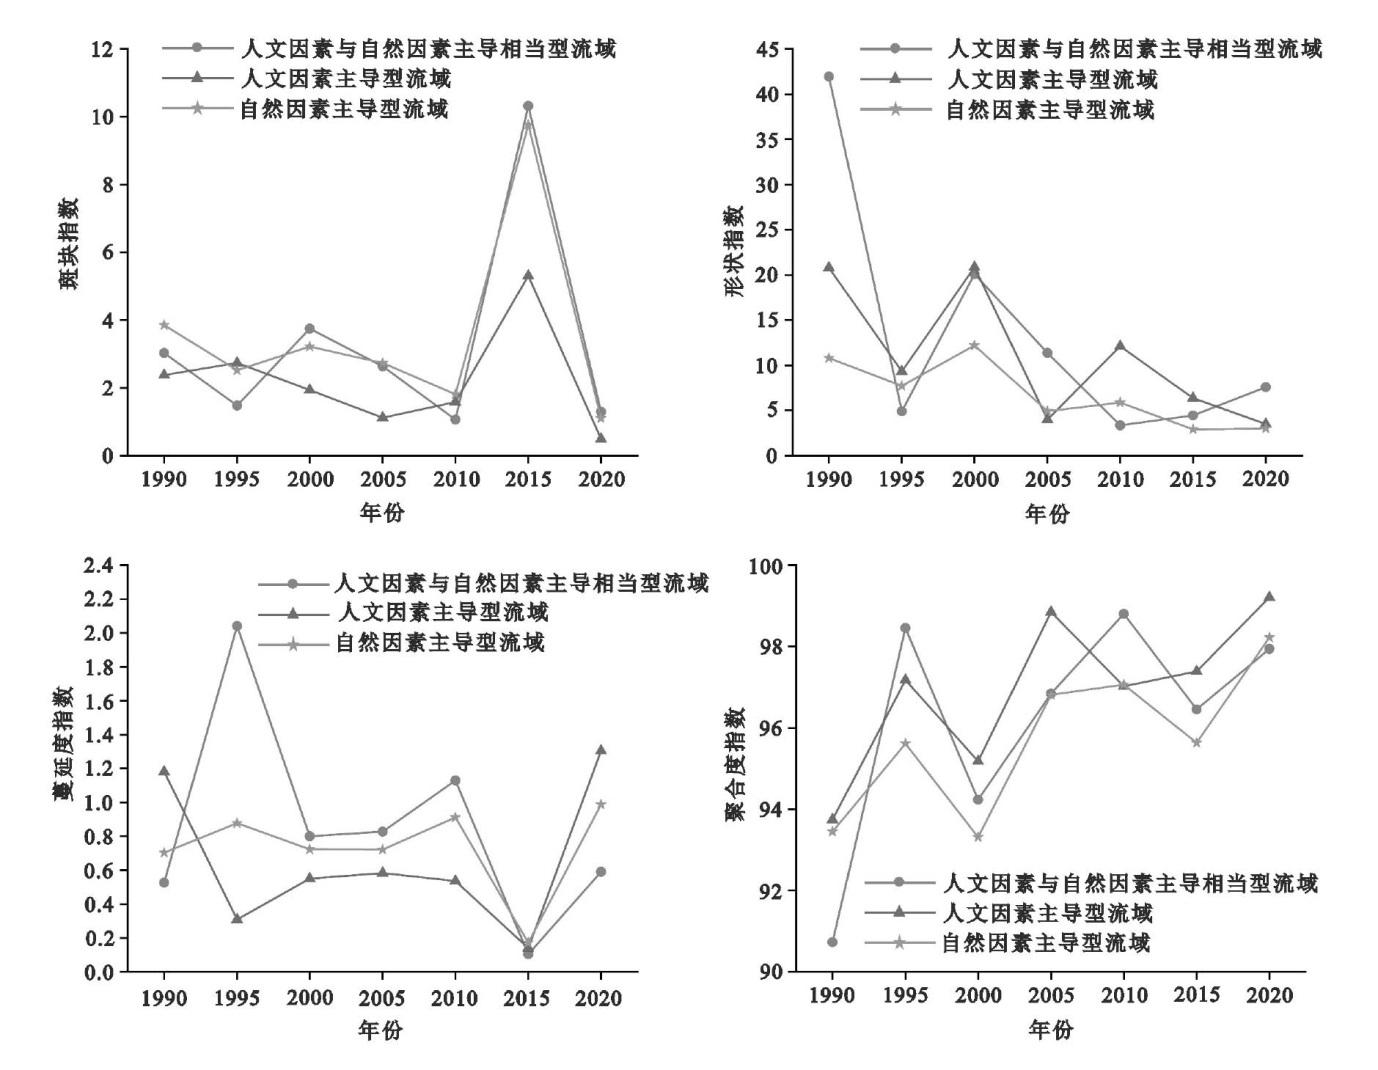
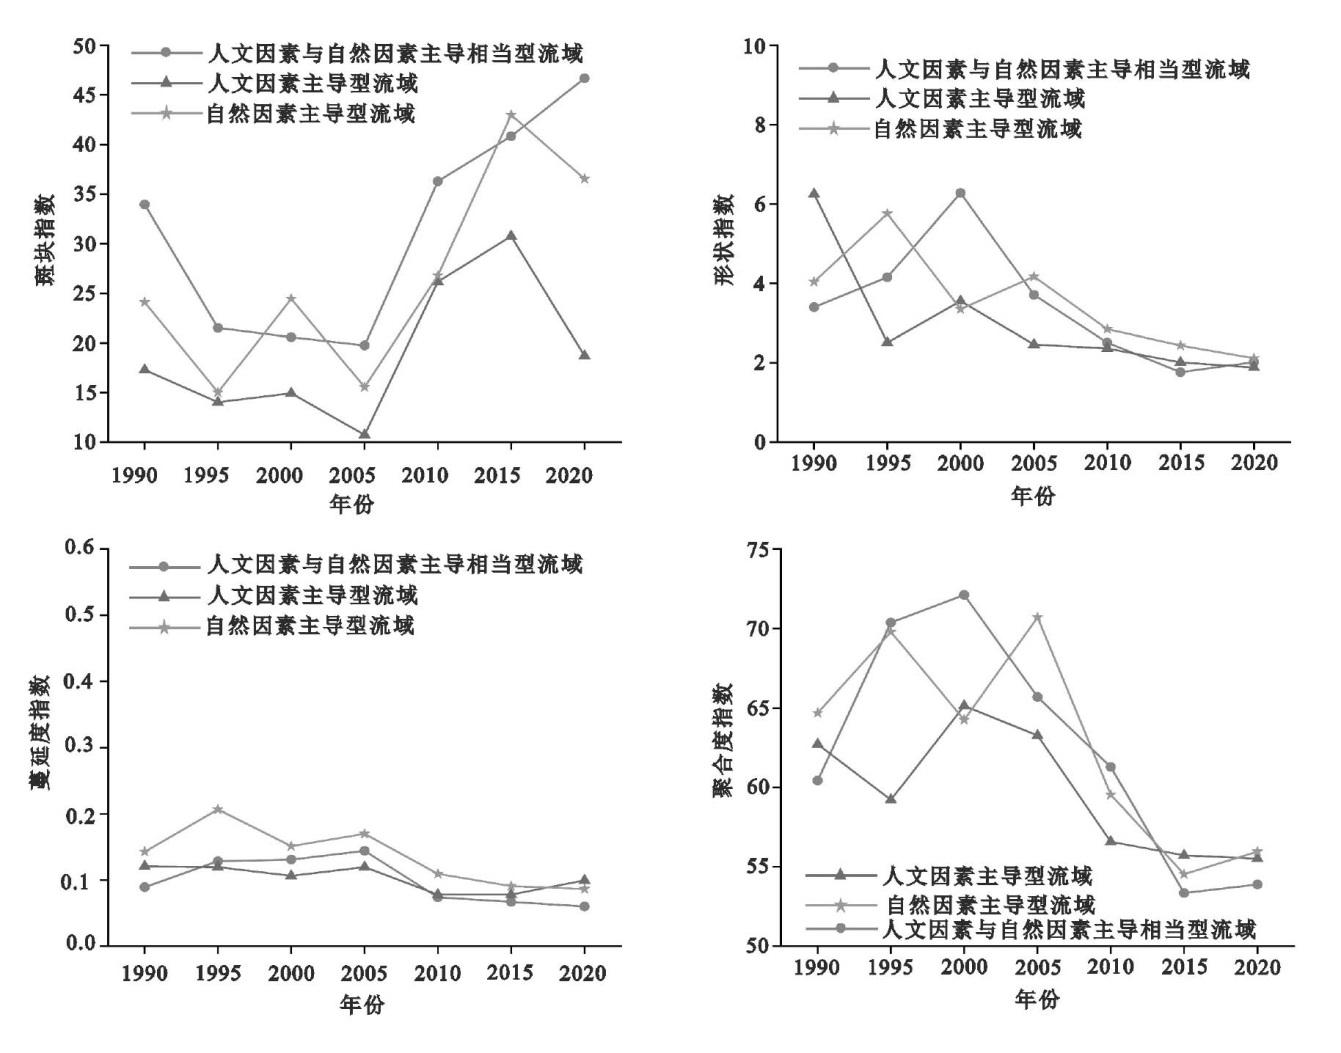
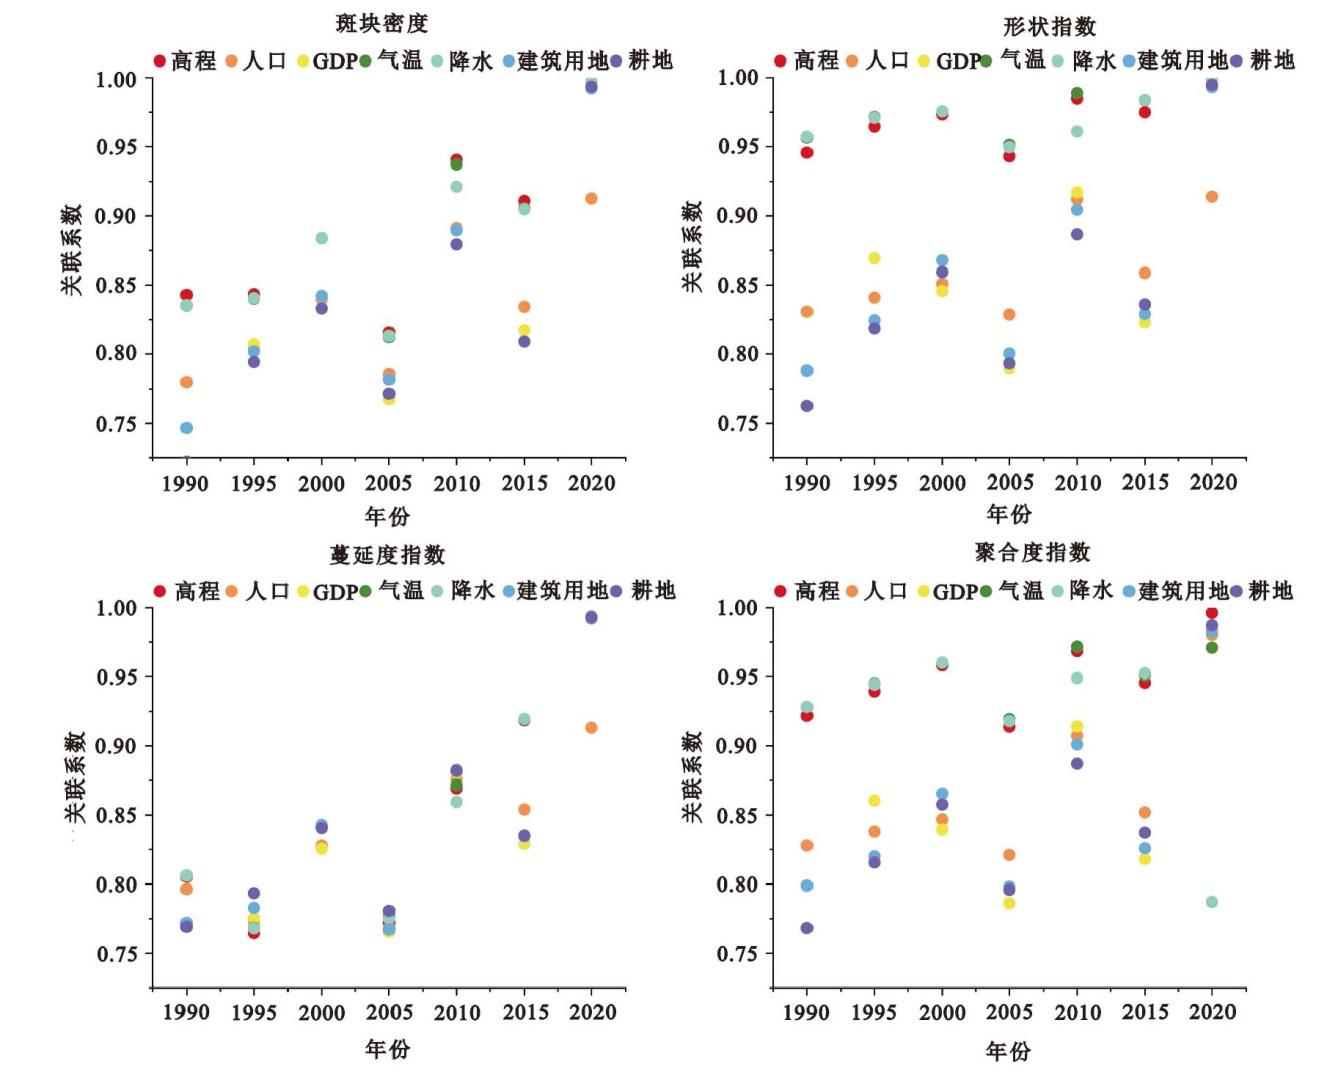
湿地是地球上具有多种功能的独特生态系统,是人类最重要的环境资源之一。在人类活动与气候变化的影响下,湿地景观破碎化程度加剧、景观多样性下降、景观生态安全格局面临危机。揭示人类活动与气候变化对湿地景观格局时空演变的影响及机制,对于湿地的保护、合理规划及科学管理都有着重要意义。以云南九大高原湖泊流域(以下简称九湖流域)为研究区域,在分析湿地景观空间分布格局及其时空演变规律的基础上,采用灰度关联分析,挖掘影响湿地景观格局演变的主要驱动力。结果表明,1990—2020年,九湖流域湿地面积总体上呈波动增加趋势,其中湖泊湿地面积基本保持稳定,沼泽湿地面积变化较大,主要转换为耕地;近30年来,九湖流域湿地的景观特征呈阶段性变化,1990—1995年,湿地聚集现象明显,斑块间的连通性增加;1995—2005年,湿地景观呈小幅度破碎化,湿地景观形状开始向不规则方向发展;2005—2015年,九湖流域湿地破碎化现象加剧,斑块越来越分散;2015年后,湿地破碎化趋势得到缓解;九湖流域湿地景观格局受人类活动和气候变化的双重影响,但不同湖泊的主要影响因子存在较大差异,在人文与自然因素主导型湖泊流域(滇池)和自然因素主导型湖泊流域(异龙湖、泸沽湖、杞麓湖、星云湖、阳宗海和程海),降水是湿地景观演变的主要驱动力,其次是气温,而在人文因素主导型湖泊流域(抚仙湖和洱海),人口数量是湿地景观演变的关键驱动力。
卢向美 , 彭双云 , 蔡福诚 , 彭世仙 , 项文广 . 人类活动与气候变化对云南九大高原湖泊流域湿地景观格局的影响[J]. 湿地科学, 2024 , 22(2) : 191 -206 . DOI: 10.13248/j.cnki.wetlandsci.2024.02.004
Wetlands are unique ecosystems with multiple functions on Earth, and they are one of the most important environmental resources for humans. Under the influence of human activities and climate change, the fragmentation of wetland landscapes has intensified, landscape diversity has decreased, and the pattern of landscape ecological security is facing a crisis. Therefore, revealing the impact and mechanism of human activities and climate change on the spatiotemporal evolution of wetland landscape patterns is of great significance for the protection, rational planning, and scientific management of wetlands. Taking the nine major plateau lake basins in Yunnan Province (hereinafter referred to as the nine lake basins) as the study area, based on the analysis of spatial distribution pattern and spatiotemporal evolution laws of wetland landscapes, gray correlation analysis was used to explore the main driving forces influencing the evolution of wetland landscape patterns. The results showed that from 1990 to 2020, the wetland area in the nine lake basins generally showed a fluctuating increase trend, among them, the area of lake wetlands remained basically stable, while the area of marsh wetlands changed significantly, mainly converted into cultivated lands. In the past 30 years, the landscape characteristics of wetlands in the nine lake basins have changed in stages. From 1990 to 1995, the aggregation of wetlands was obvious, and the connectivity between patches increased. From 1995 to 2005, the wetland landscape presented a slight fragmentation trend, and the shape of the wetland landscape began to develop towards irregularity. From 2005 to 2015, the fragmentation of wetlands in the basins intensified, and the patches became increasingly scattered. After 2015, the trend of wetland fragmentation was alleviated. The wetland landscape pattern in the nine lakes basin was affected by both human activities and climate change, but there were significant differences in the main influencing factors among different lakes. In lake basins dominated by human and natural factors (such as the Dianchi Lake) and lake basins dominated by natural factors (such as the Yilong Lake, the Lugu Lake, the Qilu Lake, the Xingyun Lake, the Yangzonghai Lake and the Chenghai Lake), rainfall was the main driving force for the evolution of wetland landscapes, followed by temperature. However, in lake basins dominated by human factors (such as the Fuxian Lake and the Erhai Lake), population size was the key driving force for the evolution of wetland landscapes.

1 相关性等级分值Score of relevance ranking |
| 相关性等级 | 分值/分 |
| 中度(0.40~0.59) | 1 |
| 较强(0.60~0.79) | 5 |
| 强(0.80~1.00) | 10 |
2 九大高原湖泊流域评价得分和评价结果Evaluation score and results of the nine plateau lake basins |
| 湖泊流域 | 评价得分/分 | 评价结果 | |
| 人文因素 | 自然因素 | ||
| 程海 | 15 | 29 | 自然因素主导型 |
| 滇池 | 1 | 1 | 人文因素与自然因素主导相当型 |
| 洱海 | 2 | 0 | 人文因素主导型 |
| 抚仙湖 | 6 | 5 | 人文因素主导型 |
| 泸沽湖 | 6 | 14 | 自然因素主导型 |
| 杞麓湖 | 2 | 6 | 自然因素主导型 |
| 星云湖 | 1 | 29 | 自然因素主导型 |
| 阳宗海 | 10 | 14 | 自然因素主导型 |
| 异龙湖 | 17 | 49 | 自然因素主导型 |
3 1990—2020年不同时期九湖流域湿地转入面积和转出面积Transferred in areas and transferred out areas of wetlands in the nine lake basins in different periods from 1990 to 2020 |
| 1990—1995年 | 湖泊湿地 | 林地 | 耕地 | 建筑用地 | 沼泽湿地 | 草地 | 裸地 | ||
| 注:表中“-”表示无数据。 | |||||||||
| 转出面积/(km2) | 湖泊湿地 | - | 2.66 | 1.93 | 0.49 | 39.46 | 0.05 | 0.05 | |
| 沼泽湿地 | 53.24 | 31.82 | 36.89 | 16.42 | - | 1.77 | 1.83 | ||
| 转入面积/(km2) | 湖泊湿地 | - | -15.50 | 0.74 | 0.98 | 53.24 | 0.18 | 0.24 | |
| 沼泽湿地 | 39.46 | 26.31 | 35.34 | 45.78 | - | 4.29 | 1.31 | ||
| 1995—2000年 | 湖泊湿地 | 林地 | 耕地 | 建筑用地 | 沼泽湿地 | 草地 | 裸地 | ||
| 转出面积/(km2) | 湖泊湿地 | - | 13.76 | 0.36 | 0.26 | 61.60 | 0.20 | 0.05 | |
| 沼泽湿地 | 33.99 | 25.39 | 42.28 | 29.85 | - | 4.60 | 1.17 | ||
| 转入面积/(km2) | 湖泊湿地 | - | 2.67 | 0.92 | 0.33 | 33.99 | 0.02 | 0.06 | |
| 沼泽湿地 | 61.60 | 34.12 | 32.06 | 18.29 | - | 1.48 | 1.84 | ||
| 2000—2005年 | 湖泊湿地 | 林地 | 耕地 | 建筑用地 | 沼泽湿地 | 草地 | 裸地 | ||
| 转出面积/(km2) | 湖泊湿地 | - | 2.74 | 1.26 | 0.53 | 29.74 | 0.10 | 0.11 | |
| 沼泽湿地 | 56.76 | 28.89 | 32.79 | 21.31 | - | 6.56 | 2.48 | ||
| 转入面积/(km2) | 湖泊湿地 | - | 4.44 | 0.41 | 0.28 | 56.76 | 0.12 | 0.35 | |
| 沼泽湿地 | 29.74 | 19.34 | 28.26 | 8.76 | - | 3.44 | 0.87 | ||
| 2005—2010年 | 湖泊湿地 | 林地 | 耕地 | 建筑用地 | 沼泽湿地 | 草地 | 裸地 | ||
| 转出面积/(km2) | 湖泊湿地 | - | 4.62 | 0.84 | 1.48 | 26.84 | 1.27 | 0.39 | |
| 沼泽湿地 | 38.06 | 15.37 | 32.08 | 17.54 | - | 13.61 | 1.86 | ||
| 转入面积/(km2) | 湖泊湿地 | - | 4.37 | 3.39 | 0.32 | 38.06 | 0.08 | 0.37 | |
| 沼泽湿地 | 26.84 | 61.69 | 45.60 | 33.82 | - | 21.11 | 7.93 | ||
| 2010—2015年 | 湖泊湿地 | 林地 | 耕地 | 建筑用地 | 沼泽湿地 | 草地 | 裸地 | ||
| 转出面积/(km2) | 湖泊湿地 | - | 5.76 | 4.68 | 0.42 | 32.72 | 2.51 | 1.19 | |
| 沼泽湿地 | 35.01 | 47.97 | 49.56 | 27.47 | - | 22.85 | 14.53 | ||
| 转入面积/(km2) | 湖泊湿地 | - | 6.35 | 3.69 | 6.19 | 35.01 | 9.88 | 2.19 | |
| 沼泽湿地 | 32.72 | 42.72 | 65.39 | 25.46 | - | 58.92 | 8.00 | ||
| 2015—2020年 | 湖泊湿地 | 林地 | 耕地 | 建筑用地 | 沼泽湿地 | 草地 | 裸地 | ||
| 转出面积/(km2) | 湖泊湿地 | - | 7.42 | 6.10 | 1.41 | 36.83 | 7.58 | 2.36 | |
| 沼泽湿地 | 35.13 | 63.49 | 85.21 | 8.83 | - | 38.60 | 13.21 | ||
| 转入面积/(km2) | 湖泊湿地 | - | 1.60 | 5.18 | 0.54 | 35.13 | 2.07 | 1.06 | |
| 沼泽湿地 | 36.83 | 47.86 | 36.30 | 18.10 | - | 27.71 | 17.60 | ||
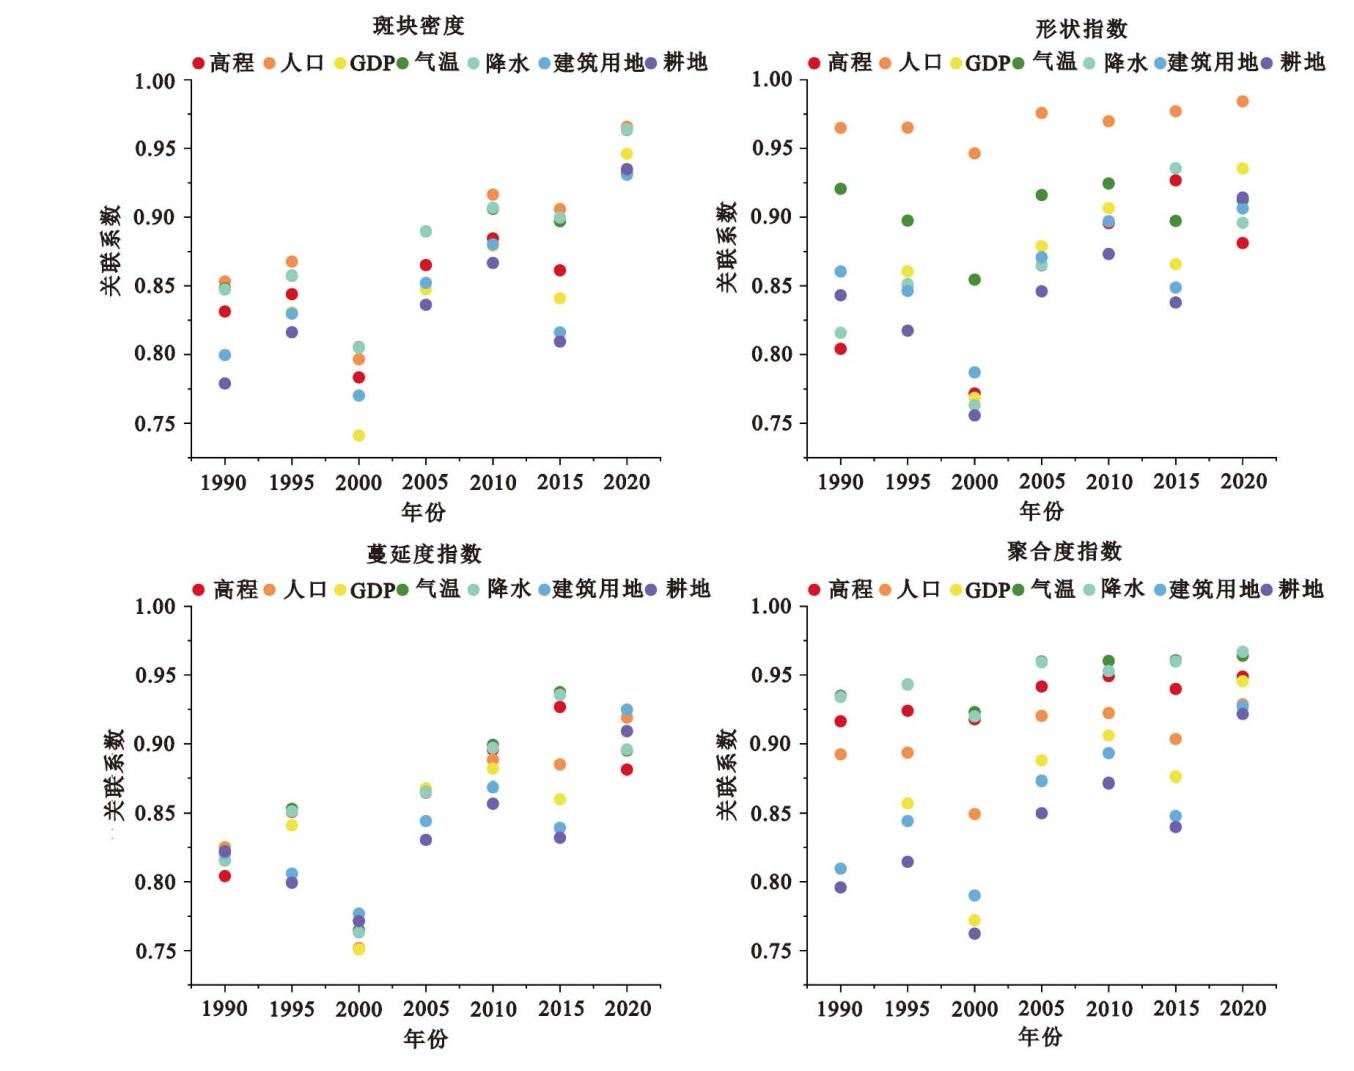
8 人文因素与自然因素主导相当型湖泊流域景观格局指数与各驱动因子的关联度Correlation between landscape pattern indices and driving factors in lake basins dominated by human and natural factors |
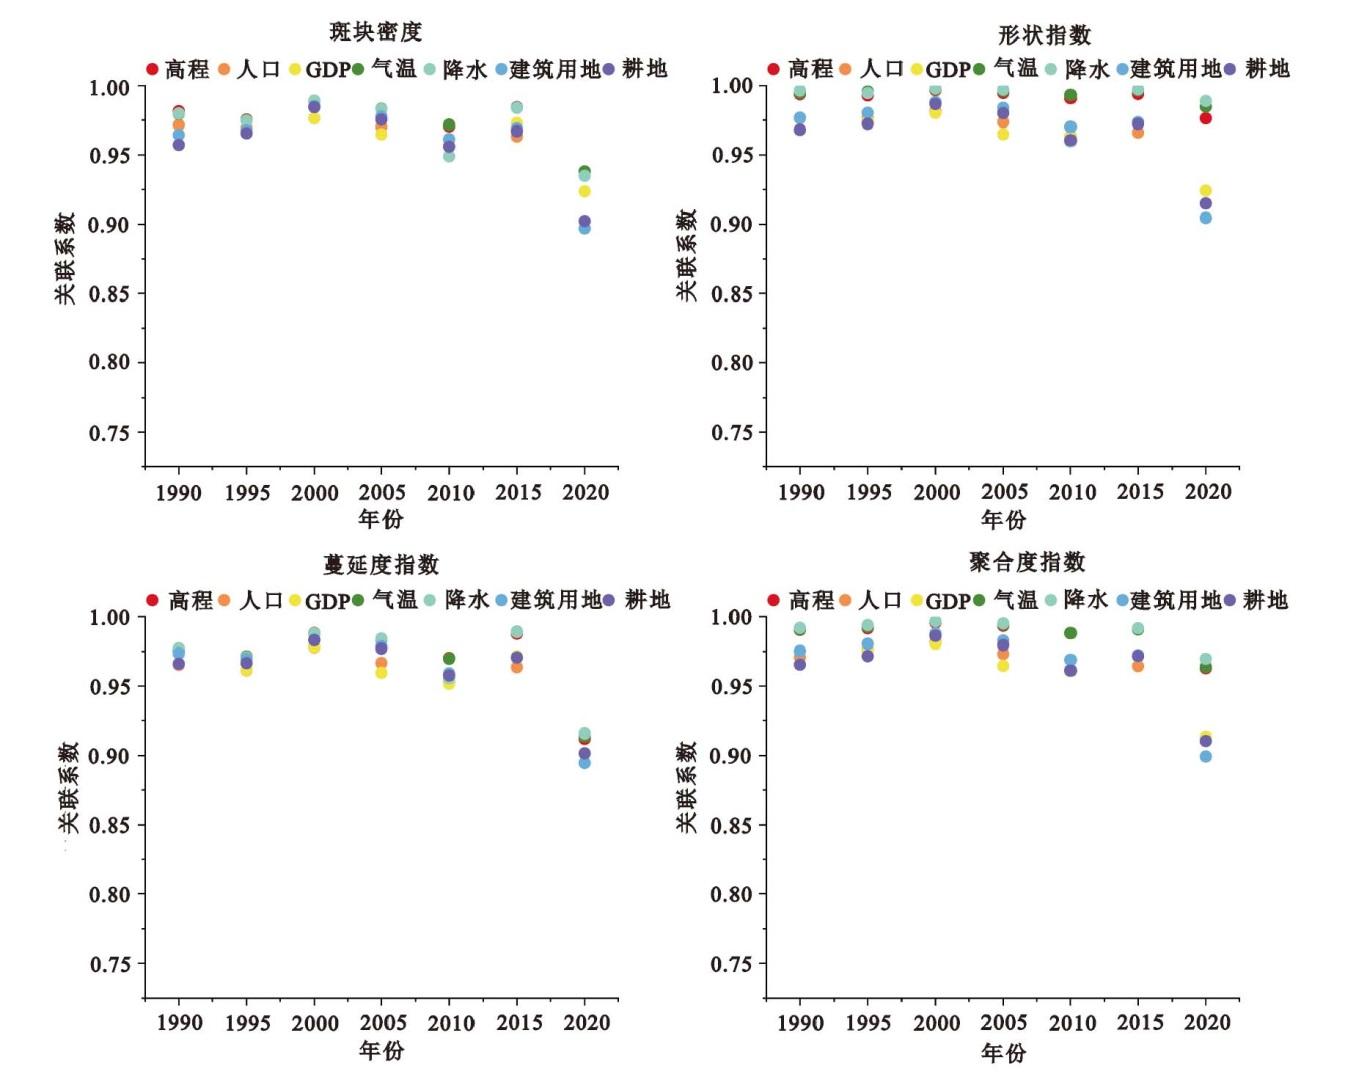
9 人文因素主导型湖泊流域景观格局指数与各驱动因子的关联度Correlation between landscape pattern indices and driving factors in lake basins dominated by human factors |
/
| 〈 |
|
〉 |