
基于用地类型的城区碳排放动态分析及低碳土地使用规划——以重庆蔡家智慧新城为例
|
胡苗芬/女/华南理工大学建筑学院在读博士研究生/亚热带建筑与城市科学全国重点实验室成员/研究方向为低碳城市、智慧城市 |
|
闫水玉/男/博士/重庆大学建筑城规学院教授/研究方向为可持续发展、生态规划 |
Copy editor: 刘昱霏
收稿日期: 2025-07-23
修回日期: 2025-12-02
网络出版日期: 2026-03-12
基金资助
国家重点研发计划项目“城区与街区减碳关键技术联合研究与示范”(2022YFE0208700)
版权
Dynamic Analysis of Urban Carbon Emissions Based on Land Use Types and Low-Carbon Land Use Planning: A Case Study of Caijia Smart New City, Chongqing
|
HU Miaofen is a Ph.D. candidate in the School of Architecture, South China University of Technology, and a member of Laboratory of National Key Laboratory of Subtropical Architecture and Urban Science. Her research focuses on low-carbon cities, smart cities |
|
YAN Shuiyu, Ph.D., is a professor in the College of Architecture and Urban Planning, Chongqing University. His research focuses on sustainable development, ecological planning |
Received date: 2025-07-23
Revised date: 2025-12-02
Online published: 2026-03-12
Copyright
城区是城市功能的核心,其内部各类用地的运行主导了城市绝大部分的能源消耗与碳排放,因此城区是碳减排和低碳土地规划的关键。核算城区不同用地类型的碳排放并分析其动态演变特征,解析其时空分布特征与驱动机制,对于城区低碳土地规划策略和支撑国家“双碳”战略目标具有关键意义。
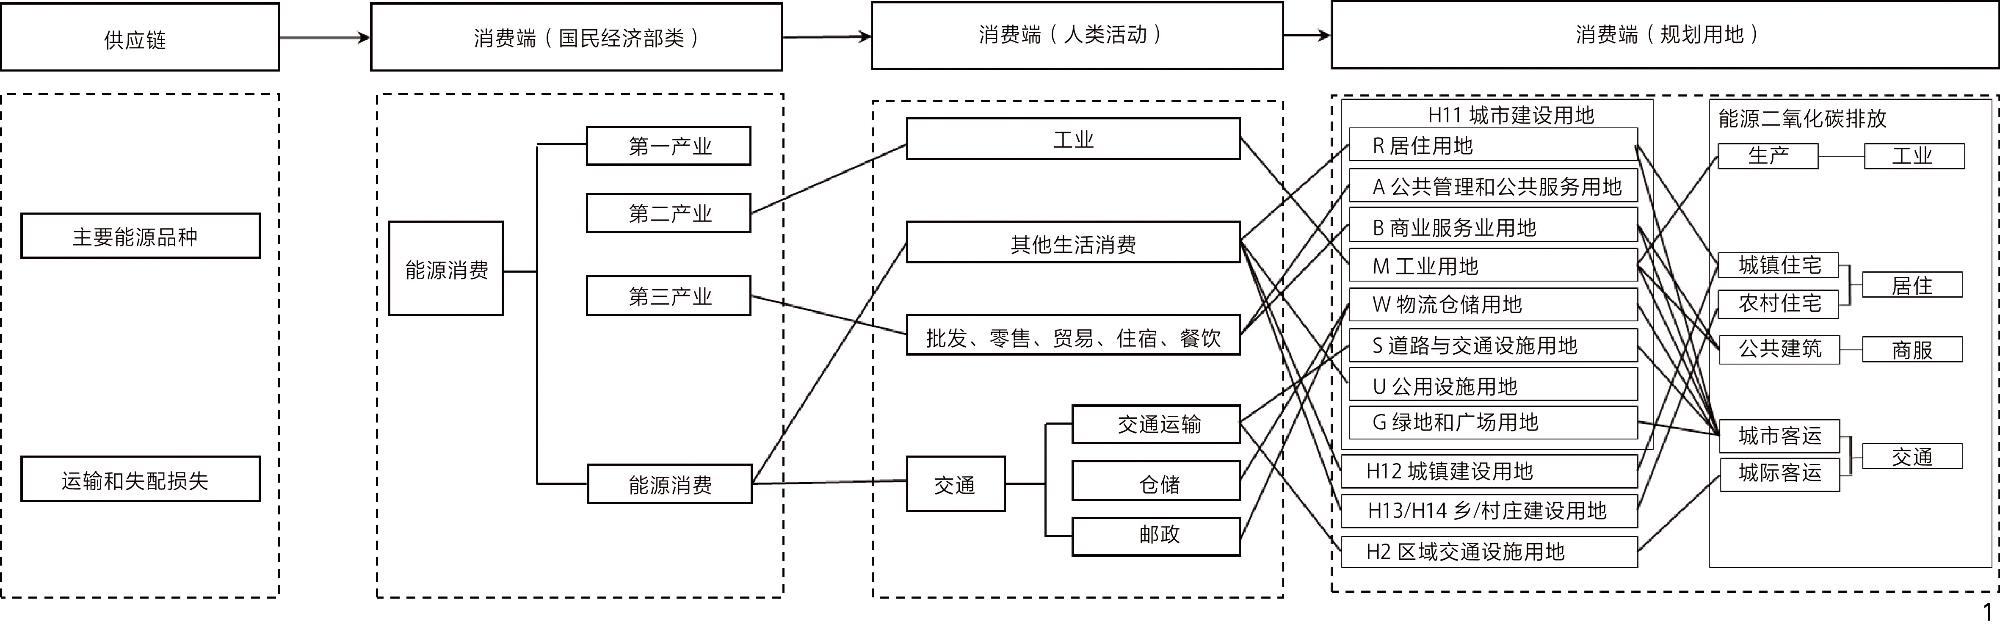
以重庆市典型的城区单元蔡家智慧新城作为研究对象,构建“人类活动-用地类型-碳排放”的城区尺度碳排放关联机制与核算模型,计算2016年、2021年实际用地碳排放量,预测2035年规划用地碳排放量,比较由用地类型变化所引发的碳排放总量、不同用地类型的碳排放总量、碳排强度值。运用对数平均迪氏指数(logarithmic mean divisia index, LMDI)分解法分析用地碳排放演变与用地规模、经济发展、人口集聚等驱动因子贡献度的时空演变规律,并根据多目标规划原理,运用交互式的线性和通用优化求解器(linear interactive and general optimizer, LINGO)软件进行测算,以经济效益最大化及碳排放最小化作为目标,对重庆蔡家智慧新城2035年土地利用结构进行优化研究。
1)蔡家智慧新城2016—2035年工业用地碳排放强度最大且呈持续下降趋势;其他用地碳排放强度于2016—2021年呈上升趋势,于2021—2035年呈下降趋势;2016—2035年各类用地的碳排放总量均呈下降趋势。2)人均产值对工业用地及商服用地的碳排放量均有驱动作用;用地能效对居住用地及交通用地的碳排放量均有驱动作用;产值密度对商服用地及交通用地的碳排放量均有抑制作用;能源结构对居住用地的碳排放量有抑制作用;用地能效对工业用地的碳排放量有抑制作用。
在此基础上,构建用地结构优化方案,在基本满足经济发展要求的同时降低碳排放量。提出涵盖“优化产业结构—调整能源结构—提升用地能效”三位一体的策略,以期丰富和完善基于用地类型的城区碳排放核算与低碳土地利用规划方法体系,为未来土地利用低碳规划提供支持。
胡苗芬 , 闫水玉 . 基于用地类型的城区碳排放动态分析及低碳土地使用规划——以重庆蔡家智慧新城为例[J]. 风景园林, 2026 , 33(1) : 67 -76 . DOI: 10.3724/j.fjyl.LA20250443
As the core spatial unit responsible for supporting fundamental urban operations, urban areas accommodate a wide range of human activities—residential, industrial, commercial, and transportation—each associated with specific land use types. The functional operation of these different land use types dominates the majority of urban energy consumption and carbon emissions, making them the primary sources of urban carbon output and critical units for systematic low-carbon land use planning. Achieving the national “dual-carbon” strategic goals (“carbon peak and carbon neutrality” ) requires precise carbon emission management and effective planning interventions at the urban area scale. However, existing research on carbon emissions accounting and driving mechanisms remains largely concentrated at the national, provincial, or municipal levels, with limited focus on the urban scale and insufficient linkage to specific land use types. This gap hinders the formulation of targeted, spatially explicit low-carbon land use planning strategies. Therefore, it is of critical importance to conduct fine-grained accounting of carbon emissions from different land use types within urban areas, analyze their spatiotemporal dynamics and evolutionary characteristics, and identify the underlying driving mechanisms. These works provide a scientific basis and decision support for achieving low-carbon urban development and refining land use planning strategies.
This study selects the Caijia Smart New City—a typical and representative urban unit within Chongqing—as the research object. We constructed an urban-scale carbon emissions accounting model that integrates “Human Activity−Land Use Type−Carbon Emissions.” This framework systematically links socioeconomic activities to their corresponding land use categories, enabling accurate attribution of carbon emissions. Based on this model, we calculated the actual carbon emissions for four key land use modules—residential, industrial, commercial service, and transportation—for the years 2016 and 2021. Furthermore, carbon emissions for the year 2035 were projected under the planned land use plan. The analysis compared changes across multiple dimensions: total carbon emissions driven by shifts in land use types, total emissions from different land use categories, carbon emission intensity (emissions per unit area), carbon intensity per unit of GDP, and per capita carbon emission intensity. To delve into the driving forces behind these changes, the logarithmic mean divisia index (LMDI) decomposition method was employed. This technique quantitatively analyzes the temporal evolution and contribution rates of key driving factors—including land use scale, economic development level, and population concentration—to changes in land use carbon emissions. Subsequently, guided by multi-objective planning principles, the LINGO mathematical optimization software was utilized to develop a land use structure optimization model. With the dual objective functions of economic benefit maximization and carbon emission minimization, and under a set of constraints reflecting local natural conditions and development policies, this study derived an optimized land use structure scheme for Chongqing’s Caijia Smart New City for the target year of 2035.
1) The carbon emission intensity of industrial land in Caijia Smart New City is the largest and shows a continuous downward trend, while other land use show an upward trend from 2016 to 2021 and a downward trend from 2021 to 2035; the total amount of carbon emissions from land use, carbon emissions per unit of gross domestic product (GDP), and the total amount of carbon emissions per capita show a downward trend; 2) Per capita output value has a pulling effect on industrial land and commercial land; the energy efficiency of land use has a pulling effect on residential land; and the energy efficiency of land use has a pulling effect on residential land; 3) Per capita output value has a pulling effect on industrial land and commercial land; land use energy efficiency has a pulling effect on residential land and transportation land; output value density has an inhibiting effect on commercial land and transportation land; energy structure has an inhibiting effect on residential land; land use energy efficiency has an inhibiting effect on industrial land.
Based on the accounting and decomposition results, an optimized land use structure plan was constructed using the multi-objective optimization model. Compared to the 2035 land use planning plan, the optimized plan achieves a reduction in per capita carbon emission by 0.07 ton/person while maintaining the same level of carbon emission per unit of GDP. This outcome demonstrates that the optimized scheme can effectively lower carbon emissions while largely satisfying the requirements of economic development. Finally, an integrated triple strategy encompassing “industrial structure optimization, energy structure adjustment, and land use energy efficiency improvement” is proposed. These strategies are targeted and elaborated specifically for industrial, residential, commercial service, and transportation land modules. This study aims to enrich and improve the methodological system for urban-scale carbon emission accounting and low-carbon land use planning based on land use types. The findings and framework provide theoretical support and practical guidance for future low-carbon-oriented land use planning and policy formulation in urban areas.
图1 “人类活动-用地类型-碳排放”关联机制与核算模型框架图Fig. 1 Framework diagram of the “human activities-land use types-carbon emissions” linkage |
| 指标 | 计算式 | 式注 |
|---|---|---|
| 工业用地、居住用地、商服用地碳排放量 | | C代表基准年份用地碳排放总量;ki代表折标系数;i代表不同能源类型;Ei代表i类能源的消耗量;di代表i类能源的碳排放系数;x代表居住用地、工业用地、商业与公共设施用地;SNx代表基准年x类用地面积;SPx代表规划方案x类用地面积;Px代表x类用地碳排放强度;D代表规划用地碳排放量 |
| 交通用地碳排放量 | | E为交通模块的碳排放总量;E1为城际交通碳排放量,E2为城市客运的碳排放量;q1i为i类交通方式的客运周转量;q2i为i类交通方式的货运周转量;hi代表客货换算系数;pi代表i类交通方式的单位里程碳排放系数;k 代表城际交通与城市交通的碳排放比值系数 |
| 用地碳排放总量 | Cz=Mi×Si | Cz代表碳排总量;Mi代表i类用地类型的碳排放强度;Si代表i类用地类型面积 |
| 碳排放强度 | Gi= | Ci为i类用地内人类活动产生的碳排放量;Gi为i类用地碳排放强度;Li为i类用地的面积 |
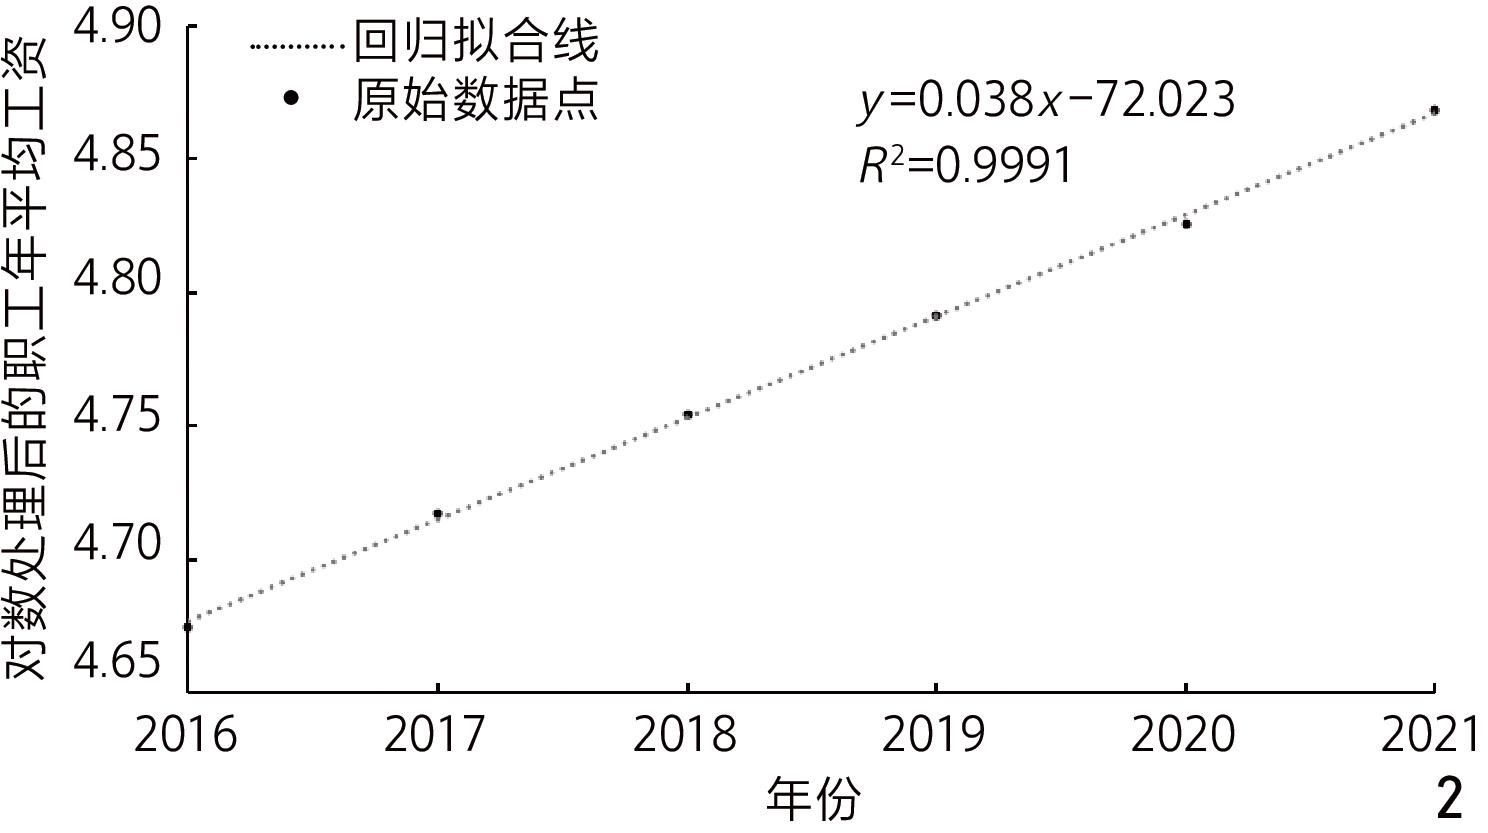
表2 蔡家智慧新城2016—2021年职工年平均工资Tab. 2 Average annual wages of employees in Caijia Smart New City from 2016 to 2021 |
| 年份 | 职工年平均工资/元 | 对数处理后数值 |
|---|---|---|
| 2016 | 47 305 | 4.67 |
| 2017 | 52 140 | 4.72 |
| 2018 | 56 758 | 4.75 |
| 2019 | 61 844 | 4.79 |
| 2020 | 66 978 | 4.82 |
| 2021 | 73 878 | 4.87 |
表3 不同用地碳排放量计算式[15-17]Tab. 3 Formulas for calculating carbon emissions/absorption from different modules[15-17] |
| 用地类型 | 碳排放量计算式 | 式注 |
|---|---|---|
| 居住用地 | | P表示人口数量; |
| 商服用地 | | |
| 工业用地 | | |
| 交通用地 | | P表示人口数量;z表示城际交通占城市交通碳排放的比例;j为交通类型; |
表4 城市各类用地碳排放分解模型[15-17]Tab. 4 Carbon emission decomposition model for various types of urban land use[15-17] |
| 类型 | 贡献值模型 | 贡献率模型 | 式注 |
|---|---|---|---|
| 居住用地 | ∆CR=∆CRA+∆CRB+ ∆CRD+∆CRF | DR=DRA×DRB×DRD×DRF | ∆CRA、DRA分别为居住用地的能源排放量和贡献率;∆CRB、DRB分别为居住用地的能源消耗量与总能源消耗量的比值和贡献率;∆CRD、DRD分别为居住用地能效和贡献率;∆CRF、DRF分别为人均居住用地面积和贡献率 |
| 工业用地、商服用地 | ∆CM=∆CMA+∆CMB+∆CMD+∆CMG+∆CMH | DM=DMA×DMB×DMD×DMG×DMH | ∆CMA、DMA分别为工业用地和商服用地的能源排放量和贡献率;∆CMB、DMB分别为工业用地和商服用地的能源消耗量与总能源消耗量的比值和贡献率;∆CMD、DMD分别为工业和商服用地能效和贡献率;∆CMG、DMG分别为工业和商服用地增加值产值密度和贡献率;∆CMH、DMH分别为工业用地和商服用地人均产值和贡献率 |
| 交通用地 | ∆CT=∆CTM+∆CTN+ ∆CTD+∆CTG+∆CTH | DT=DTM×DTN×DTD×DTG×DTH | ∆CTM、DTM分别为城际交通能源排放强度和贡献率;∆CTNT、DTN分别为城际各交通方式出行量与城际交通总出行量的比值和贡献率;∆CTD、DTD分别为单位城际交通用地周转量和贡献率;∆CTG、DTG分别为城际交通用地单位产值密度(倒数)和贡献率;∆CTH、DTH分别为人均交通产值和贡献率 |
表5 蔡家智慧新城建设用地碳排放强度Tab. 5 Carbon emission intensity of construction land in Caijia Smart New City |
| 年份 | 工业用地 | 商业服务业、公共服务及 公用设施用地 | 交通与仓储用地 | 居住用地 |
|---|---|---|---|---|
| 2016 | 1 118.98 | 15.05 | 185.34 | 8.75 |
| 2021 | 769.63 | 17.79 | 186.59 | 9.95 |
| 2035 | 697.28 | 16.10 | 169.05 | 9.01 |
表6 2016年、2021年和2035年蔡家智慧新城各类用地面积与碳排放量Tab. 6 The land area and carbon emissions of various land types in Caijia Smart New City in 2016, 2021, and 2035 |
| 用地类型 | 2016年 | 2021年 | 2035年 | |||
|---|---|---|---|---|---|---|
| 用地面积/hm2 | 碳排放量/万t | 用地面积/hm2 | 碳排放量/万t | 用地面积/hm2 | 碳排放量/万t | |
| 工业用地 | 724.57 | 81.08 | 728.00 | 56.03 | 641.89 | 44.76 |
| 商业公共设施用地 | 42.32 | 0.06 | 491.51 | 0.87 | 947.15 | 1.53 |
| 交通用地 | 288.50 | 5.35 | 726.50 | 13.56 | 895.01 | 15.13 |
| 居住用地 | 682.26 | 0.60 | 1 227.69 | 1.22 | 2 379.51 | 2.14 |
| 公园绿地 | 145.44 | −0.08 | 270.34 | −0.14 | 506.12 | −0.30 |
| 耕地 | 2 044.83 | −1.03 | | −0.86 | 739.71 | −0.37 |
| 草地 | 221.36 | −0.02 | 44.16 | −0.004 | 42.27 | −0.07 |
| 林地 | 2 808.29 | −1.34 | 2 122.82 | −1.01 | 1 577.78 | −0.75 |
表7 2016—2021年用地碳排放影响因素对居住用地人均碳排放的作用Tab. 7 The influence of factors affecting land carbon emissions from 2016 to 2021 on the per capita carbon emissions of residential land |
| 年份 | 能源结构 | 用地能效 | 人均用地面积 | |||
|---|---|---|---|---|---|---|
| 贡献值 | 贡献率 | 贡献值 | 贡献率 | 贡献值 | 贡献率 | |
| 2016 | 0.000 | 1.000 | 0.000 | 1.000 | 0.000 | 1.000 |
| 2017 | −0.018 | 0.982 | 0.065 | 1.068 | 0.003 | 0.003 |
| 2018 | 0.015 | 1.014 | 0.087 | 1.083 | 0.065 | 0.065 |
| 2019 | 0.015 | 0.988 | 0.020 | 1.016 | 0.035 | 0.035 |
| 2020 | 0.011 | 1.009 | 0.010 | 1.008 | 0.018 | 0.018 |
| 2021 | 0.006 | 1.005 | −0.016 | 0.987 | 0.081 | 0.081 |
表8 2016—2021年用地碳排放影响因素对工业用地人均碳排放量的作用Tab. 8 The influence of factors affecting land carbon emissions from 2016 to 2021 on the per capita carbon emissions of industrial land |
| 年份 | 能源结构 | 用地能效 | 产值密度 | 人均产值 | ||||
|---|---|---|---|---|---|---|---|---|
| 贡献值 | 贡献率 | 贡献值 | 贡献率 | 贡献值 | 贡献率 | 贡献值 | 贡献率 | |
| 2016 | 0.000 | 1.000 | 0.000 | 1.000 | 0.000 | 1.000 | 0.000 | 1.000 |
| 2017 | 0.013 | 1.001 | −0.619 | 0.933 | −0.498 | 0.946 | 0.360 | 1.040 |
| 2018 | 0.040 | 1.004 | −0.249 | 0.971 | 0.089 | 1.010 | 0.037 | 1.004 |
| 2019 | 0.008 | 1.001 | −0.004 | 0.999 | 0.014 | 1.001 | 0.319 | 1.037 |
| 2020 | −0.004 | 0.999 | −1.548 | 0.836 | 0.540 | 1.064 | 0.504 | 1.060 |
| 2021 | −0.003 | 0.999 | −0.814 | 0.906 | −0.460 | 0.946 | 1.047 | 1.134 |
表9 2016—2021年用地碳排放影响因素对商服用地人均碳排放量的作用Tab. 9 The influence of the factors affecting land carbon emissions from 2016 to 2021 on the per capita carbon emissions of the commercial service land |
| 年份 | 能源结构 | 用地能效 | 产值密度 | 人均产值 | ||||
|---|---|---|---|---|---|---|---|---|
| 贡献值 | 贡献率 | 贡献值 | 贡献率 | 贡献值 | 贡献率 | 贡献值 | 贡献率 | |
| 2016 | 0.000 | 1.000 | 0.000 | 1.000 | 0.000 | 1.000 | 0.000 | 1.000 |
| 2017 | −0.047 | 0.958 | 0.005 | 1.004 | −0.122 | 0.894 | 0.138 | 1.136 |
| 2018 | 0.067 | 1.059 | 0.087 | 1.077 | −0.088 | 0.927 | 0.115 | 1.104 |
| 2019 | 0.002 | 1.002 | 0.048 | 1.038 | −0.124 | 0.908 | 0.144 | 1.118 |
| 2020 | 0.015 | 1.011 | −0.144 | 0.896 | 0.042 | 1.032 | 0.059 | 1.046 |
| 2021 | 0.014 | 1.010 | 0.176 | 1.132 | −0.095 | 0.935 | 0.158 | 1.117 |
表10 2016—2021年用地碳排放影响因素对交通用地人均碳排放量的作用Tab. 10 The influence of factors affecting land carbon emissions from 2016 to 2021 on the per capita carbon emissions of the transportation land |
| 年份 | 交通结构 | 用地能效 | 产值密度 | 人均产值 | ||||
|---|---|---|---|---|---|---|---|---|
| 贡献值 | 贡献率 | 贡献值 | 贡献率 | 贡献值 | 贡献率 | 贡献值 | 贡献率 | |
| 2016 | 0.000 | 1.000 | 0.000 | 1.000 | 0.000 | 1.000 | 0.000 | 1.000 |
| 2017 | 0.104 | 1.006 | 0.957 | 1.052 | −0.419 | 0.978 | 1.734 | 1.096 |
| 2018 | 0.091 | 1.004 | 0.360 | 1.017 | −0.180 | 0.991 | 1.077 | 1.053 |
| 2019 | −1.748 | 0.919 | −0.301 | 0.986 | 0.859 | 1.042 | −0.543 | 0.974 |
| 2020 | 1.012 | 1.053 | −4.824 | 0.783 | 4.210 | 1.239 | −0.624 | 0.969 |
| 2021 | −2.216 | 0.898 | 4.408 | 1.240 | −2.931 | 0.867 | 2.683 | 1.140 |
表11 蔡家智慧新城用地碳排放目标函数约束条件及取值范围Tab. 11 Constraints and value ranges of the carbon emission objective function for land use in Caijia Smart New City |
| 约束条件 | 约束值的取值范围 | 注释 |
|---|---|---|
| 土地总面积 | | 根据《重庆市北碚区国土空间分区规划(2021—2035年)》提到的关于生态环境保护、建设用地、非建设用地面积取值 |
| 生态环境保护 | x1+x2+x3+x4≥ | |
| 建设用地 | x5≥506 728≥x6≥642 2 380≥x7≥1 227 947≥x8≥491 895≥x9≥726 | |
| 园地保护 | x2≥292 | |
| 林地保护 | 2 123≥x3≥1 578 | |
| 草地保护 | x4≥42 | |
| 耕地保护 | x1≥740 | 永久基本农田线 |
| 人口规模 | [(x1+x2+x3+x4)/p1]+[(x5+x6+ x7+x8)/p2]≤P | 采用回归分析法对蔡家智慧新城2035年人均农林面积及人均建设用地面积进行计算,得出p1=0.016 hm2/人,p2= |
| 水域 | x10≥435 | 水域有重要的生态涵养功能,需加强对水域的重视和保护 |
| 未利用地面积 | x11≥310 | 无 |
表12 蔡家智慧新城不同目标的土地利用结构优化结果Tab. 12 The optimization results of land use structure for different goals in Caijia Smart New City |
| 目标 | 绿色空 间/hm2 | 工业用 地/hm2 | 居住用 地/hm2 | 商服用 地/hm2 | 道路交通 用地/hm2 | 土地利用净碳 排放量/万t | 经济效益/ 亿元 |
|---|---|---|---|---|---|---|---|
| 碳排放最小化 | | 642 | | 491 | 727 | 56.47 | 384.38 |
| 低效益、低碳排 | | 642 | | 491 | 727 | 57.50 | 384.20 |
| 中效益、中碳排 | | 642 | | 947 | 727 | 58.16 | 456.99 |
| 高效益、高碳排 | | 642 | | 947 | 861 | 60.44 | 469.63 |
| 经济效益最大化 | | 728 | | 947 | 861 | 66.37 | 481.72 |
表13 2016年现状、优化方案、2035年土地利用规划方案的面积及比例对比Tab. 13 Comparison of the area and proportion of the current situation in 2016, the optimization plan, and the land use planning scheme for 2035 |
| 地类 | 2021年 | 优化方案 | 2035年土地利用规划 | |||
|---|---|---|---|---|---|---|
| 面积/hm2 | 比例/% | 面积/hm2 | 比例/% | 面积/hm2 | 比例/% | |
| 绿色空间(含公园绿地、耕地、 林地、草地、园地) | 50.62 | 45.77 | 36.01 | |||
| 工业用地 | 728 | 8.31 | 642 | 7.32 | 642 | 7.32 |
| 居住用地 | | 14.01 | | 19.31 | | 27.15 |
| 商业服务业设施用地、公共服务 设施用地、公用设施用地 | 491 | 5.60 | 947 | 10.80 | 947 | 10.80 |
| 道路与交通设施用地与物流仓储用地 | 727 | 8.29 | 727 | 8.29 | 895 | 10.21 |
| 水域 | 812 | 9.26 | 435 | 4.96 | 435 | 4.96 |
| 未利用地 | 343 | 3.91 | 310 | 3.54 | 310 | 3.54 |
表14 蔡家智慧新城低碳优化方案与2035年土地利用规划方案的经济效益、碳排放量对比Tab. 14 Comparison of economic benefits and carbon emissions between the low-carbon optimization plan of Caijia Smart New City and the land use planning plan for 2035 |
| 用地类型 | 优化方案 | 2035年土地利用规划 | ||
|---|---|---|---|---|
| 经济效益/万元 | 碳排放量/t | 经济效益/万元 | 碳排放量/t | |
| 绿色空间(含公园绿地、耕地、 林地、草地、园地) | 260 941.29 | −17 984.07 | 284 643.79 | −15 082.94 |
| 工业用地 | 1 088 093.19 | 447 653.76 | 1 186 929.70 | 447 653.76 |
| 居住用地 | 964 705.89 | 15 253.93 | 1 052 334.56 | 21 443.80 |
| 商业服务业设施、公共服务设施、公用设施用地 | 1 146 130.92 | 15 246.70 | 1 250 239.26 | 15 246.70 |
| 道路与交通设施用地与物流仓储用地 | 1 101 802.89 | 122 730.30 | 1 201 884.71 | 151 299.75 |
| 水域 | 8 225.82 | −1 100.55 | 8 973.01 | − |
| 未利用地 | 0 | −124.00 | 0 | −124.00 |
| 合计 | 4 569 900.00 | 581 676.07 | 4 985 005.02 | 619 333.52 |
1、解析碳排放时空分布特征:明确城区用地功能运行主导能源消耗与碳排放,核算其时空特征与驱动机制,是制定低碳土地规划策略及支撑国家“双碳”战略的关键前提。
2、构建核算模型:创新构建“人类活动-用地类型-碳排放”的城区尺度碳排放关联机制与核算模型,对比多年份由用地类型变化引发的碳排放量差异,并解析其影响因素,为低碳规划提供数据支撑。
3、优化用地结构与实效:基于多目标规划原理,运用LINGO软件构建用地结构优化方案,该方案在保障经济效益的同时,将蔡家智慧新城的人均碳排放量较常规规划减少0.07 t/人。
| [1] |
徐可西, 詹冰倩, 姜春, 等. 碳排放约束下的城市空间格局优化: 理论框架、指标体系与实践路径[J]. 自然资源学报, 2024, 39(3): 682-696.
XU K X, ZHAN B Q, JIANG C, et al. Optimization of Urban Spatial Pattern Under Carbon Emission Constraints: Theoretical Framework, Index System and Practical Paths[J]. Journal of Natural Resources, 2024, 39(3): 682-696.
|
| [2] |
张鑫, 任云英. 基于夜间灯光数据的国家级新区碳排放核算和时空分布特征: 以青岛西海岸新区为例[J]. 现代城市研究, 2023, 38(9): 104-112.
ZHANG X, REN Y Y. Carbon Emission Accounting and Spatiotemporal Distribution Characteristics of a National-Level New Area Based on Nighttime Lighting Data: A Case Study of Qingdao West Coast New Area[J]. Modern Urban Research, 2023, 38(9): 104-112.
|
| [3] |
GE Q S, DAI J H, HE F N, et al. Land Use Changes and Their Relations with Carbon Cycles over the Past 300 a in China[J]. Science in China Series D: Earth Sciences, 2008, 51(6): 871-884.
|
| [4] |
董祚继. 低碳概念下的国土规划[J]. 城市发展研究, 2010, 17(7): 1-5.
DONG Z J. The Territorial Planning Under the Concept of Low-Carbon[J]. Urban Studies, 2010, 17(7): 1-5.
|
| [5] |
HOUGHTON R A. Tropical Deforestation and Atmospheric Carbon Dioxide[M]//MYERS N. Tropical Forests and Climate. Dordrecht: Springer Netherlands, 1991: 99-118.
|
| [6] |
HOWARTH R B, SCHIPPER L, DUERR P A, et al. Manufacturing Energy Use in Eight OECD Countries: Decomposing the Impacts of Changes in Output, Industry Structure and Energy Intensity[J]. Energy Economics, 1991, 13(2): 135-142.
|
| [7] |
ANG B W, CHOI K H. Decomposition of Aggregate Energy and Gas Emission Intensities for Industry: A Refined Divisia Index Method[J]. The Energy Journal, 1997, 18(3): 59-73.
|
| [8] |
姜勇.中国碳排放与经济增长关系及其影响因素的实证研究[D].重庆: 重庆大学, 2014.
JIANG Y. The Empirical Study on the Relationships Between Carbon Emissions and Economic Growth in China and It's Influencing Factors[D]. Chongqing: Chongqing University, 2014.
|
| [9] |
王晓霞.陕西省土地利用碳排放效应及影响因素研究[D].杨凌: 西北农林科技大学, 2014
WANG X X. Research of Carbon Emission Effects and Factors of Land Use in Shaanxi Province[D]. Yangling: Northwest A & F University, 2014.
|
| [10] |
张伟.广州市土地利用碳排放核算及影响因素研究[D].广州: 华南农业大学, 2016.
ZHANG W. A Study on the Accounting and Effect Analysis of Land-Use Carbon Emissions in Guangzhou[D]. Guangzhou: South China Agricultural University, 2016.
|
| [11] |
ZOMER R J, TRABUCCO A, BOSSIO D A, et al. Climate Change Mitigation: A Spatial Analysis of Global Land Suitability for Clean Development Mechanism Afforestation and Reforestation[J]. Agriculture, Ecosystems & Environment, 2008, 126(1/2): 67-80.
|
| [12] |
赖力.中国土地利用的碳排放效应研究[D].南京: 南京大学, 2010.
LAI L. Carbon Emission Effect of Land Use in China[D]. Nanjing: Nanjing University, 2010.
|
| [13] |
任奎, 周生路, 张红富, 等. 基于精明增长理念的区域土地利用结构优化配置: 以江苏宜兴市为例[J]. 资源科学, 2008, 30(6): 912-918.
REN K, ZHOU S L, ZHANG H F, et al. Optimization of Regional Land Use Based on Smart Growth[J]. Resources Science, 2008, 30(6): 912-918.
|
| [14] |
刘海猛, 石培基, 王录仓, 等. 低碳目标导向的兰州市土地利用结构优化研究[J]. 中国土地科学, 2012, 26(6): 55-61.
LIU H M, SHI P J, WANG L C, et al. Optimizing Land Use Structure for Low Carbon Target: A Case Study in Lanzhou of Gansu Province[J]. China Land Sciences, 2012, 26(6): 55-61.
|
| [15] |
重庆市北碚区人民政府. 重庆市北碚区国土空间分区规划(2021—2035年)[EB/OL]. (2024-06-30)[2025-12-06]. https://www.cq.gov.cn/zwgk/zfxxgkml/szfwj/qtgw/202407/t20240709_13357642.html.
Beibei District People's Government of Chongqing. Territorial Space Zoning Plan of Beibei District, Chongqing (2021−2035) [EB/OL]. (2024-06-30)[2025-12-06]. https://www.cq.gov.cn/zwgk/zfxxgkml/szfwj/qtgw/202407/t20240709_13357642.html.
|
| [16] |
黄肇义. 低碳城市交通规划理论与实践[J]. 理想空间, 2013(1): 30-33.
HUANG Z Y. Theory and Practice of Low-Carbon Urban Transportation Planning[J]. Ideal Space, 2013(1): 30-33.
|
| [17] |
顾朝林, 袁晓辉. 中国城市温室气体排放清单编制和方法概述[J]. 城市环境与城市生态, 2011, 24(1): 1-4.
GU C L, YUAN X H. Urban Greenhouse Gas Inventory and Methods in China[J]. Urban Environment & Urban Ecology, 2011, 24(1): 1-4.
|
| [18] |
吴烨, 尹应梅, 肖宇, 等. “双碳”目标下广州市交通碳排放量驱动因素和预测分析[J]. 环境科学研究, 2025, 38(10): 2147-2154.
WU Y, YIN Y M, XIAO Y, et al. Driving Factors and Predictive Analysis of Transportation Carbon Emissions Under the ‘Dual Carbon' Goals in Guangzhou[J]. Research of Environmental Sciences, 2025, 38(10): 2147-2154.
|
| [19] |
宋丹, 姜琦刚. 总部经济园土地利用效益潜力分析及对策[J]. 中国人口·资源与环境, 2015, 25(S1): 50-52.
SONG D, JIANG Q G. Land Use Benefit Potential and Countermeasures of Headquarters Economy Park[J]. China Population, Resources and Environment, 2015, 25(S1): 50-52.
|
| [20] |
陈飞, 徐鹤, 李永贺. 长三角地区城市密度对碳排放绩效的影响效应与机制[J]. 生态学报, 2024, 44(10): 4092-4104.
CHEN F, XU H, LI Y H. Low-Carbon Development Effects and Mechanisms of Urban Density in the Yangtze River Delta Region[J]. Acta Ecologica Sinica, 2024, 44(10): 4092-4104.
|
| [21] |
潘海啸. 面向低碳的城市空间结构: 城市交通与土地使用的新模式[J]. 城市发展研究, 2010, 17(1): 40-45.
PAN H X. Urban Spatial Structure Towards Low Carbon: New Urban Transport and Land Use Model[J]. Urban Studies, 2010, 17(1): 40-45.
|
| [22] |
王睿, 柯嘉, 张赫. 基于职住分离的超大特大城市交通拥堵碳排放机理研究: 以天津市“郊住城职”现象为例[J]. 上海城市规划, 2023(6): 33-39.
WANG R, KE J, ZHANG H. The Carbon Emission Mechanism of Traffic Congestion in Mega Cities Caused by Job-Housing Imbalance: A Case Study of Commuting Behavior from Suburban Housing to Urban Workplaces in Tianjin[J]. Shanghai Urban Planning Review, 2023(6): 33-39.
|
| [23] |
陈天, 耿慧志, 陆化普, 等. 低碳绿色的城市更新模式[J]. 城市规划, 2023, 47(11): 32-39.
CHEN T, GENG H Z, LU H P, et al. Green and Low-Carbon Urban Regeneration[J]. City Planning Review, 2023, 47(11): 32-39.
|
/
| 〈 |
|
〉 |