
闽三角城市群景观生态风险时空演变分析
|
卓健/男/博士/同济大学建筑与城市规划学院教授、博士生导师、规划系主任/高密度人居环境生态与节能教育部重点实验室成员/研究方向为国土空间治理与专项规划编制、可持续城市交通机动性、城乡韧性与可适应规划 |
|
翟端强/男/博士/同济大学建筑与城市规划学院在站博士后/上海同济城市规划设计研究院有限公司创研中心副研究员/自然资源部国土空间智能规划技术重点实验室成员/研究方向为国土空间治理 |
|
毛衍云/男/同济大学城市交通研究院在读硕士研究生/研究方向为城乡适应性规划 |
收稿日期: 2024-01-16
修回日期: 2024-07-25
网络出版日期: 2025-12-16
基金资助
国家自然科学基金面上项目“基于空间冲突机制的区域生态空间与农业空间规划管控体系优化研究——以长三角地区为例”(52178051)
国家重点研发计划项目(2023YFC3803903)
高密度人居环境生态与节能教育部重点实验室(同济大学)暨上海同济城市规划设计研究院有限公司联合自主课题(KY-2022-LH-A06)
版权
Analysis of Spatiotemporal Evolution of Landscape Ecological Risk in the Fujian Delta Urban Agglomeration
|
ZHUO Jian, Ph.D., is a professor and doctoral supervisor in and director of the Department of Urban Planning, College of Architecture and Urban Planning (CAUP), Tongji University, and a member of the Key Laboratory of Ecology and Energy Saving Study of Dense Habitat, Ministry of Education. His research focuses on territorial spatial governance and specialized planning, sustainable urban mobility, urban-rural resilient and adaptive planning |
|
ZHAI Duanqiang, Ph.D., is a postdoctoral researcher in the College of Architecture and Urban Planning (CAUP), Tongji University, an associate research fellow in Innovation and Research Center, Shanghai Tongji Urban Planning & Design Institute Co., Ltd., and a member of the Key Laboratory of Spatial Intelligent Planning Technology, Ministry of Natural Resources. His research focuses on territorial spatial governance |
|
MAO Yanyun is a master student in the Urban Mobility Institute, Tongji University. His research focuses on urban and rural adaptive planning |
Received date: 2024-01-16
Revised date: 2024-07-25
Online published: 2025-12-16
Copyright
【目的】闽三角城市群等沿海经济发达地区在土地利用演化过程中面临生态功能退化、生态空间碎片化的风险。揭示闽三角城市群土地利用与景观格局演化规律,为闽三角城市群生态空间管控优化与土地资源合理配置提供科学参考。【方法】以2000—2020年土地利用变化数据为基础,分析闽三角城市群的土地利用动态度、土地利用类型转移矩阵等土地利用变化特征,明确景观格局变化特征,最后利用景观格局指数构建景观生态风险评价模型,获取景观生态风险时空分布特征,并识别出城市群景观生态风险空间聚集的冷热点。【结果】2000—2020年,闽三角城市群土地利用类型转移的重点是耕地向林地、建设用地转移,景观生态格局破碎化程度加重,景观生态风险等级先降低再升高。厦门、漳州、泉州三市的景观生态风险分别呈现“稳定可控”“轻度失控”和“基本可控”的特征,“低-低”和“高-高”聚集类型分别分布在区域西北内陆和东南沿海地区。【结论】基于景观生态风险评估模型的总体分析方法,实现了闽三角城市群土地利用空间信息的定量化表达,并基于景观生态风险时空分布特征及空间集聚冷热点识别结果,有效揭示了研究区域景观生态风险的关联图式及分异规律,为闽三角城市群化解景观生态风险提供技术支撑。
卓健 , 翟端强 , 毛衍云 . 闽三角城市群景观生态风险时空演变分析[J]. 风景园林, 2024 , 31(9) : 111 -119 . DOI: 10.3724/j.fjyl.202401160038
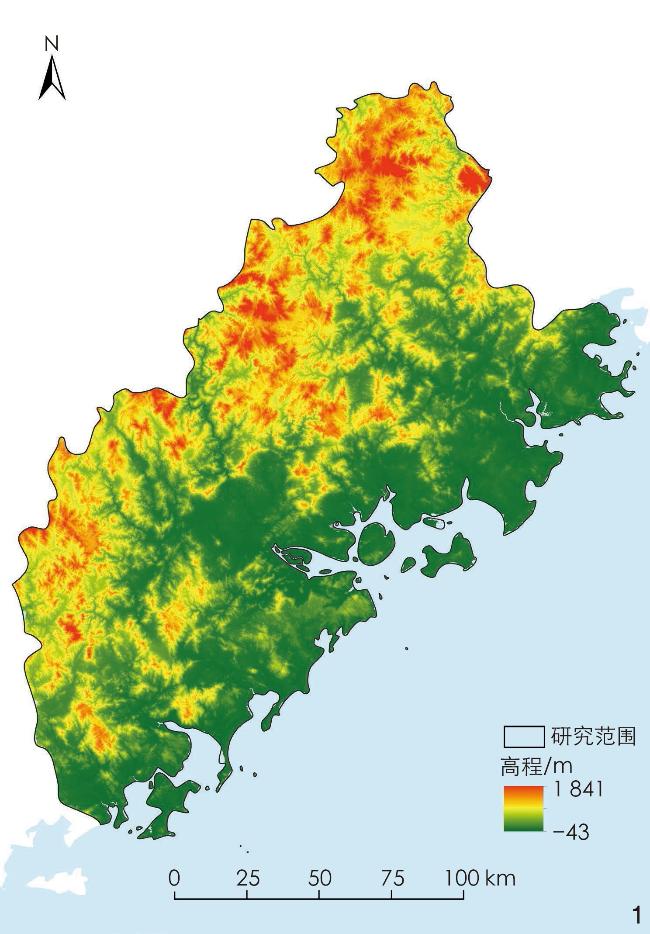
[Objective] Urban agglomerations, as advanced spatial organizational forms resulting from urbanization reaching a certain level, serve as the primary centers of human economic activities and, simultaneously, sensitive areas vulnerable to ecological disturbances. With escalating conflicts between human activities and ecological constraints, urban agglomerations face challenges of ecological space fragmentation, posing intricate issues in ecological risk management. As a typical coastal urban agglomeration with developed economy, the Fujian Delta Urban Agglomeration is dominated by low hills with diverse yet fragile ecological elements. Its ecological services have been compromised, exacerbating conflicts between land resource supply and demand, leading to risks of ecological function degradation and spatial fragmentation during land use evolution. Predicting and mitigating landscape ecological risks in this region are fundamental prerequisites for optimizing land resource allocation and maintaining ecological security. This research aims to construct a landscape ecological risk assessment model using landscape pattern indices to unveil the patterns of land use and landscape pattern evolution in the Fujian Delta Urban Agglomeration, thus providing scientific references for optimizing ecological spatial control and rational land resource allocation.
[Methods] Taking the Fujian Delta Urban Agglomeration as the research area, this research adopts the data on land use change during the period from 2000 to 2020 as the basis for assessing landscape ecological risks by a grid-based method. To determine the optimal evaluation unit scale, emphasis is placed on precise grid division and rapid calculation. Considering the area of the research area, a 500 m × 500 m fishnet grid is chosen as the basic evaluation unit, increasing by 500 m for each subsequent test. Results show that a 3 km × 3 km basic unit achieves a balance between computational accuracy and speed, thus confirmed as the foundational evaluation unit. Integrated software including Archaist, Frag stats and Geode are employed comprehensively to analyze land use dynamicity, land use type transition matrices, and landscape pattern changes. Constructed from disturbance index, vulnerability index, and loss index, the ecological risk index (ERI) can effectively analyze landscape heterogeneity and ecosystem dynamicity. Additionally, the hotspot analysis method is employed to distinguish the degree of spatial distribution aggregation and reflect high-value clusters and low-value clusters in local spatial regions, namely hot spots and cold spots, thus reviewing the spatial clustering distribution characteristics of the Fujian Delta Urban Agglomeration. Ultimately, the spatiotemporal distribution characteristics of landscape ecological risks and the aggregation of cold and hot spots are summarized.
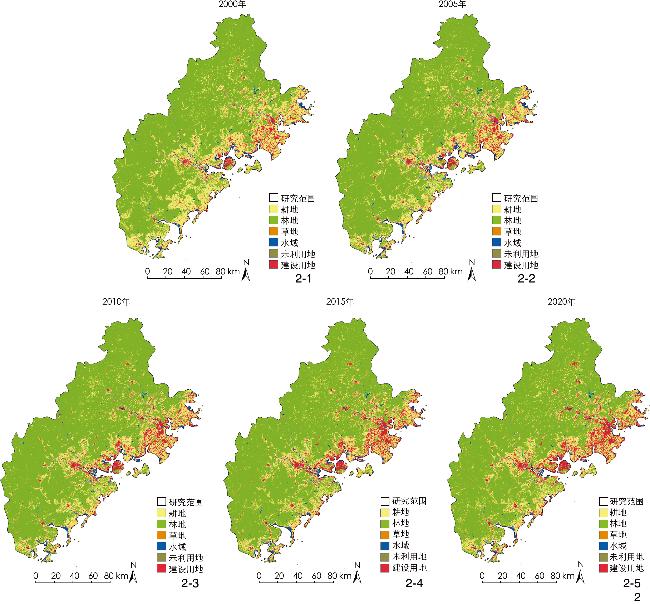
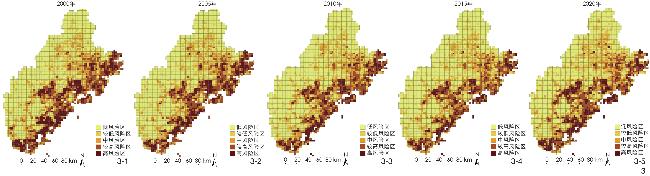
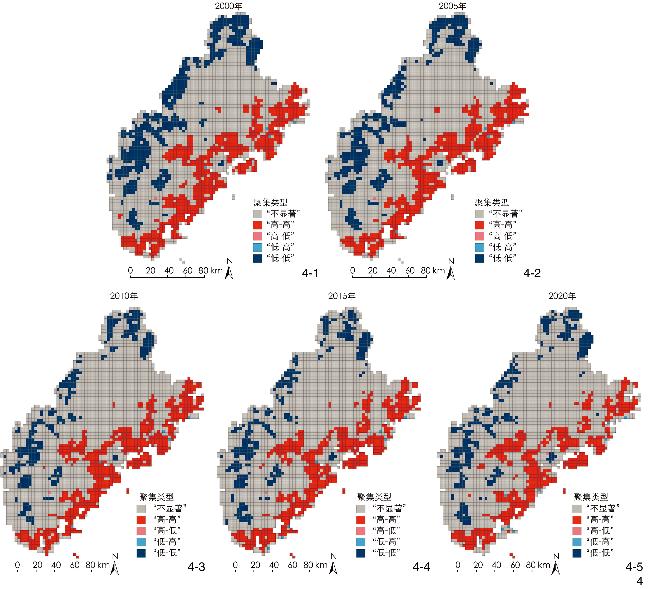
[Results] 1) From 2000 to 2020, the primary land use transition in the Fujian Delta Urban Agglomeration was the conversion from arable land to forest land and construction land, with the overall trend of land use evolution shifting towards institutionalization. The evolution rate of land use dynamicity notably accelerated after 2010, mainly attributed to the promulgation of the Overall Plan for Urban Integration Development in the Xiamen-Zhangzhou-Quanzhou Metropolitan Area in 2015, which aims to achieve basic urban integration featuring the high integration of industry, space and society by 2020, thus accelerating the urbanization process in the Fujian Delta Urban Agglomeration region. 2) In terms of the evolution of landscape pattern evolution, arable land faced the most severe fragmentation risk, while forests underwent a trend towards large-scale conversion. The fragmentation degree of grasslands and water bodies initially increased and then decreased, with a decrease in the complexity of spatial form changes. The patchiness of construction land shifted from simple to complex after 2015. 3) In terms of the evolution of landscape ecological risk, influenced by intense human development activities, the ecological risks in coastal and southeastern regions were significantly higher than in other inland areas. Xiamen, Zhangzhou, and Quanzhou exhibited ecological risks “stable and controllable”, “slightly out of control”, and “basically controllable”, respectively. 4) In terms of the analysis of hot and cold spots with respect to the spatial aggregation of landscape ecological risk, the overall distribution of landscape ecological risks in the Fujian Delta Urban Agglomeration exhibited significant spatial heterogeneity, with areas with relatively high or relatively low risk indices more likely to aggregate. “Low-low” and “high-high” aggregation types were distributed in the northwestern inland and southeastern coastal areas, respectively.
[Conclusion] This research confirms the significant spatial heterogeneity of landscape ecological risks in the Fujian Delta Urban Agglomeration, achieving a quantitative expression of spatial information on land use in the region. Through the analysis of the spatiotemporal distribution characteristics of landscape ecological risks and the spatial aggregation of cold and hot spots, a refined visualization analysis of multidimensional risk prediction effectively reveals the associative patterns and differentiation rules of landscape ecological risks in the research area. The research proposes a method for applying the landscape ecological risk assessment model to analyze the overall distribution characteristics of landscape ecological risks in the region, which can facilitate the integration of scale effects and spatiotemporal effects to rapidly identify areas of risk mismanagement. Leveraging the data on land use change, this research effectively screens and preliminarily assesses regional landscape ecological risks, overcoming the inherent problems of traditional indicator systems based on the relationship between risk sources and exports such as subjectivity, complexity, and reliance on large amounts of natural, social, and economic data. The research simplifies data requirements, focusing on “dynamicity changes in land use” as a key representation directly reflecting the root conditions of landscape ecological risks. The proposed method only requires adjustments to the granularity of land use data to analyze the spatial differentiation characteristics of landscape ecological risks from urban to national scales.
表1 2000—2020年闽三角城市群土地利用类型面积及占比转移矩阵Tab. 1 Transition matrix of area and share of land use types in the Fujian Delta Urban Agglomeration from 2000 to 2020 |
| 时段 | 景观类型 | 土地利用景观类型面积(km2)/比例(%) | |||||
| 耕地 | 林地 | 草地 | 水域 | 未利用地 | 建设用地 | ||
| 2000— 2005年 | 耕地 | 5 562.03/80.27 | 1 145.27/16.53 | 25.40/0.37 | 62.64/0.90 | 0.07/0.00 | 133.98/1.93 |
| 林地 | 266.64/1.55 | 16 890.88/98.42 | 1.01/0.01 | 0.05/0.00 | 0.00/0.00 | 3.16/0.02 | |
| 草地 | 13.21/27.36 | 5.61/11.61 | 24.87/51.50 | 0.92/1.91 | 0.51/1.06 | 3.16/6.55 | |
| 水域 | 18.53/3.27 | 2.68/0.47 | 2.87/0.51 | 531.31/93.64 | 0.40/0.07 | 11.61/2.05 | |
| 未利用地 | 0.99/15.95 | 0.00/0.03 | 0.73/11.74 | 0.09/1.46 | 3.42/54.96 | 0.99/15.86 | |
| 建设用地 | 0.02/0.00 | 0.00/0.00 | 0.00/0.00 | 10.77/0.96 | 0.00/0.00 | 1 112.19/99.04 | |
| 2005— 2010年 | 耕地 | 5 052.59/86.20 | 515.65/8.80 | 13.86/0.24 | 33.10/0.56 | 1.54/0.03 | 244.69/4.17 |
| 林地 | 495.43/2.75 | 17 538.81/97.20 | 0.40/0.00 | 0.05/0.00 | 0.00/0.00 | 9.74/0.05 | |
| 草地 | 12.70/23.14 | 3.33/6.06 | 22.87/41.67 | 0.84/1.53 | 3.33/6.06 | 11.82/21.53 | |
| 水域 | 29.11/4.81 | 2.63/0.43 | 2.41/0.40 | 535.95/88.47 | 4.41/0.73 | 31.28/5.16 | |
| 未利用地 | 0.44/10.00 | 0.00/0.00 | 0.11/2.47 | 0.05/1.18 | 3.00/68.08 | 0.80/18.29 | |
| 建设用地 | 0.07/0.01 | 0.00/0.00 | 0.00/0.00 | 8.63/0.68 | 0.00/0.00 | 1 256.39/99.31 | |
| 2010— 2015年 | 耕地 | 4 985.29/89.18 | 371.52/6.65 | 10.39/0.19 | 18.83/0.34 | 0.11/0.00 | 204.20/3.65 |
| 林地 | 621.88/3.44 | 17 426.26/96.49 | 0.41/0.00 | 0.03/0.00 | 0.00/0.00 | 11.83/0.07 | |
| 草地 | 12.44/31.39 | 1.64/4.15 | 15.66/39.51 | 0.49/1.25 | 1.31/3.32 | 8.08/20.39 | |
| 水域 | 45.51/7.87 | 1.63/0.28 | 1.26/0.22 | 505.84/87.42 | 4.29/0.74 | 20.10/3.47 | |
| 未利用地 | 1.81/14.73 | 0.00/0.01 | 0.53/4.33 | 0.08/0.61 | 7.71/62.81 | 2.15/17.51 | |
| 建设用地 | 0.05/0.00 | 0.00/0.00 | 0.01/0.00 | 7.04/0.45 | 0.05/0.00 | 1 547.57/99.54 | |
| 2015— 2020年 | 耕地 | 4 833.32/85.29 | 465.39/8.21 | 4.54/0.08 | 30.39/0.54 | 1.39/0.02 | 331.95/5.86 |
| 林地 | 890.87/5.00 | 16 885.55/94.86 | 1.76/0.01 | 6.04/0.03 | 0.09/0.00 | 16.74/0.09 | |
| 草地 | 9.48/33.56 | 3.94/13.95 | 6.92/24.50 | 0.61/2.17 | 0.93/3.29 | 6.37/22.53 | |
| 水域 | 80.01/15.03 | 9.01/1.69 | 1.05/0.20 | 386.24/72.56 | 4.35/0.82 | 51.65/9.70 | |
| 未利用地 | 2.10/15.58 | 0.07/0.54 | 0.32/2.35 | 2.79/20.68 | 5.12/37.98 | 3.08/22.88 | |
| 建设用地 | 139.89/7.80 | 8.64/0.48 | 0.81/0.05 | 24.80/1.38 | 1.01/0.06 | 1 618.77/90.24 | |
表2 2000—2020年闽三角城市景观格局类型水平指数变化Tab. 2 Changes of landscape patten type level index in the Fujian Delta Urban Agglomeration from 2000 to 2020 |
| 年份 | 类型 | 斑块个数 | 斑块密度/ 个·km-2 | 景观形状 指数 | 平均斑块 面积/km2 | 分维数 | 破碎度 | 分离度 |
| 2000 | 耕地 | 84 635 | 1.413 | 336.258 | 7.990 | 1.434 | 1.413 | 0.999 |
| 林地 | 41 622 | 0.695 | 157.161 | 40.162 | 1.400 | 0.695 | 0.934 | |
| 草地 | 15 473 | 0.258 | 139.856 | 0.305 | 1.469 | 0.258 | 1.000 | |
| 水域 | 9 169 | 0.153 | 105.993 | 6.046 | 1.376 | 0.153 | 1.000 | |
| 建设用地 | 33 572 | 0.560 | 227.232 | 3.263 | 1.374 | 0.560 | 1.000 | |
| 未利用地 | 1 175 | 0.020 | 39.775 | 0.520 | 1.460 | 0.020 | 1.000 | |
| 2005 | 耕地 | 93 011 | 1.553 | 366.097 | 6.149 | 1.441 | 1.553 | 0.999 |
| 林地 | 30 294 | 0.506 | 149.815 | 58.027 | 1.402 | 0.506 | 0.926 | |
| 草地 | 34 172 | 0.570 | 226.431 | 3.611 | 1.371 | 0.570 | 1.000 | |
| 水域 | 9 775 | 0.163 | 110.990 | 6.055 | 1.380 | 0.163 | 1.000 | |
| 建设用地 | 13 262 | 0.221 | 136.278 | 0.405 | 1.464 | 0.221 | 1.000 | |
| 未利用地 | 961 | 0.016 | 37.035 | 0.449 | 1.466 | 0.016 | 1.000 | |
| 2010 | 耕地 | 86 764 | 1.448 | 365.704 | 6.287 | 1.436 | 1.448 | 1.000 |
| 林地 | 30 604 | 0.511 | 137.353 | 57.490 | 1.391 | 0.511 | 0.929 | |
| 草地 | 13 088 | 0.219 | 132.355 | 0.297 | 1.474 | 0.219 | 1.000 | |
| 水域 | 36 453 | 0.609 | 239.586 | 4.160 | 1.383 | 0.609 | 1.000 | |
| 建设用地 | 11 329 | 0.189 | 116.015 | 4.992 | 1.380 | 0.189 | 1.000 | |
| 未利用地 | 2 778 | 0.046 | 61.012 | 0.433 | 1.453 | 0.046 | 1.000 | |
| 2015 | 耕地 | 89 829 | 1.499 | 394.630 | 6.155 | 1.440 | 1.499 | 1.000 |
| 林地 | 33 388 | 0.557 | 149.010 | 51.941 | 1.382 | 0.557 | 0.927 | |
| 草地 | 10 787 | 0.180 | 118.284 | 0.256 | 1.472 | 0.180 | 1.000 | |
| 水域 | 38 099 | 0.636 | 249.161 | 4.594 | 1.389 | 0.636 | 1.000 | |
| 建设用地 | 12 182 | 0.203 | 118.778 | 4.270 | 1.385 | 0.203 | 1.000 | |
| 未利用地 | 2 984 | 0.050 | 62.174 | 0.443 | 1.461 | 0.050 | 1.000 | |
| 2020 | 耕地 | 89 160 | 1.442 | 394.393 | 6.520 | 1.420 | 1.442 | 1.000 |
| 林地 | 35 198 | 0.569 | 151.662 | 48.075 | 1.361 | 0.569 | 0.935 | |
| 草地 | 6 995 | 0.113 | 92.585 | 0.214 | 1.466 | 0.113 | 1.000 | |
| 水域 | 12 080 | 0.195 | 113.696 | 3.649 | 1.380 | 0.195 | 1.000 | |
| 建设用地 | 38 169 | 0.617 | 251.798 | 5.185 | 1.386 | 0.617 | 1.000 | |
| 未利用地 | 3 057 | 0.049 | 62.984 | 0.412 | 1.449 | 0.049 | 1.000 |
图3 2000—2020年闽三角城市群景观生态风险空间分布Fig. 3 Spatial distribution of landscape ecological risk in the Fujian Delta Urban Agglomeration from 2000 to 2020 |
表3 2000—2020年闽三角城市群景观生态风险区面积Tab. 3 Area of each type of landscape ecological risk area in the Fujian Delta Urban Agglomeration from 2000 to 2020 |
| 年份 | 城市 | 低风险区/km2 | 较低风险区/km2 | 中风险区/km2 | 较高风险区/km2 | 高风险区/km2 |
| 2000 | 厦门市 | 229.91 | 292.05 | 156.83 | 240.79 | 695.30 |
| 漳州市 | 5 221.78 | 1 996.76 | 1 482.76 | 1 397.18 | 2 698.61 | |
| 泉州市 | 3 918.21 | 2 712.18 | 1 668.87 | 1 266.09 | 1 858.69 | |
| 总计 | 9 369.91 | 5 000.99 | 3 308.46 | 2 904.06 | 5 252.59 | |
| 2005 | 厦门市 | 410.66 | 168.67 | 206.49 | 238.87 | 590.19 |
| 漳州市 | 6 448.38 | 1 763.01 | 1 370.63 | 1 249.84 | 1 965.23 | |
| 泉州市 | 4 633.00 | 2 370.36 | 1 524.28 | 1 202.14 | 1 694.27 | |
| 总计 | 11 492.03 | 4 302.05 | 3 101.41 | 2 690.84 | 4 249.68 | |
| 2010 | 厦门市 | 418.12 | 245.52 | 163.63 | 297.14 | 490.48 |
| 漳州市 | | | | | | |
| 泉州市 | | | | | | |
| 总计 | 12 198.73 | 4 294.15 | 2 835.83 | 3 004.06 | 3 503.24 | |
| 2015 | 厦门市 | 431.29 | 252.56 | 202.94 | 303.61 | 424.48 |
| 漳州市 | 6 006.38 | 2 007.87 | 1 492.69 | 1 542.90 | 1 747.25 | |
| 泉州市 | 4 593.79 | 2 768.56 | 1 596.64 | 1 397.25 | 1 067.81 | |
| 总计 | 11 031.45 | 5 028.99 | 3 292.27 | 3 243.76 | 3 239.54 | |
| 2020 | 厦门市 | 430.65 | 307.08 | 269.20 | 298.95 | 308.99 |
| 漳州市 | 5 522.25 | 2 279.34 | 1 628.87 | 1 657.79 | 1 708.84 | |
| 泉州市 | 4 325.12 | 3 206.21 | 1 806.73 | 1 456.21 | 629.76 | |
| 总计 | 10 278.02 | 5 792.63 | 3 704.80 | 3 412.96 | 2 647.60 |
文中图表均由作者绘制,其中
| [1] |
方创琳. 中国城市群形成发育的新格局及新趋向[J]. 地理科学, 2011, 31(9): 1025-1034.
FANG C L. New Structure and New Trend of Formation and Development of Urban Agglomerations in China[J]. Scientia Geographica Sinica, 2011, 31(9): 1025-1034.
|
| [2] |
郑德高, 陆容立. 我国国家层面国土空间规划目标与战略的若干研究[J]. 上海城市规划, 2020(5): 63-70.
ZHENG D G, LU R L. Studies on Objectives and Strategies of National Territory Spatial Planning[J]. Shanghai Urban Planning Review, 2020(5): 63-70.
|
| [3] |
顾朝林. 科学的“双评价”是新时代国土空间规划的关键和基础[J]. 城市与区域规划研究, 2019, 11(2): 1-4.
GU C L. Scientific “Dual-Evaluation” as the Key and Foundation for Territorial Spatial Planning in the New Era[J]. Journal of Urban and Regional Planning, 2019, 11(2): 1-4.
|
| [4] |
田莉, 夏菁. 土地发展权与国土空间规划: 治理逻辑、政策工具与实践应用[J]. 城市规划学刊, 2021(6): 12-19.
TIAN L, XIA J. Land Development Rights and Territorial Spatial Planning: Governance Logic, Policy Tools and Practical Applications[J]. Urban Planning Forum, 2021(6): 12-19.
|
| [5] |
傅伯杰. 地理学综合研究的途径与方法: 格局与过程耦合[J]. 地理学报, 2014, 69(8): 1052-1059.
FU B J. The Integrated Studies of Geography: Coupling of Patterns and Processes[J]. Acta Geographica Sinica, 2014, 69(8): 1052-1059.
|
| [6] |
FU B J, WANG S, SU C H, et al. Linking Ecosystem Processes and Ecosystem Services[J]. Current Opinion in Environmental Sustainability, 2013, 5(1): 4-10.
|
| [7] |
曾辉, 陈利顶, 丁圣彦. 景观生态学[M]. 北京: 高等教育出版社, 2017.
ZENG H, CHEN L D, DING S Y. Landscape Ecology[M]. Beijing: Higher Education Press, 2017.
|
| [8] |
吕乐婷, 张杰, 孙才志, 等. 基于土地利用变化的细河流域景观生态风险评估[J]. 生态学报, 2018, 38(16): 5952-5960.
LU L T, ZHANG J, SUN C Z, et al. Landscape Ecological Risk Assessment of Xi River Basin Based on Land-Use Change[J]. Acta Ecologica Sinica, 2018, 38(16): 5952-5960.
|
| [9] |
翟培秀, 李飞雪, 邱小倩, 等. 长三角地区景观生态风险时空演变评估[J]. 水土保持研究, 2023, 30(4): 245-255.
ZHAI P X, LI F X, QIU X Q, et al. Assessment on Spatial-Temporal Evolution of Landscape Ecological Risk in the Yangtze River Delta[J]. Research of Soil and Water Conservation, 2023, 30(4): 245-255.
|
| [10] |
王玲, 汪淼. 成渝城市群景观生态风险演变分析[J]. 长江流域资源与环境, 2023, 32(3): 626-637.
WANG L, WANG M. Chengdu-Chongqing Urban Landscape Ecological Risk Evolution Analysis[J]. Resources and Environment in the Yangtze Basin, 2023, 32(3): 626-637.
|
| [11] |
王芳. 沱江流域近30年景观生态风险时空演变分析[J]. 测绘科学, 2023, 48(6): 198-211.
WANG F. Landscape Ecological Risk Space-Temporal Evolution Analysis of the Tuojiang River Basin in Recent 30 Years[J]. Science of Surveying and Mapping, 2023, 48(6): 198-211.
|
| [12] |
田雅楠, 马龙, 吴全. 黄河流域内蒙古段土地利用演变与景观生态风险评价[J]. 生态科学, 2023, 42(5): 103-113.
TIAN Y N, MA L, WU Q. Landscape Ecological Risk Assessment in Inner Mongolia Reach of Yellow River Based on Land Use Evolution[J]. Ecological Science, 2023, 42(5): 103-113.
|
| [13] |
翟端强, 卓健, 徐弈. 市县级国土空间生态风险评估方法优化研究[J]. 规划师, 2023, 39(2): 53-60.
ZHAI D Q, ZHUO J, XU Y. Optimization of Ecological Risk Assessment in City and County Level Territorial Space Planning[J]. Planners, 2023, 39(2): 53-60.
|
| [14] |
翟端强, 卓健, 张诗洁. 国土空间生态风险评估的国际经验比较及启示[J]. 城市问题, 2022(8): 90-98.
ZHAI D Q, ZHUO J, ZHANG S J. Comparison of International Experiences and Enlightenment on Ecological Risk Assessment in National Territory Spatial Planning[J]. Urban Problems, 2022(8): 90-98.
|
| [15] |
陈心怡, 谢跟踪, 张金萍. 海口市海岸带近30年土地利用变化的景观生态风险评价[J]. 生态学报, 2021, 41(3): 975-986.
CHEN X Y, XIE G Z, ZHANG J P. Landscape Ecological Risk Assessment of Land Use Changes in the Coastal Area of Haikou City in the Past 30 Years[J]. Acta Ecologica Sinica, 2021, 41(3): 975-986.
|
| [16] |
何钊全, 尚雪, 张铜会, 等. 近20年陕北黄土丘陵区景观生态风险时空变化及其冷热点格局[J]. 生态学杂志, 2023, 42(10): 2514-2525.
HE Z Q, SHANG X, ZHANG T H, et al. Spatiotemporal Variations of Landscape Ecological Risk and Its Cold-Hot Spot Pattern in the Loess Hills of Northern Shaanxi over the Past 20 Years[J]. Chinese Journal of Ecology, 2023, 42(10): 2514-2525.
|
| [17] |
徐兰, 罗维, 周宝同. 基于土地利用变化的农牧交错带典型流域生态风险评价: 以洋河为例[J]. 自然资源学报, 2015, 30(4): 580-590.
XU L, LUO W, ZHOU B T. Landscape Ecological Risk Assessment of Farming-Pastoral Ecozone Based on Land Use Change: A Case Study of the Yanghe Watershed, China[J]. Journal of Natural Resources, 2015, 30(4): 580-590.
|
| [18] |
荆玉平, 张树文, 李颖. 基于景观结构的城乡交错带生态风险分析[J]. 生态学杂志, 2008(2): 229-234.
JING Y P, ZHANG S W, LI Y. Ecological Risk Analysis of Rural-Urban Ecotone Based on Landscape Structure[J]. Chinese Journal of Ecology, 2008(2): 229-234.
|
| [19] |
郑可君, 李琛, 吴映梅, 等. 云南边境山区景观生态风险时空演变及其影响因素[J]. 生态学报, 2022, 42(18): 7458-7469.
ZHENG K J, LI C, WU Y M, et al. Temporal and Spatial Variation of Landscape Ecological Risk and Influential Factors in Yunnan Border Mountainous Area[J]. Acta Ecologica Sinica, 2022, 42(18): 7458-7469.
|
| [20] |
马骏, 裴燕如, 王慧媛, 等. 鄂尔多斯—榆林地区景观生态风险评价及其驱动因子分析[J]. 水土保持通报, 2022, 42(2): 275-283.
MA J, PEI Y R, WANG H Y, et al. Landscape Ecological Risk Assessment and Its Driving Factor Analysis in Ordos-Yulin Area[J]. Bulletin of Soil and Water Conservation, 2022, 42(2): 275-283.
|
| [21] |
乔斌, 颜玉倩, 张婷华, 等. 基于土地利用变化的西宁市景观生态风险识别及优化策略[J]. 生态学杂志, 2023, 42(8): 2020-2031.
QIAO B, YAN Y Q, ZHANG T H, et al. Landscape Ecological Risk Identification and Optimization Strategy in Xining City Based on Land Use Change[J]. Chinese Journal of Ecology, 2023, 42(8): 2020-2031.
|
| [22] |
曾永年, 靳文凭, 王慧敏, 等. 青海高原东部土地利用变化模拟与景观生态风险评价[J]. 农业工程学报, 2014, 30(4): 185-194.
ZENG Y N, JIN W P, WANG M H, et al. Simulation of Land-Use Changes and Landscape Ecological Assessment in Eastern Part of Qinghai Plateau[J]. Transactions of the Chinese Society of Agricultural Engineering, 2014, 30(4): 185-194.
|
| [23] |
唐明珠, 梁晨, 曾坚, 等. 生态约束下闽三角城市群城镇发展特征与转型路径[J]. 生态学报, 2021, 41(15): 6038-6050.
TANG M Z, LIANG C, ZENG J, et al. Development Characteristics and Transformation Paths of Towns in Fujian Triangle Urban Agglomeration Under Ecological Constraints[J]. Acta Ecologica Sinica, 2021, 41(15): 6038-6050.
|
| [24] |
倪畅, 周凯, 郑曦. 基于景观生态风险评价的景观格局优化: 以北京市浅山区为例[J]. 风景园林, 2021, 28(5): 80-85.
NI C, ZHOU K, ZHENG X. Landscape Pattern Optimization Based on Landscape Ecological Risk Assessment: A Case Study of Shallow Mountain Area in Beijing[J]. Landscape Architecture, 2021, 28(5): 80-85.
|
| [25] |
韩振华, 李建东, 殷红, 等. 基于景观格局的辽河三角洲湿地生态安全分析[J]. 生态环境学报, 2010, 19(3): 701-705.
HAN Z H, LI J D, YIN H, et al. Analysis of Ecological Security of Wetland in Liaohe River Delta Based on the Landscape Pattern[J]. Ecology and Environmental Sciences, 2010, 19(3): 701-705.
|
| [26] |
刘可暄, 王冬梅, 魏源送, 等. 密云水库流域多尺度景观生态风险时空演变趋势[J]. 生态学报, 2023, 43(1): 105-117.
LIU K X, WANG D M, WEI Y S, et al. Spatio-Temporal Evolution Trend of Multi-scale Landscape Ecological Risk in Miyun Reservoir Watershed[J]. Acta Ecologica Sinica, 2023, 43(1): 105-117.
|
| [27] |
付强, 诸云强, 孙九林, 等. 中国畜禽养殖的空间格局与重心曲线特征分析[J]. 地理学报, 2012, 67(10): 1383-1398.
FU Q, ZHU Y Q, SUN J L, et al. Spatial Patterns and Gravity Centers Curve of Livestock and Poultry Breeding in China[J]. Acta Geographica Sinica, 2012, 67(10): 1383-1398.
|
| [28] |
王钊, 杨山. 多中心城市区域城市蔓延冷热点格局及演化: 以苏锡常地区为例[J]. 经济地理, 2015, 35(7): 59-65.
WANG Z, YANG S. Evolution of Cold-Hot Spot Pattern of Polycentric Urban Areas Urban Sprawl: A Case Study of Suzhou-Wuxi-Changzhou Area[J]. Economic Geography, 2015, 35(7): 59-65.
|
| [29] |
刘丹, 李琳娜. 1995—2015年中国北方边境样带土地利用时空格局演变及驱动因素[J]. 资源科学, 2021, 43(6): 1208-1221.
LIU D, LI L N. Spatiotemporal Change and Driving Factors of Land Use in the Northern Border Transect of China, 1995−2015[J]. Resources Science, 2021, 43(6): 1208-1221.
|
| [30] |
杨清可, 段学军, 王磊, 等. 基于“三生空间”的土地利用转型与生态环境效应: 以长江三角洲核心区为例[J]. 地理科学, 2018, 38(1): 97-106.
YANG Q K, DUAN X J, WANG L, et al. Land Use Transformation Based on Ecological-Production-Living Spaces and Associated Eco-environment Effects: A Case Study in the Yangtze River Delta[J]. Scientia Geographica Sinica, 2018, 38(1): 97-106.
|
| [31] |
张佰发, 苗长虹. 黄河流域土地利用时空格局演变及驱动力[J]. 资源科学, 2020, 42(3): 460-473.
ZHANG B F, MIAO C H. Spatiotemporal Changes and Driving Forces of Land Use in the Yellow River Basin[J]. Resources Science, 2020, 42(3): 460-473.
|
| [32] |
李方正, 解爽, 李雄. 基于多源数据分析的北京市中心城绿色空间时空演变研究(1992—2016)[J]. 风景园林, 2018, 25(8): 46-51.
LI F Z, XIE S, LI X. The Spatio-Temporal Evolution of Green Spaces in Central Beijing Based on Multi-source Data (1992−2016)[J]. Landscape Architecture, 2018, 25(8): 46-51.
|
| [33] |
崔晓伟, 张磊, 朱亮, 等. 三峡库区开县蓄水前后景观格局变化特征[J]. 农业工程学报, 2012, 28(4): 227-234.
CUI X W, ZHANG L, ZHU L, et al. Changes of Landscape Pattern and Its Characteristics in Kaixian County Before and After Impoundment of Three Gorges Dam Projects[J]. Transactions of the Chinese Society of Agricultural Engineering, 2012, 28(4): 227-234.
|
| [34] |
冯异星, 罗格平, 周德成, 等. 近 50a土地利用变化对干旱区典型流域景观格局的影响: 以新疆玛纳斯河流域为例[J]. 生态学报, 2010, 30(16): 4295-4305.
FENG Y X, LUO G P, ZHOU D C, et al. Effects of Land Use Change on Landscape Pattern of a Typical Arid Watershed in the Recent 50 Years: A Case Study on Manas River Watershed in Xinjiang[J]. Acta Ecologica Sinica, 2010, 30(16): 4295-4305.
|
| [35] |
郭晋平. 森林景观生态研究[M]. 北京: 北京大学出版社, 2001.
GUO J P. Research on Forest Landscape Ecology[M]. Beijing: Peking University Press, 2001.
|
| [36] |
陈文波, 肖笃宁, 李秀珍. 景观指数分类、应用及构建研究[J]. 应用生态学报, 2002, 13(1): 121-125.
CHEN W B, XIAO D N, LI X Z. Classification, Application, and Creation of Landscape Indices[J]. Chinese Journal of Applied Ecology, 2002, 13(1): 121-125.
|
| [37] |
张桂莲, 仲启铖, 张浪. 面向碳中和的城市园林绿化碳汇能力建设研究[J]. 风景园林, 2022, 29(5): 12-16.
ZHANG G L, ZHONG Q C, ZHANG L. Research on Carbon Sink Capacity Construction via Urban Landscaping for Carbon Neutrality[J]. Landscape Architecture, 2022, 29(5): 12-16.
|
| [38] |
陈菁, 林忠弼, 江越, 等. 基于快速城市化的生态风险分析: 以福建省为例[J]. 湖南师范大学自然科学学报, 2011, 34(1): 80-85.
CHEN J, LIN Z B, JIANG Y, et al. Ecological Risk Analysis Based on Rapidly Urbanizing Area: A Case Study of Fujian Province[J]. Journal of Natural Science of Hunan Normal University, 2011, 34(1): 80-85.
|
| [39] |
石龙宇, 杜宾宾, 陈丁楷. 基于生态系统服务价值的城市生态风险评价[J]. 环境科学与技术, 2021, 44(2): 203-210.
SHI L Y, DU B B, CHEN D K. Assessment of Urban Ecological Risks Based on Valuation of Ecosystem Services[J]. Environmental Science & Technology, 2021, 44(2): 203-210.
|
| [40] |
张师赫, 李宝银, 林玉英, 等. 基于生态系统服务的景观生态风险评价及其驱动因素研究: 以福建省为例[J]. 水土保持研究, 2022, 29(6): 174-182.
ZHANG S H, LI B Y, LIN Y Y, et al. Research on Landscape Ecological Risk Assessment and Driving Factors Based on Ecosystem Services: A Case Study of Fujian Province[J]. Research of Soil and Water Conservation, 2022, 29(6): 174-182.
|
| [41] |
田鹏, 龚虹波, 叶梦姚, 等. 东海区大陆海岸带景观格局变化及生态风险评价[J]. 海洋通报, 2018, 37(6): 695-706.
TIAN P, GONG H B, YE M Y, et al. Landscape Pattern Change and Ecological Risk Assessment of the Continental Coast of the East China Sea[J]. Marine Science Bulletin, 2018, 37(6): 695-706.
|
/
| 〈 |
|
〉 |