
城市绿地游憩服务网络特征及不同出行模式的响应差异
|
宋子亮/男/华中农业大学园艺林学学院在读博士研究生/研究方向为风景园林规划与设计 |
|
刘宇航/女/华中农业大学园艺林学学院在读硕士研究生/研究方向为风景园林规划与设计 |
|
黄子秋/男/华中农业大学硕士/长江勘测规划设计研究有限责任公司助理工程师/研究方向为风景园林规划与设计 |
|
刘文平/男/博士/华中农业大学园艺林学学院教授、博士研究生导师/本刊青年编委/研究方向为景观服务与地景规划 |
Copy editor: 项曦
收稿日期: 2023-11-03
修回日期: 2024-01-04
网络出版日期: 2025-12-11
基金资助
国家自然科学基金项目“城乡统筹背景下绿色空间多层级游憩流网络协同机制及布局优化”(32171858)
版权
Characteristics of Urban Green Space Recreation Services Networks and Response Disparities Across Different Travel Modes
|
SONG Ziliang is a Ph.D. candidate in the College of Horticulture & Forestry Sciences, Huazhong Agricultural University. His research focuses on landscape planning and design |
|
LIU Yuhang is a master student in the College of Horticulture & Forestry Sciences, Huazhong Agricultural University. Her research focuses on landscape planning and design |
|
HUANG Ziqiu gained his master degree from Huazhong Agricultural University, is an assistant engineer in Changjiang Institute of Survey, Planning, Design and Research Co., Ltd. His research focuses on landscape planning and design |
|
LIU Wenping, Ph.D., is a professor and doctoral supervisor in the College of Horticulture & Forestry Sciences, Huazhong Agricultural University, and a young editorial board member of this journal. His research focuses on landscape service and landscape planning |
Received date: 2023-11-03
Revised date: 2024-01-04
Online published: 2025-12-11
Copyright
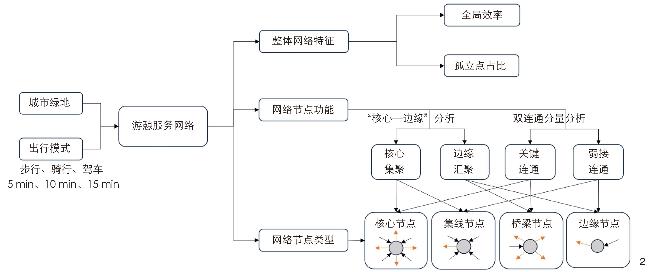
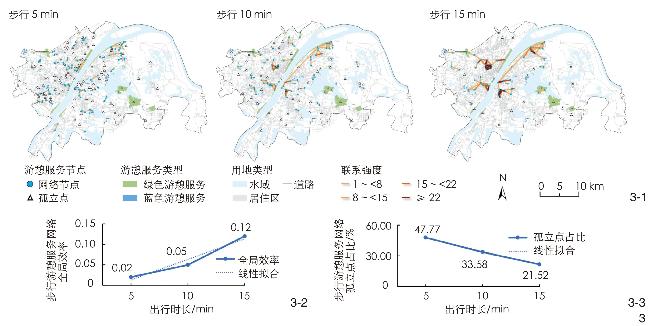
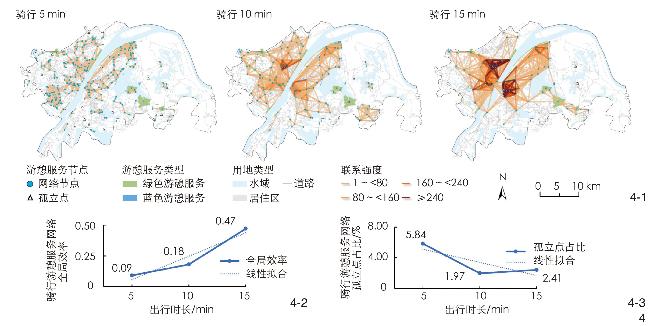
【目的】随着经济社会的快速发展,城市居民亲近自然的游憩需求显著增长。在城市尺度提升绿地的蓝色和绿色游憩服务效率成为当前亟须解决的问题。【方法】以武汉市为研究区域,通过提取居民游憩出行的最短路径,利用社会网络分析软件Ucinet 6.0分别构建步行、骑行和驾车3种出行模式下的5 min、10 min和15 min城市绿地的游憩服务网络,并分析网络的整体特征、节点功能和节点类型,进而探究这些特征在不同出行模式下的响应差异。【结果】当出行时长为5 min时,骑行和驾车模式能够组织超过85%的城市绿地节点协同联系形成游憩服务网络,而步行模式下游憩服务则呈零星局部组团分布。随着出行时长的增加,3种出行模式下游憩服务网络的核心集聚功能节点占比呈上升趋势,且节点类型主要以绿色游憩服务为主。骑行和驾车模式下的边缘汇聚功能节点占比则随出行时长增加而逐渐下降,但其蓝色游憩服务型核心集聚节点的占比则逐渐上升。【结论】城市绿地游憩服务网络效率的整体提升须系统考虑不同出行模式下居民的游憩需求,并协同整合蓝色和绿色游憩空间。这些发现可以为城市绿地游憩体系的构建和完善,以及游憩资源的系统整合提供直接支持。
宋子亮 , 刘宇航 , 黄子秋 , 刘文平 . 城市绿地游憩服务网络特征及不同出行模式的响应差异[J]. 风景园林, 2024 , 31(2) : 56 -63 . DOI: 10.3724/j.fjyl.202311030497
[Objective] Following the outbreak of the COVID-19 pandemic, residents are urgently seeking urban sanctuaries that provide both physical and mental solace. Urban green spaces not only offer an opportunity to escape from the urban clamor for stress relief, but also provide various recreation services, fostering the enhancement of residents’ physical and mental well-being and overall happiness. Consequently, enhancing the capacity of urban green spaces for recreation services has become a pivotal concern. It is common to see diverse types of urban green space recreation services woven into a network. However, the current research fails to clarify the characteristics of such networks and how they response to different travel modes. Understanding these gaps is essential for creating urban environments that cater to the evolving needs of residents in the post-pandemic era, thus ensuring a holistic approach to well-being and happiness. [Methods] Taking the central urban area of Wuhan as the research area, this research focuses on identifying and extracting urban green spaces that provide blue and green recreation services based on the coverage characteristics of vegetation and water resources. By virtue of the real-time travel path navigation from Amap (AutoNavi), the research extracts the shortest travel paths and durations from residential areas to urban green spaces for three travel modes: walking, cycling, and driving. Using the social network analysis software Ucinet 6.0, the research constructs three types of recreation service networks for each travel mode by taking into account travel durations of 5 minutes, 10 minutes, and 15 minutes. Moreover, the research analyzes the overall characteristics of the aforesaid networks in combination with global efficiency and the proportion of isolated nodes.Additionally, a “core – periphery” analysis and a “bi-components” analysis are conducted to investigate the functional types of nodes within these networks based on travel paths and durations. [Results] When the travel duration is 5 minutes, more than 85% of urban green space nodes can be efficiently incorporated into recreation service networks under cycling and driving modes, while the recreation services under walking mode exhibit scattered local clustering. As the duration of travel increases, the overall efficiency of the recreation service networks formed under the three modes of walking, cycling and driving shows a trend of rapid growth, with the growth rate under the driving mode being the highest, followed in succession by that under the cycling mode and that under the walking mode. The proportion of nodes featuring core agglomeration functionality in the recreation service networks under the three travel modes is on the rise with extended travel duration. In the 15-minute driving mode, the proportion of nodes with core agglomeration functionality reaches the peak value of 40.97%. Although core agglomeration nodes are predominantly occupied by green recreation services, both the cycling and driving modes witness a gradual rise in the proportion of core agglomeration nodes associated with blue recreation services as travel duration lengthens. In the walking mode, the proportion of nodes with crucial connectivity functionality in the recreation service network within urban green spaces demonstrates an upward trend with increasing travel duration. Conversely, the driving mode exhibits a gradual decline in the proportion of nodes with crucial connectivity functionality. Green recreation services persist as the primary type of crucial and weak connectivity nodes. However, as travel duration increases, the proportion of blue recreation services within weak connectivity nodes experiences an upward shift. Notably, in the recreation service network formed under the walking mode, the proportion of blue recreation services serving as crucial connectivity nodes reaches 2%–3%. Furthermore, in the walking, cycling, and driving modes, the proportion of edge nodes in the urban green space recreation service network is the highest, particularly at a 5-minute travel duration, where it surpasses 85%. Regarding spatial distribution, whether in the walking, cycling, or driving mode, bridge nodes tend to disperse, while hub nodes exhibit a tendency to cluster. [Conclusions] Achieving an overall improvement in the efficiency of urban green space recreation service networks necessitate a nuanced consideration of residents’ diverse recreational needs under different travel modes. Simultaneously, it underscores the importance of integrating blue and green recreation spaces. These findings offer substantial insights for the development and refinement of urban green space recreation systems and the systematic amalgamation of recreation resources, laying the groundwork for sustainable urban development. Notably, this research focuses exclusively on the estimated conditions formed by the travel duration from residential areas to urban green spaces, which are taken as a basis for calculating recreation services. It does not take into consideration the actual travel behaviors of residents heading to urban green spaces and associated influencing factors. In the future, a more comprehensive investigation is needed to unveil the authentic network relationships of urban green space recreation services and the complex mechanisms that underlie them.
表1 不同类型城市绿地游憩服务及出行时长阈值Tab. 1 Urban green space recreation services of various types and travel duration thresholds |
| 类型 | 蓝色游憩服务主导 | 绿色游憩服务主导 | 出行时长阈值/min | |||
| 个数 | 总面积/hm2 | 个数 | 总面积/hm2 | |||
| 综合公园 | 15 | 814.60 | 31 | 1 247.74 | ≤15 | |
| 社区公园 | 2 | 10.90 | 69 | 240.92 | ≤10 | |
| 专类公园 | 4 | 171.22 | 19 | 475.67 | ≤15 | |
| 游园 | 0 | 0 | 183 | 176.26 | ≤5 | |
| 风景游憩绿地 | 4 | 168.65 | 10 | 1 229.96 | ≤15 | |
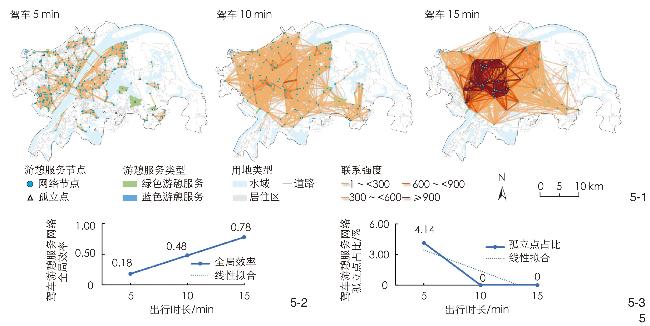
图3 不同步行时长下城市绿地游憩服务网络的空间分布(3-1)、全局效率(3-2)、孤立点占比(3-3)Fig. 3 Spatial distribution (3-1), overall efficiency (3-2) and proportion of isolated nodes (3-3) of recreation service networks of urban green space under different walking durations |
图4 不同骑行时长下城市绿地游憩服务网络的空间分布(4-1)、全局效率(4-2)、孤立点占比(4-3)Fig. 4 Spatial distribution (4-1), overall efficiency (4-2) and proportion of isolated nodes (4-3) of recreation service networks of urban green space under different cycling durations |
表2 核心集聚功能节点类型占比Tab. 2 Proportion of core agglomeration function nodes |
| 出行模式 | 5 min | 10 min | 15 min | |||||
| 蓝色服务 节点占比 | 绿色服务 节点占比 | 蓝色服务 节点占比 | 绿色服务 节点占比 | 蓝色服务 节点占比 | 绿色服务 节点占比 | |||
| 步行 | 0 | 3.57 | 2.99 | 2.99 | 1.27 | 5.06 | ||
| 骑行 | 0 | 2.60 | 2.63 | 1.32 | 7.23 | 9.64 | ||
| 驾车 | 0.32 | 4.46 | 2.60 | 10.39 | 14.46 | 26.51 | ||
表3 边缘汇聚功能节点类型占比Tab. 3 Proportion of edge convergence function nodes |
| 出行模式 | 5 min | 10 min | 15 min | |||||
| 蓝色服务 节点占比 | 绿色服务 节点占比 | 蓝色服务 节点占比 | 绿色服务 节点占比 | 蓝色服务 节点占比 | 绿色服务 节点占比 | |||
| 步行 | 4.91 | 43.75 | 7.46 | 52.99 | 21.52 | 50.63 | ||
| 骑行 | 6.49 | 85.06 | 13.16 | 80.92 | 19.28 | 61.45 | ||
| 驾车 | 6.37 | 84.71 | 13.64 | 73.38 | 13.25 | 45.78 | ||
表4 关键连通功能节点类型占比Tab. 4 Proportion of key connection function nodes |
| 出行模式 | 5 min | 10 min | 15 min | |||||
| 蓝色服务 节点占比 | 绿色服务 节点占比 | 蓝色服务 节点占比 | 绿色服务 节点占比 | 蓝色服务 节点占比 | 绿色服务 节点占比 | |||
| 步行 | 2.23 | 4.91 | 2.99 | 9.70 | 2.53 | 10.13 | ||
| 骑行 | 0.32 | 5.52 | 0 | 1.97 | 0 | 2.41 | ||
| 驾车 | 0.64 | 3.50 | 0.65 | 1.95 | 0 | 0 | ||
表5 弱接连通功能节点类型占比Tab. 5 Proportion of weak connection function nodes |
| 出行模式 | 5 min | 10 min | 15 min | |||||
| 蓝色服务 节点占比 | 绿色服务 节点占比 | 蓝色服务 节点占比 | 绿色服务 节点占比 | 蓝色服务 节点占比 | 绿色服务 节点占比 | |||
| 步行 | 2.68 | 42.41 | 7.46 | 46.27 | 20.25 | 45.57 | ||
| 骑行 | 6.17 | 82.14 | 15.79 | 80.26 | 26.51 | 68.67 | ||
| 驾车 | 6.05 | 85.67 | 15.58 | 81.82 | 27.71 | 72.29 | ||
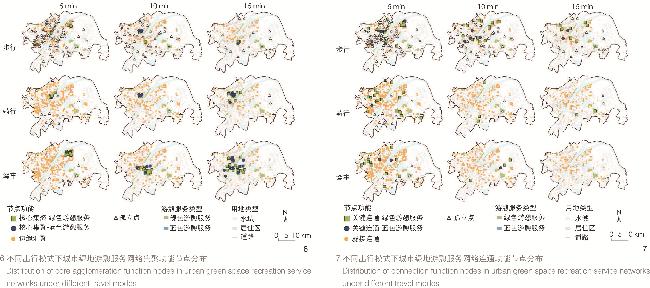
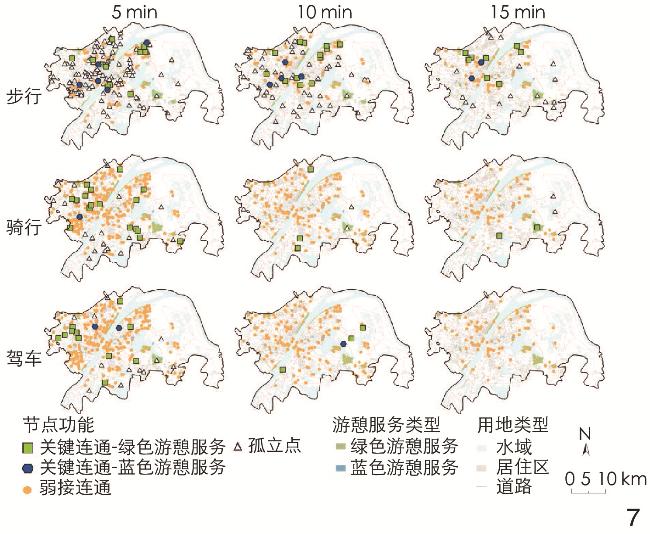
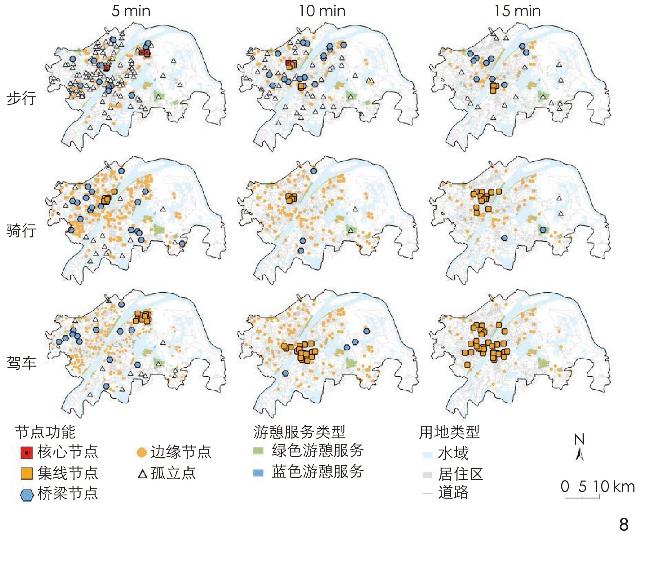
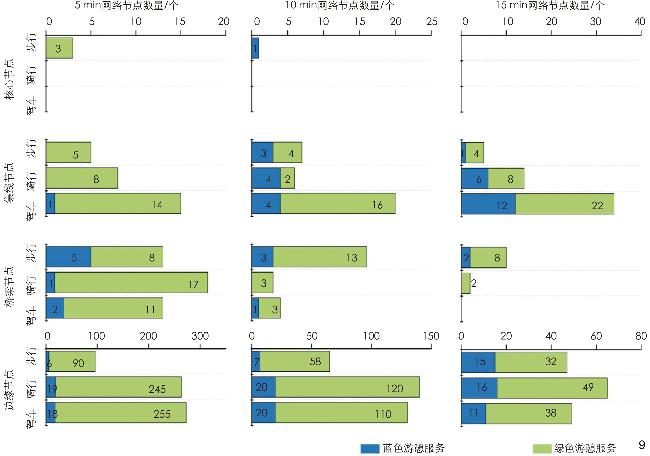
图8 不同出行模式下城市绿地游憩服务网络不同类型节点分布Fig. 8 Distribution of various types of nodes in urban green space recreation service networks under different travel modes |
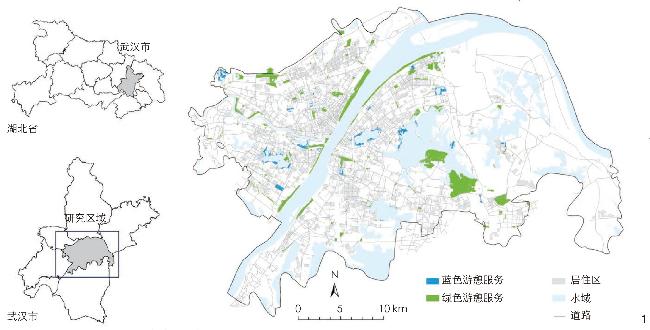
文中图表均由作者绘制,其中图1、3~5、6~8底图审图号为鄂S(2023)009号。
| [1] |
POORTINGA W, BIRD N, HALLINGBERG B, et al. The Role of Perceived Public and Private Green Space in Subjective Health and Wellbeing During and After the First Peak of the COVID-19 Outbreak[J]. Landscape and Urban Planning, 2021, 211: 104092
|
| [2] |
KIM H, SHOJI Y, TSUGE T, et al. Understanding Recreation Demands and Visitor Characteristics of Urban Green Spaces: A Use of the Zero-Inflated Negative Binomial Model[J]. Urban Forestry & Urban Greening, 2021, 65: 127332
|
| [3] |
兰强, 黄瓴. 高密度城区公共绿地游憩服务能力评价: 以成都市中心城区为例[J]. 风景园林, 2023, 30(11): 105-112.
LAN Q, HUANG L. Evaluation of Recreation Service Capacity of Public Green Space in High-Density Urban Areas: A Case Study of Downtown Chengdu[J]. Landscape Architecture, 2023, 30(11): 105-112.
|
| [4] |
BERTRAM C, REHDANZ K. The Role of Urban Green Space for Human Well-Being[J]. Ecological Economics, 2015, 120: 139-152.
|
| [5] |
ŁASZKIEWICZ E, HEYMAN A, CHEN X, et al. Valuing Access to Urban Greenspace Using Non-Linear Distance Decay in Hedonic Property Pricing[J]. Ecosystem Services, 2022, 53: 101394
|
| [6] |
NĂSTASE I I, PĂTRU-STUPARIU I, KIENAST F. Landscape Preferences and Distance Decay Analysis for Mapping the Recreational Potential of an Urban Area[J]. Sustainability, 2019, 11(13): 3620
|
| [7] |
LIU D, KWAN M P, KAN Z H. Analysis of Urban Green Space Accessibility and Distribution Inequity in the City of Chicago[J]. Urban Forestry & Urban Greening, 2021, 59: 127029
|
| [8] |
LIU W P, CHEN W J, DONG C L. Spatial Decay of Recreational Services of Urban Parks: Characteristics and Influencing Factors[J]. Urban Forestry & Urban Greening, 2017, 25: 130-138.
|
| [9] |
刘文平, 袁雄钢, 陈伟娟. 城市综合公园游憩服务多时空粒度辐射特征研究: 以武汉为例[J]. 中国园林, 2019, 35(1): 29-34.
LIU W P, YUAN X G, CHEN W J. Multi-Spatiotemporal Decay of Recreational Services of Urban Comprehensive Parks in Wuhan[J]. Chinese Landscape Architecture, 2019, 35(1): 29-34.
|
| [10] |
ELLIOTT L R, WHITE M P, GRELLIER J, et al. Research Note: Residential Distance and Recreational Visits to Coastal and Inland Blue Spaces in Eighteen Countries[J]. Landscape and Urban Planning, 2020, 198: 103800
|
| [11] |
LI Z Q, LIU Q, ZHANG Y X, et al. Characteristics of Urban Parks in Chengdu and Their Relation to Public Behaviour and Preferences[J]. Sustainability, 2022, 14(11): 6761
|
| [12] |
DAI X, WANG L C, TAO M H, et al. Assessing the Ecological Balance Between Supply and Demand of Blue-Green Infrastructure[J]. Journal of Environmental Management, 2021, 288: 112454
|
| [13] |
RAMIREZ ARANDA N, DE WAEGEMAEKER J, VAN DE WEGHE N. Cultural Ecosystem Services Along the Woluwe River: Mapping the Potential for a Cross-Regional Green-Blue Network During the COVID-19 Pandemic[J]. Journal of Environmental Planning and Management, 2023: 1-27.
|
| [14] |
葛韵宇, 刘子晴, 端木珅, 等. 社区公园小气候调节与游憩服务协同性评价[J]. 风景园林, 2022, 29(12): 92-99.
GE Y Y, LIU Z Q, DUANMU S, et al. Evaluation on Synergy Between Microclimate Regulation and Recreation Services Provided by Community Parks[J]. Landscape Architecture, 2022, 29(12): 92-99.
|
| [15] |
YUAN Y Y, TANG S Q, ZHANG J Q, et al. Quantifying the Relationship Between Urban Blue-Green Landscape Spatial Pattern and Carbon Sequestration: A Case Study of Nanjing’s Central City[J]. Ecological Indicators, 2023, 154: 110483
|
| [16] |
DONATI G F A, BOLLIGER J, Psomas A, et al. Reconciling Cities with Nature: Identifying Local Blue-Green Infrastructure Interventions for Regional Biodiversity Enhancement[J]. Journal of Environmental Management, 2022, 316: 115254
|
| [17] |
BLAZY R, HREHOROWICZ-GABER H, HREHOROWICZ-MNOWAK A, et al. The Synergy of Ecosystems of Blue and Green Infrastructure and Its Services in the Metropolitan Area: Chances and Dangers[J]. Sustainability, 2021, 13(4): 2103
|
| [18] |
杨莹, 刘颂. 基于社会网络分析的上海市城市公园体系网络结构评价与优化路径[J]. 风景园林, 2023, 30(11): 51-58.
YANG Y, LIU S. Network Structure Evaluation and Optimization Path for Urban Park System of Shanghai City Based on Social Network Analysis[J]. Landscape Architecture, 2023, 30(11): 51-58.
|
| [19] |
方大春, 孙明月, 高铁时代下长三角城市群空间结构重构: 基于社会网络分析[J].经济地理, 2015, 35(10): 50-56.
FANG D C, SUN M Y, The Reconstruction of the Spatial Structure of the Yangtze River Delta City Group in the High-Speed Rail Era: Based on the Social Network Analysis[J]. Economic Geography, 2015, 35(10): 50-56.
|
| [20] |
MOU N X, ZHENG Y H, MAKKONEN T, et al. Tourists’ Digital Footprint: The Spatial Patterns of Tourist Flows in Qingdao, China[J]. Tourism Management, 2020, 81: 104151
|
| [21] |
LIU W P, CHEN Q, LI Y, et al. Application of GPS Tracking for Understanding Recreational Flows Within Urban Park[J]. Urban Forestry & Urban Greening, 2021, 63: 127211
|
| [22] |
FENG J X, DIJST M, WISSINK B, et al. Changing Travel Behaviour in Urban China: Evidence from Nanjing 2008−2011[J]. Transport Policy, 2017, 53: 1-10.
|
| [23] |
WENG C, WANG J Y, LI C M, et al. Recreational Green Space Service in the Guangdong − Hong Kong − Macau Greater Bay Area: A Multiple Travel Modes Perspective[J]. Land, 2022, 11(11): 2072
|
| [24] |
TAN R H, WANG R Q, WANG Y, et al. The Park City Perspective Study: Revealing the Park Accessibility Influenced by Experiences of Visitors Under Different Travel Modes[J]. Frontiers in Environmental Science, 2022, 10: 924996
|
| [25] |
XING L J, LIU Y F, LIU X J. Measuring Spatial Disparity in Accessibility with a Multi-Mode Method Based on Park Green Spaces Classification in Wuhan, China[J]. Applied Geography, 2018, 94: 251-261.
|
| [26] |
武汉市自然资源和规划局.武汉首次给40个湖泊做B超[EB/OL].(2018-08-30)[2023-12-31]. https://zrzyhgh.wuhan.gov.cn/zwdt/gzdt/202001/t20200107_609445.shtml.
Wuhan Municipal Bureau of Natural Resources and Planning. Wuhan for the First Time to 40 Lakes “Ultrasound” [EB/OL]. (2018-08-30) [2023-12-31]. https://zrzyhgh.wuhan.gov.cn/zwdt/gzdt/202001/t20200107_609445.shtml.
|
| [27] |
武汉市园林和林业局. 2022年武汉市绿化状况公报[EB/OL].(2023-03-14)[2023-12-31]. https://ylj.wuhan.gov.cn/zwgk/zwxxgkzl_12298/tjxx/lhgb_12361/202303/t20230314_2169414.shtml.
Wuhan Municipal Landscape Gardens and Forestry Bureau. Wuhan Greening Status Bulletin 2022[EB/OL]. (2023-03-14) [2023-12-31]. https://ylj.wuhan.gov.cn/zwgk/zwxxgkzl_12298/tjxx/lhgb_12361/202303/t20230314_2169414.shtml.
|
| [28] |
EKKEL E D, DE VRIES S. Nearby Green Space and Human Health: Evaluating Accessibility Metrics[J]. Landscape and Urban Planning, 2017, 157: 214-220.
|
| [29] |
LU W W, JIANG W Y, QIAO D, et al. Embracing Green Spaces: Exploring Spatiotemporal Changes in Urban Green Space Accessibility and its Equity in Guangzhou, China for Sustainable Urban Greening[J]. Environmental and Sustainability Indicators, 2023, 19: 100290
|
| [30] |
任婕. 上海五大新城的道路网络特征解析与韧性测度[J]. 城市规划, 2022, 46(9): 82-92.
REN J. Research on Road Network Characteristics and Resilience Measurement of Five New Towns in Shanghai[J]. City Planning Review, 2022, 46(9): 82-92.
|
| [31] |
刘军. 整体网分析: UCINET软件实用指南(第三版)[M]. 上海: 格致出版社, 2019.
LIU J. Lectures on Whole Network Approach: A Practical Guide to UCINET (3rd ed) [M]. Shanghai: Gezhi Publishing House, 2019.
|
| [32] |
赵梓渝, 魏冶, 王士君, 等. 有向加权城市网络的转变中心性与控制力测度: 以中国春运人口流动网络为例[J]. 地理研究, 2017, 36(4): 647-660.
ZHAO Z Y, WEI Y, WANG S J, et al. Measurement of Directed Alternative Centricity and Power of Directed Weighted Urban Network: A Case of Population flow Network of China During “Chunyun” Period[J]. Geographical Research, 2017, 36(4): 647-660.
|
| [33] |
NEWMAN M E J, GHOSHAL G. Bicomponents and The Robustness of Networks to Failure[J]. Physical Review Letters, 2008, 100(13): 138701
|
| [34] |
LI Z M, FAN Z X, SONG Y, et al. Assessing Equity in Park Accessibility Using a Travel Behavior-Based G2SFCA Method in Nanjing, China[J]. Journal of Transport Geography, 2021, 96: 103179
|
| [35] |
WILLIAMS T G, LOGAN T M, ZUO C T, et al. Parks and Safety: A Comparative Study of Green Space Access and Inequity in Five US Cities[J]. Landscape and Urban Planning, 2020, 201: 103841
|
| [36] |
SCHIPPERIJN J, EKHOLM O, STIGSDOTTER U K, et al. Factors Influencing the Use of Green Space: Results from a Danish National Representative Survey[J]. Landscape and Urban Planning, 2010, 95(3): 130-137.
|
| [37] |
METZGER J P, VILLARREAL-ROSAS J, SUÁREZ-CASTRO A F, et al. Considering Landscape-Level Processes in Ecosystem Service Assessments[J]. Science of the Total Environment, 2021, 796: 149028
|
/
| 〈 |
|
〉 |