×
模态框(Modal)标题
在这里添加一些文本
关闭
关闭
提交更改
取消
确定并提交
×
模态框(Modal)标题
×
期刊
文章
图表
检索
EN
中文
首页
期刊介绍
编委会
投稿指南
在线期刊
当期目录
过刊浏览
推荐文章
阅读排行
下载排行
EN
中文
图/表 详细信息
Hydro-saline synergy regulates ecosystem multifunctionality via microbial biomass in semi-arid grasslands, China
HU Jinpeng, HE Yuanyuan, LI Yuanhong, ZHANG Yuewei, ZHANG Jinlin
干旱区科学, 2026, 18(
3
): 524-546. DOI:
10.1016/j.jaridl.2026.03.009
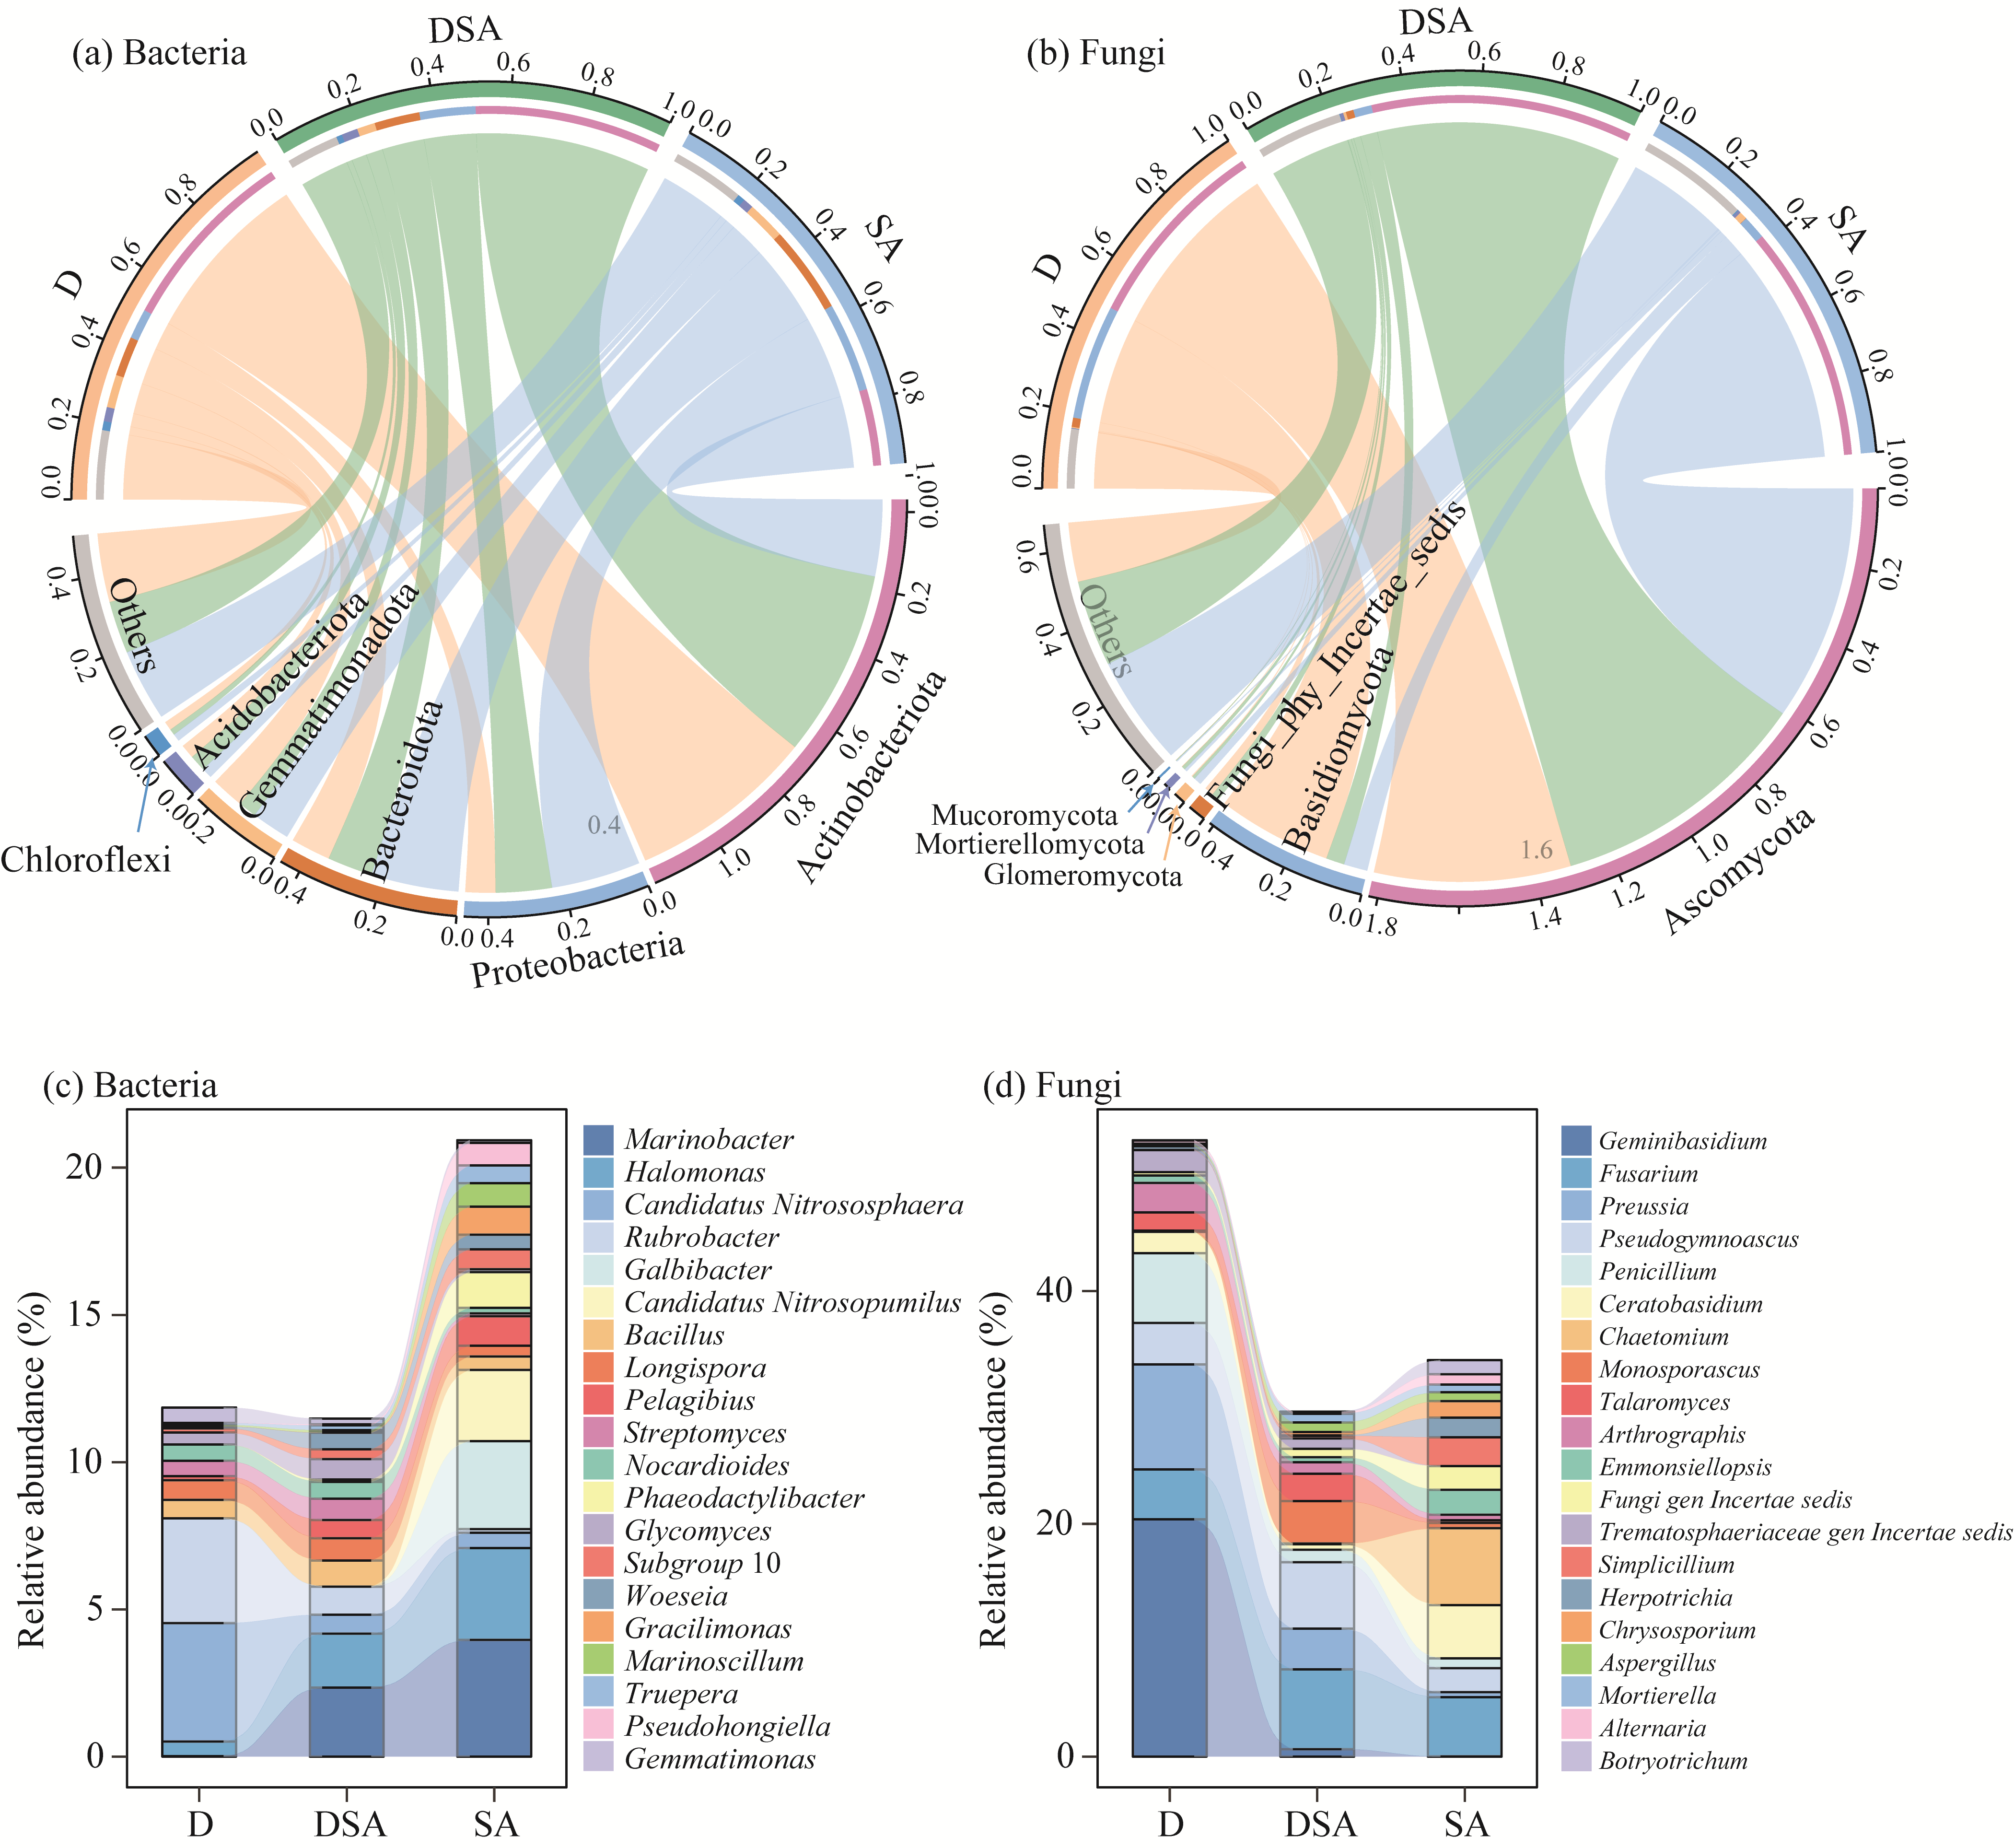
Fig. S2
Relative abundance of microbial communities in different soil groups. (a and b), bacterial and fungal relative abundance at phylum level, respectively; (c and d), bacterial and fungal relative abundance at genus level, respectively.
本文的其它图/表
Table 2
Topological properties of correlation networks for bacteria and fungi in different groups
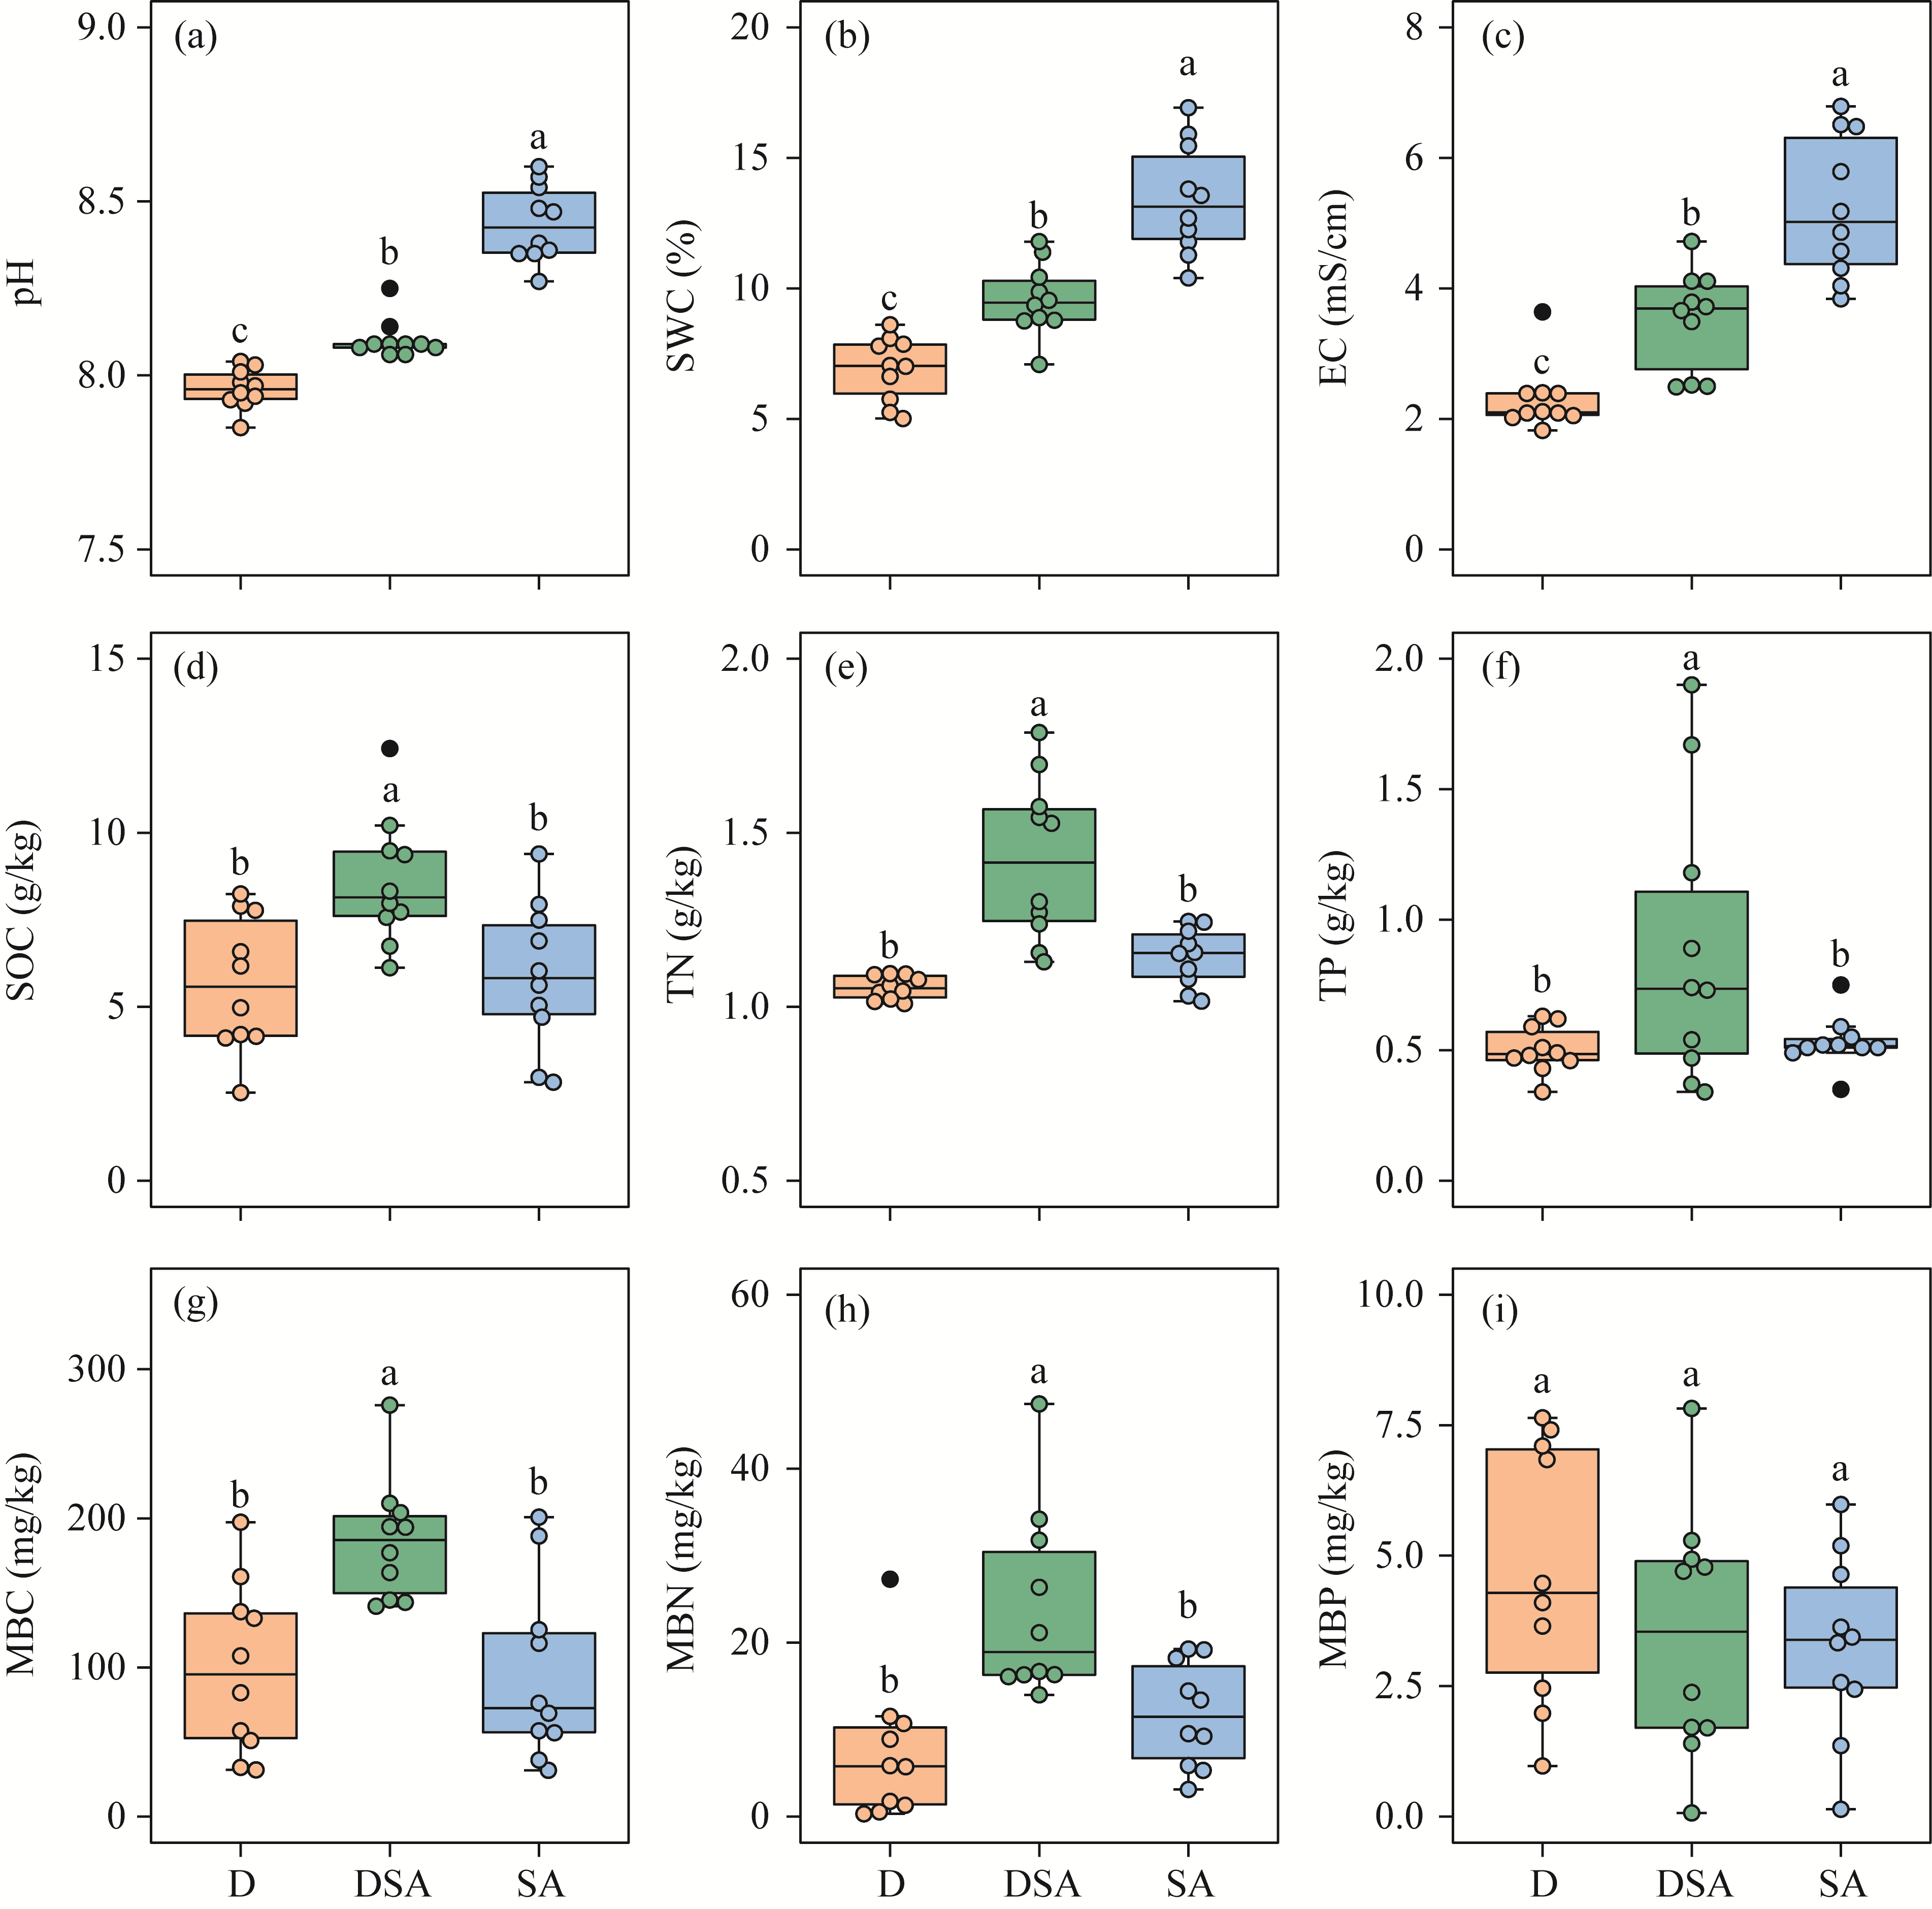
Fig. 1
Soil properties and soil microbial biomass in different groups. (a), pH; (b), SWC (soil water content); (c), EC (electrical conductivity); (d), SOC (soil organic carbon); (e), TN (total nitrogen); (f), TP (total phosphorus); (g), MBC (microbial biomass carbon); (h), MBN (microbial biomass nitrogen); (i), MBP (microbial biomass phosphorus). D, drought; SA, saline-alkaline; DSA, combined stress of D and SA. Boxes indicate the IQR (interquartile range, 75
th
to 25
th
of the data). The median value is shown as a line within the box. Outlier is shown as black point. Whiskers extend to the most extreme value within 1.5×IQR. Different lowercase letters indicate significant differences at P<0.050 level among different groups.
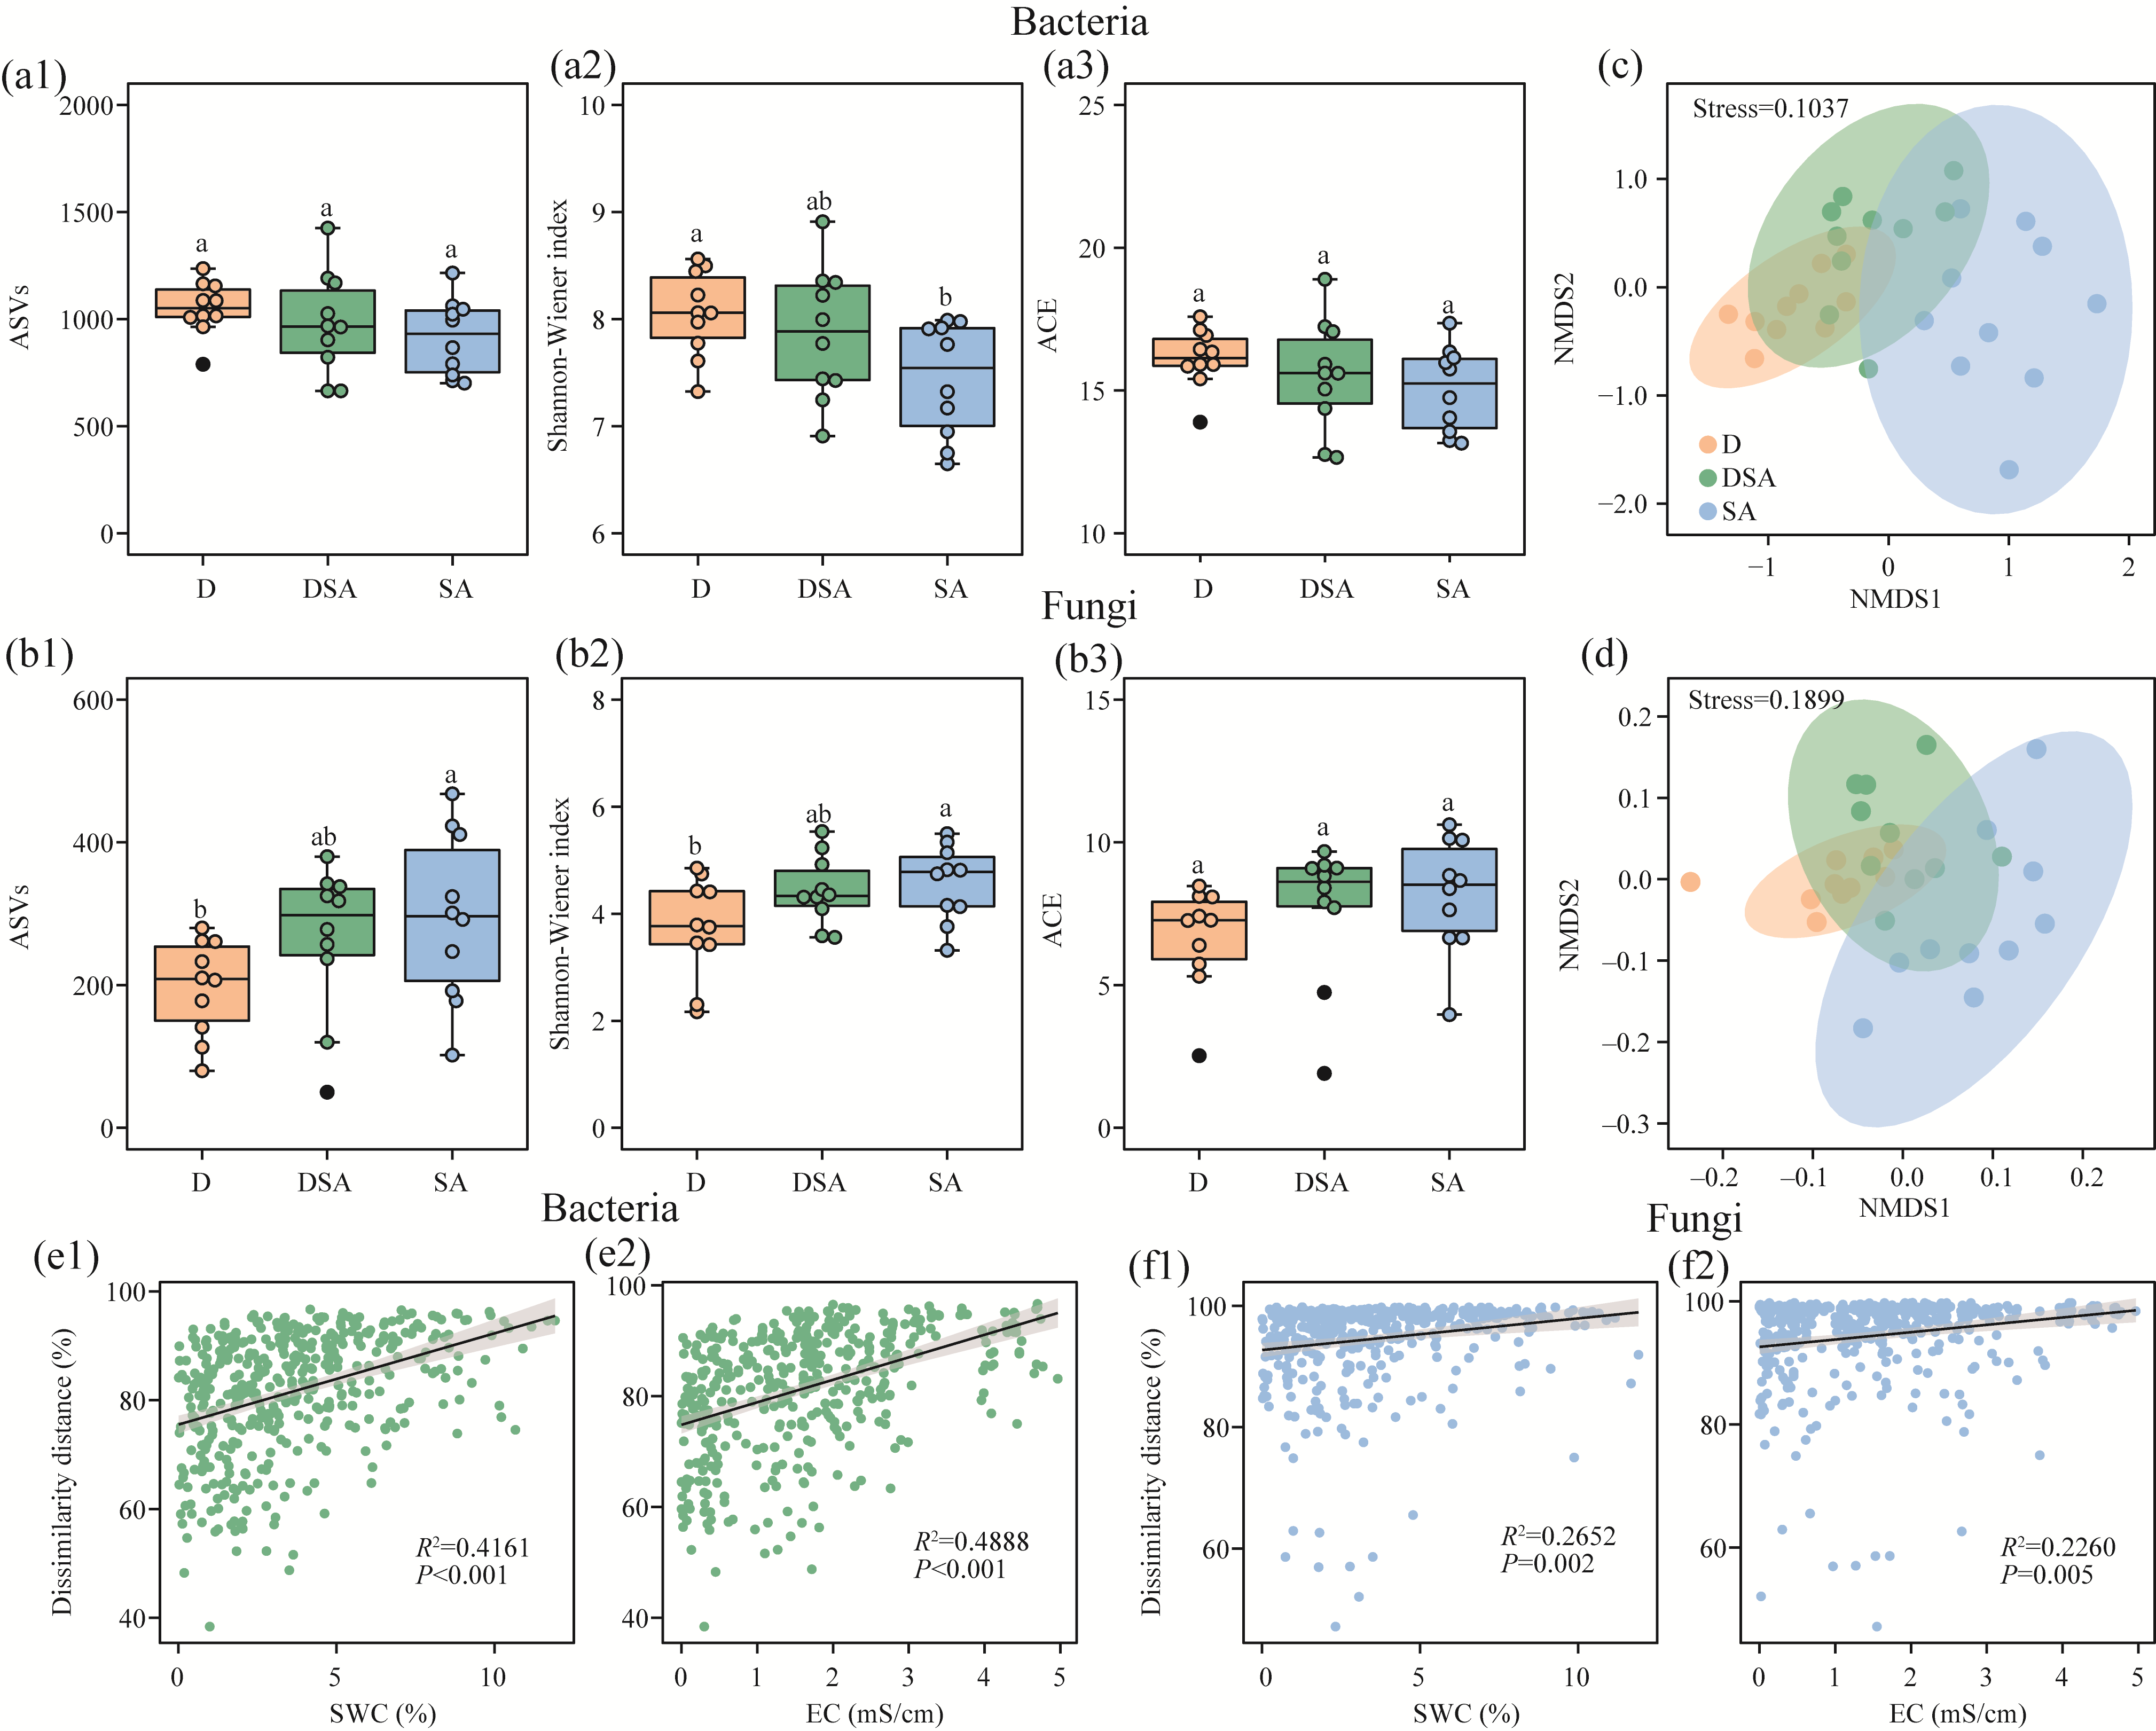
Fig. 4
Amplicon sequence variants (ASVs), alpha diversity, NMDS, and relationships of dissimilarity distance with SWC and EC. (a1-a3), bacterial ASVs and alpha diversity; (b1-b3), fungal ASVs and alpha diversity; (c), NMDS analysis for bacteria; (d), NMDS analysis for fungi; (e1 and e2), relationships of dissimilarity distance with SWC and EC for bacteria, respectively; (f1 and f2), relationships of dissimilarity distance with SWC and EC for fungi, respectively. Different lowercase letters in
Figure 4a1-a3
and
b1-b3
indicate significant differences at P<0.050 level among different groups. ACE, abundance-based coverage estimation.
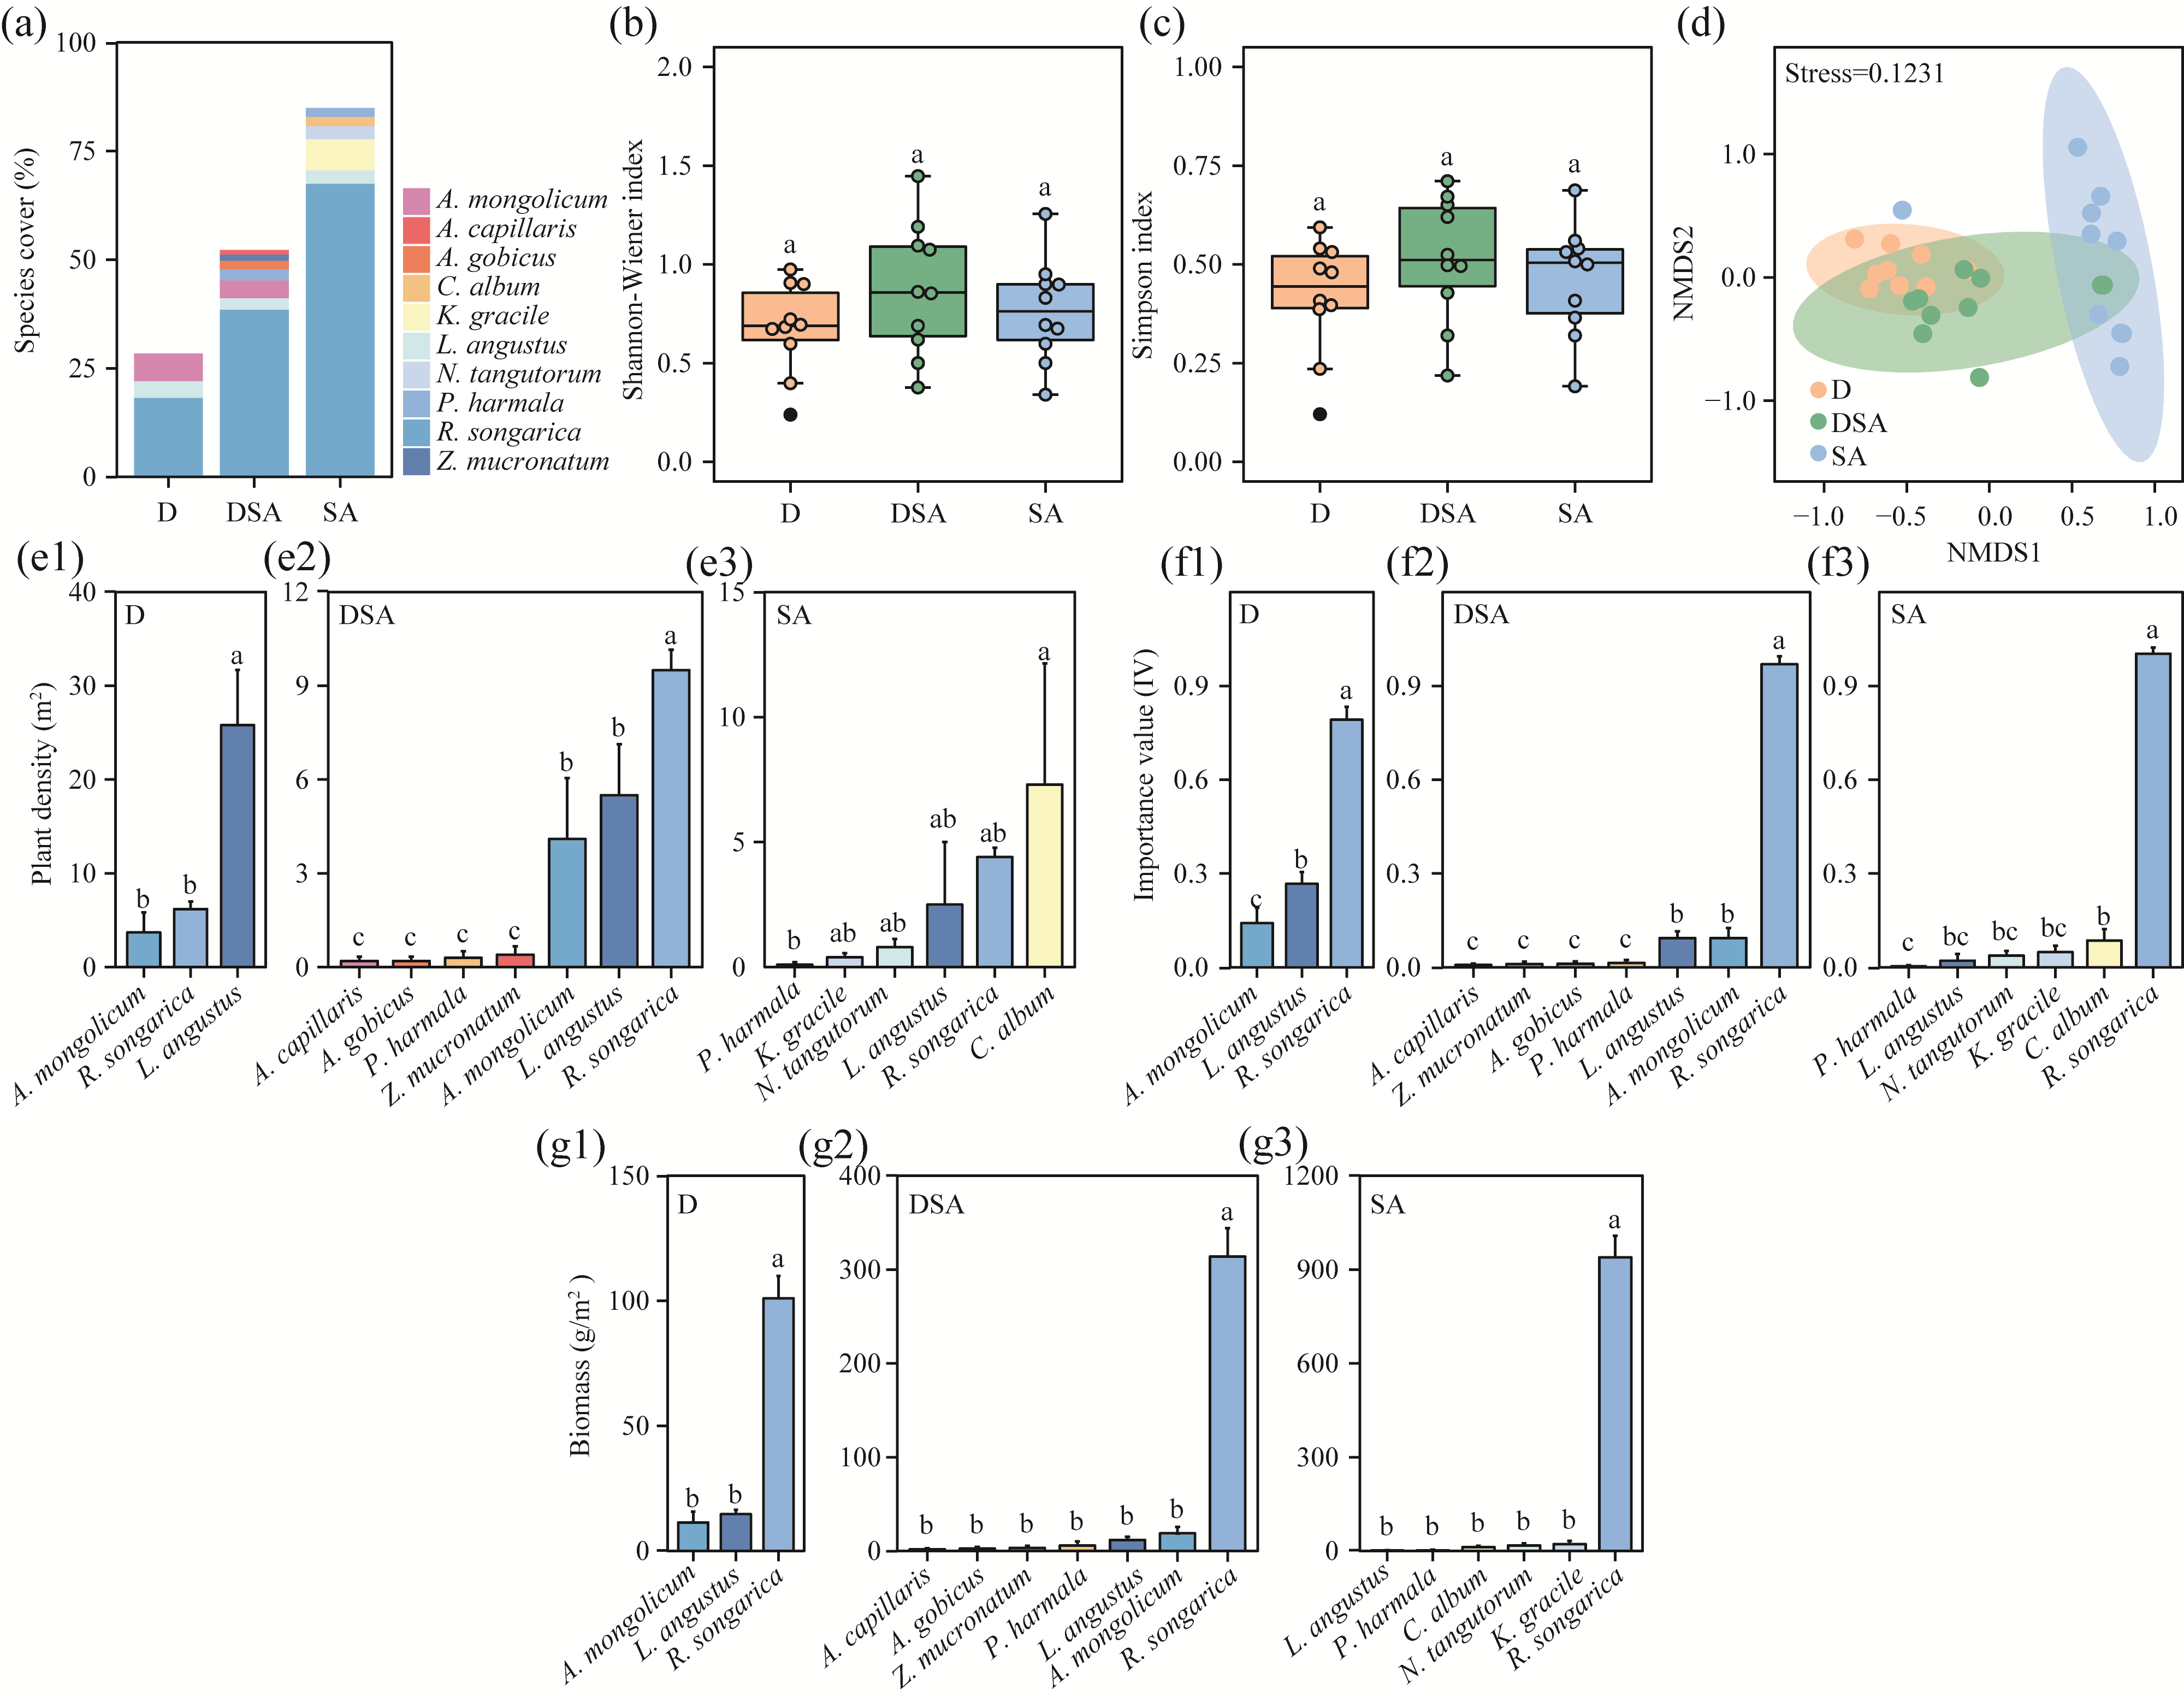
Fig. 3
Composition of plant communities and species attributes. (a), species cover; (b), Shannon-Wiener index; (c), Simpson index; (d), non-metric multidimensional scaling (NMDS) analysis; (e1-e3), plant density; (f1-f3), importance value (IV); (g1-g3) biomass. A. mongolicum, Allium mongolicum Regel; A. capillaris, Artemisia capillaris Thunb.; A. gobicus, Asparagus gobicus Ivanova ex Grubov; C. album, Chenopodium album L.; K. gracile, Kalidium gracile Fenzl.; L. angustus, Leymus angustus (Trin.) Pilg.; N. tangutorum, Nitraria tangutorum Bobrov; P. harmala; Peganum harmala L.; R. songarica, Reaumuria songarica (Pall.) Maxim; Z. mucronatum, Zygophyllum mucronatum Maxim. Different lowercase letters indicate significant differences at P<0.050 level among different groups or plant species. Bars in
Figure 3e1-e3, f1-f3
, and
g1-g3
are standard errors.
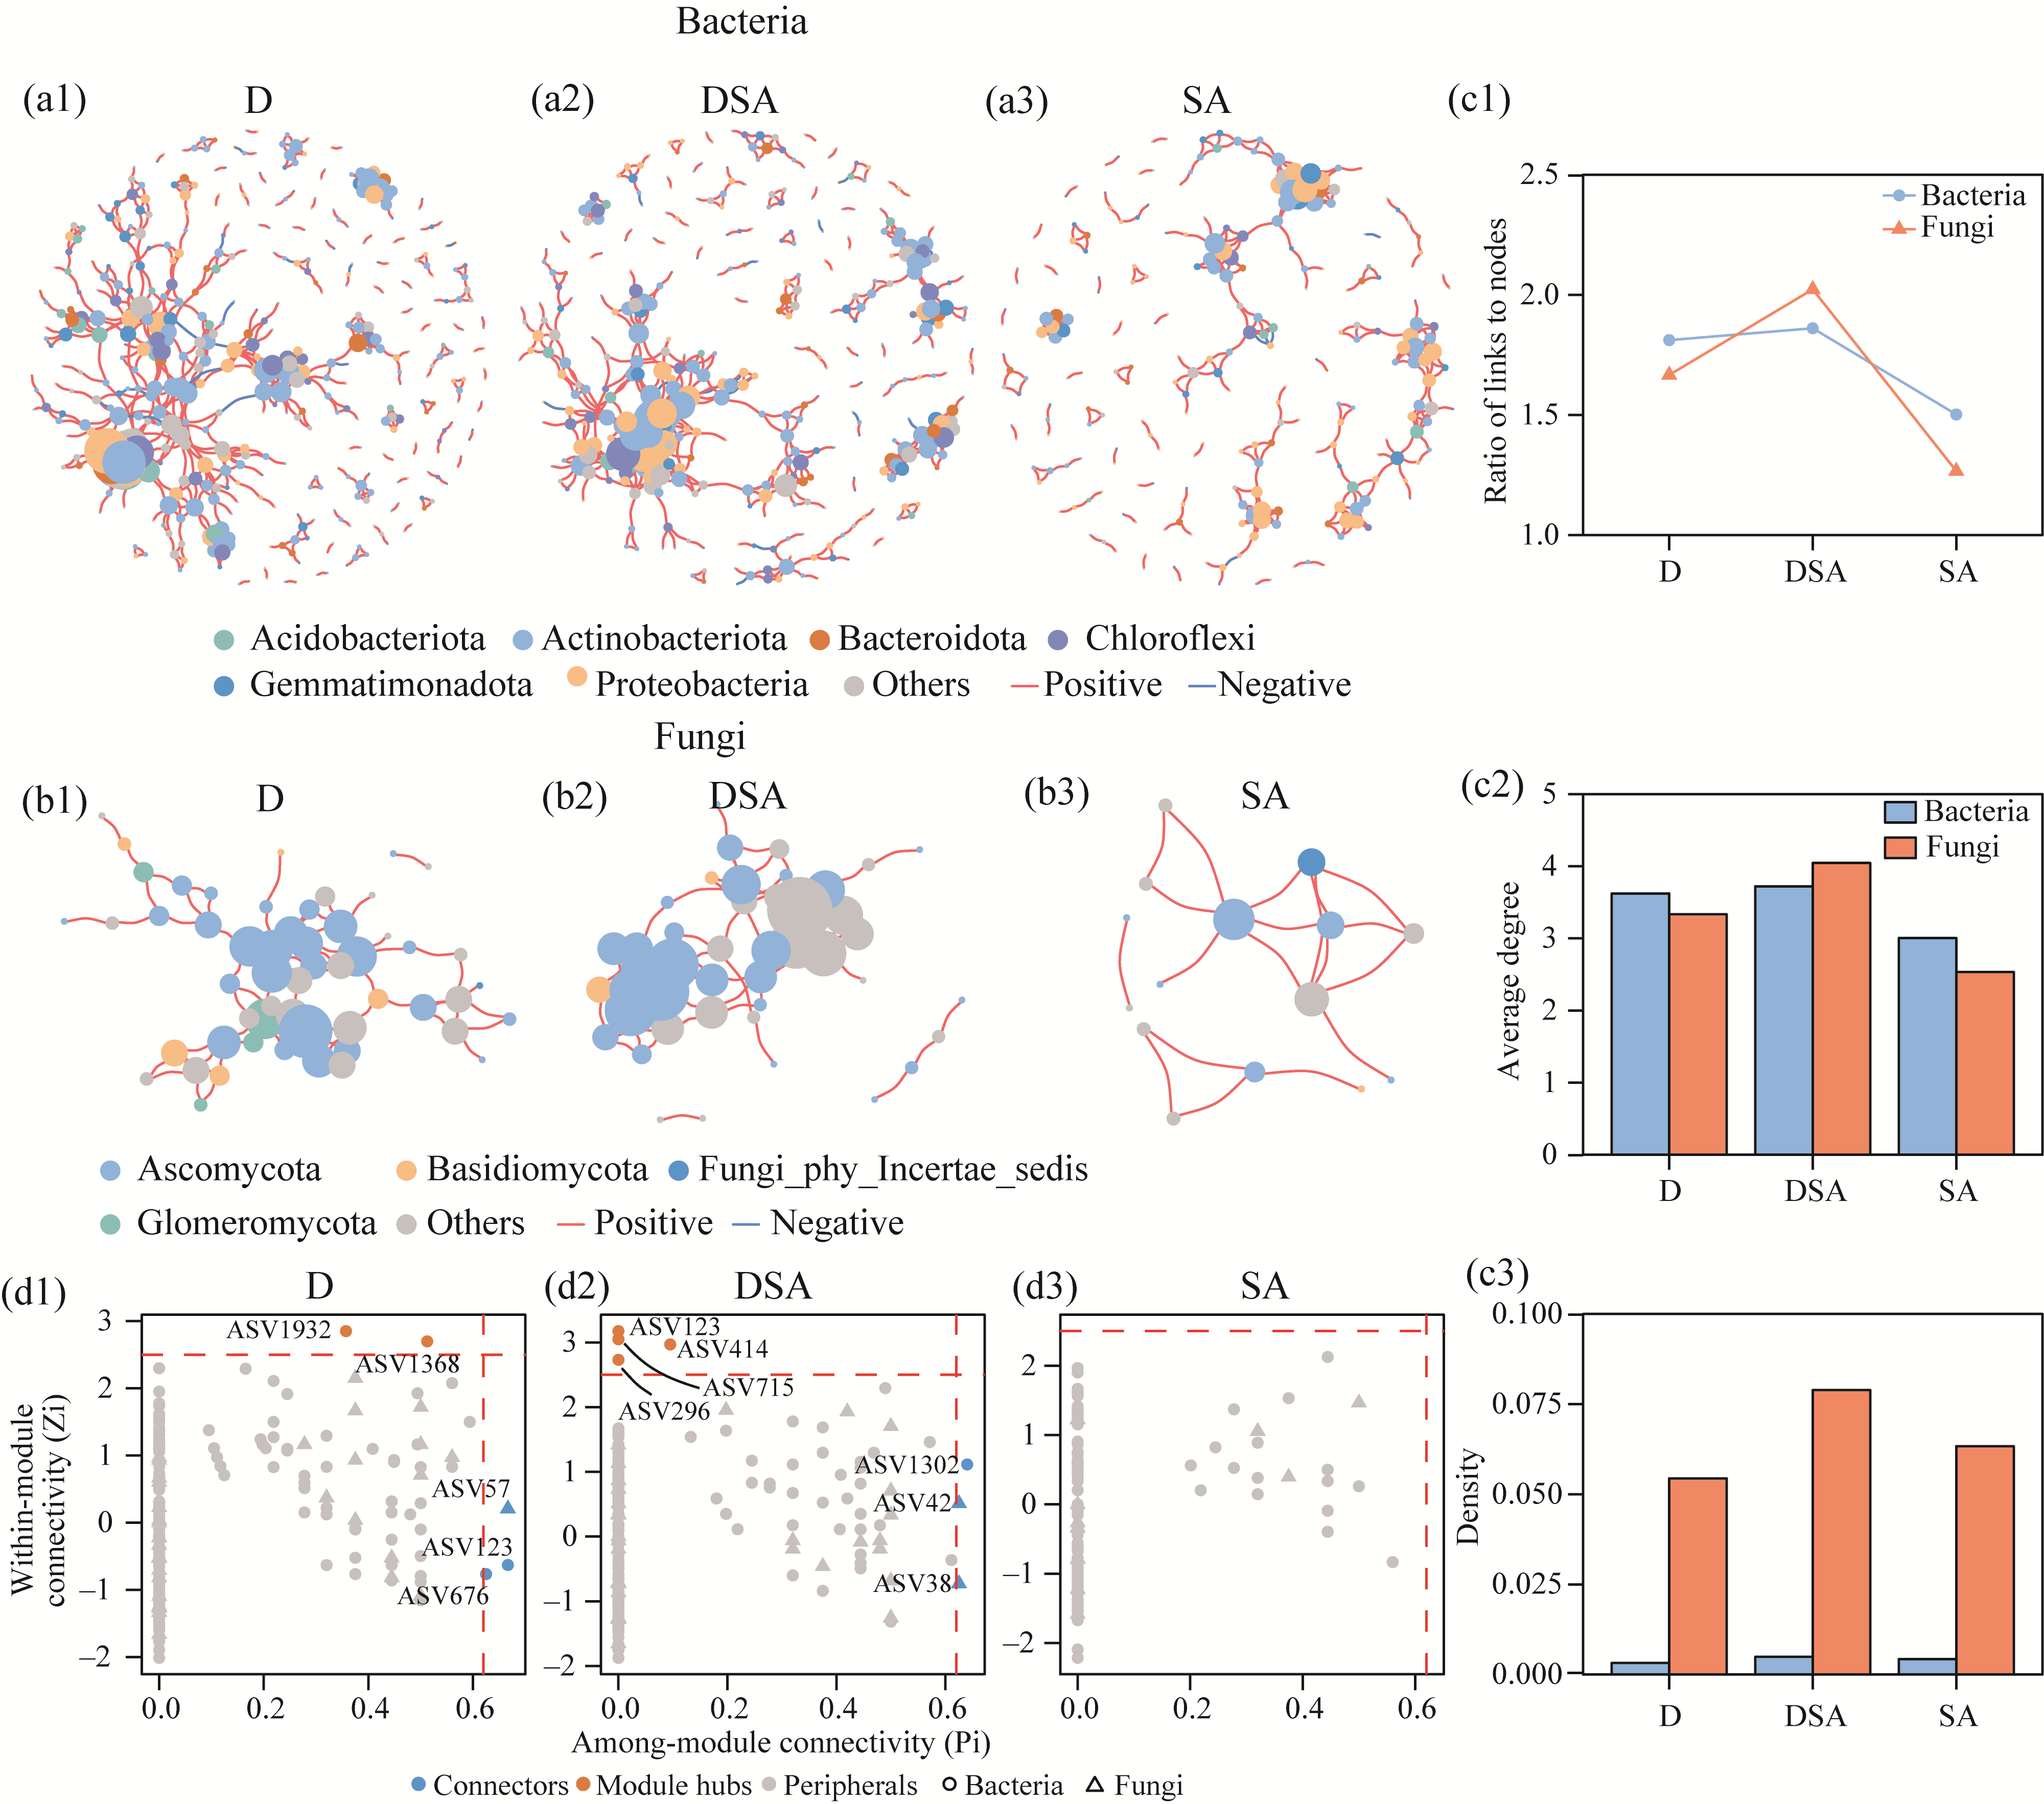
Fig. 5
Co-occurrence networks and topological properties of networks. (a1-a3), bacterial networks in different groups; (b1-b3), fungal networks in different groups; (c1-c3), ratio of links to nodes, average degree, and density in different groups; (d1-d3), within-module connectivity (Zi) and among-module connectivity (Pi) plots showing the distribution of ASVs based on their topological roles and ability to predict keystone ASVs in networks, with red dashed lines on the x-axis and y-axis representing Pi=0.62 and Zi=2.5, respectively. In Figure a1-a3 and b1-b3, nodes represent ASVs. The node color represents the top 6 phyla, and node size indicates the degree.
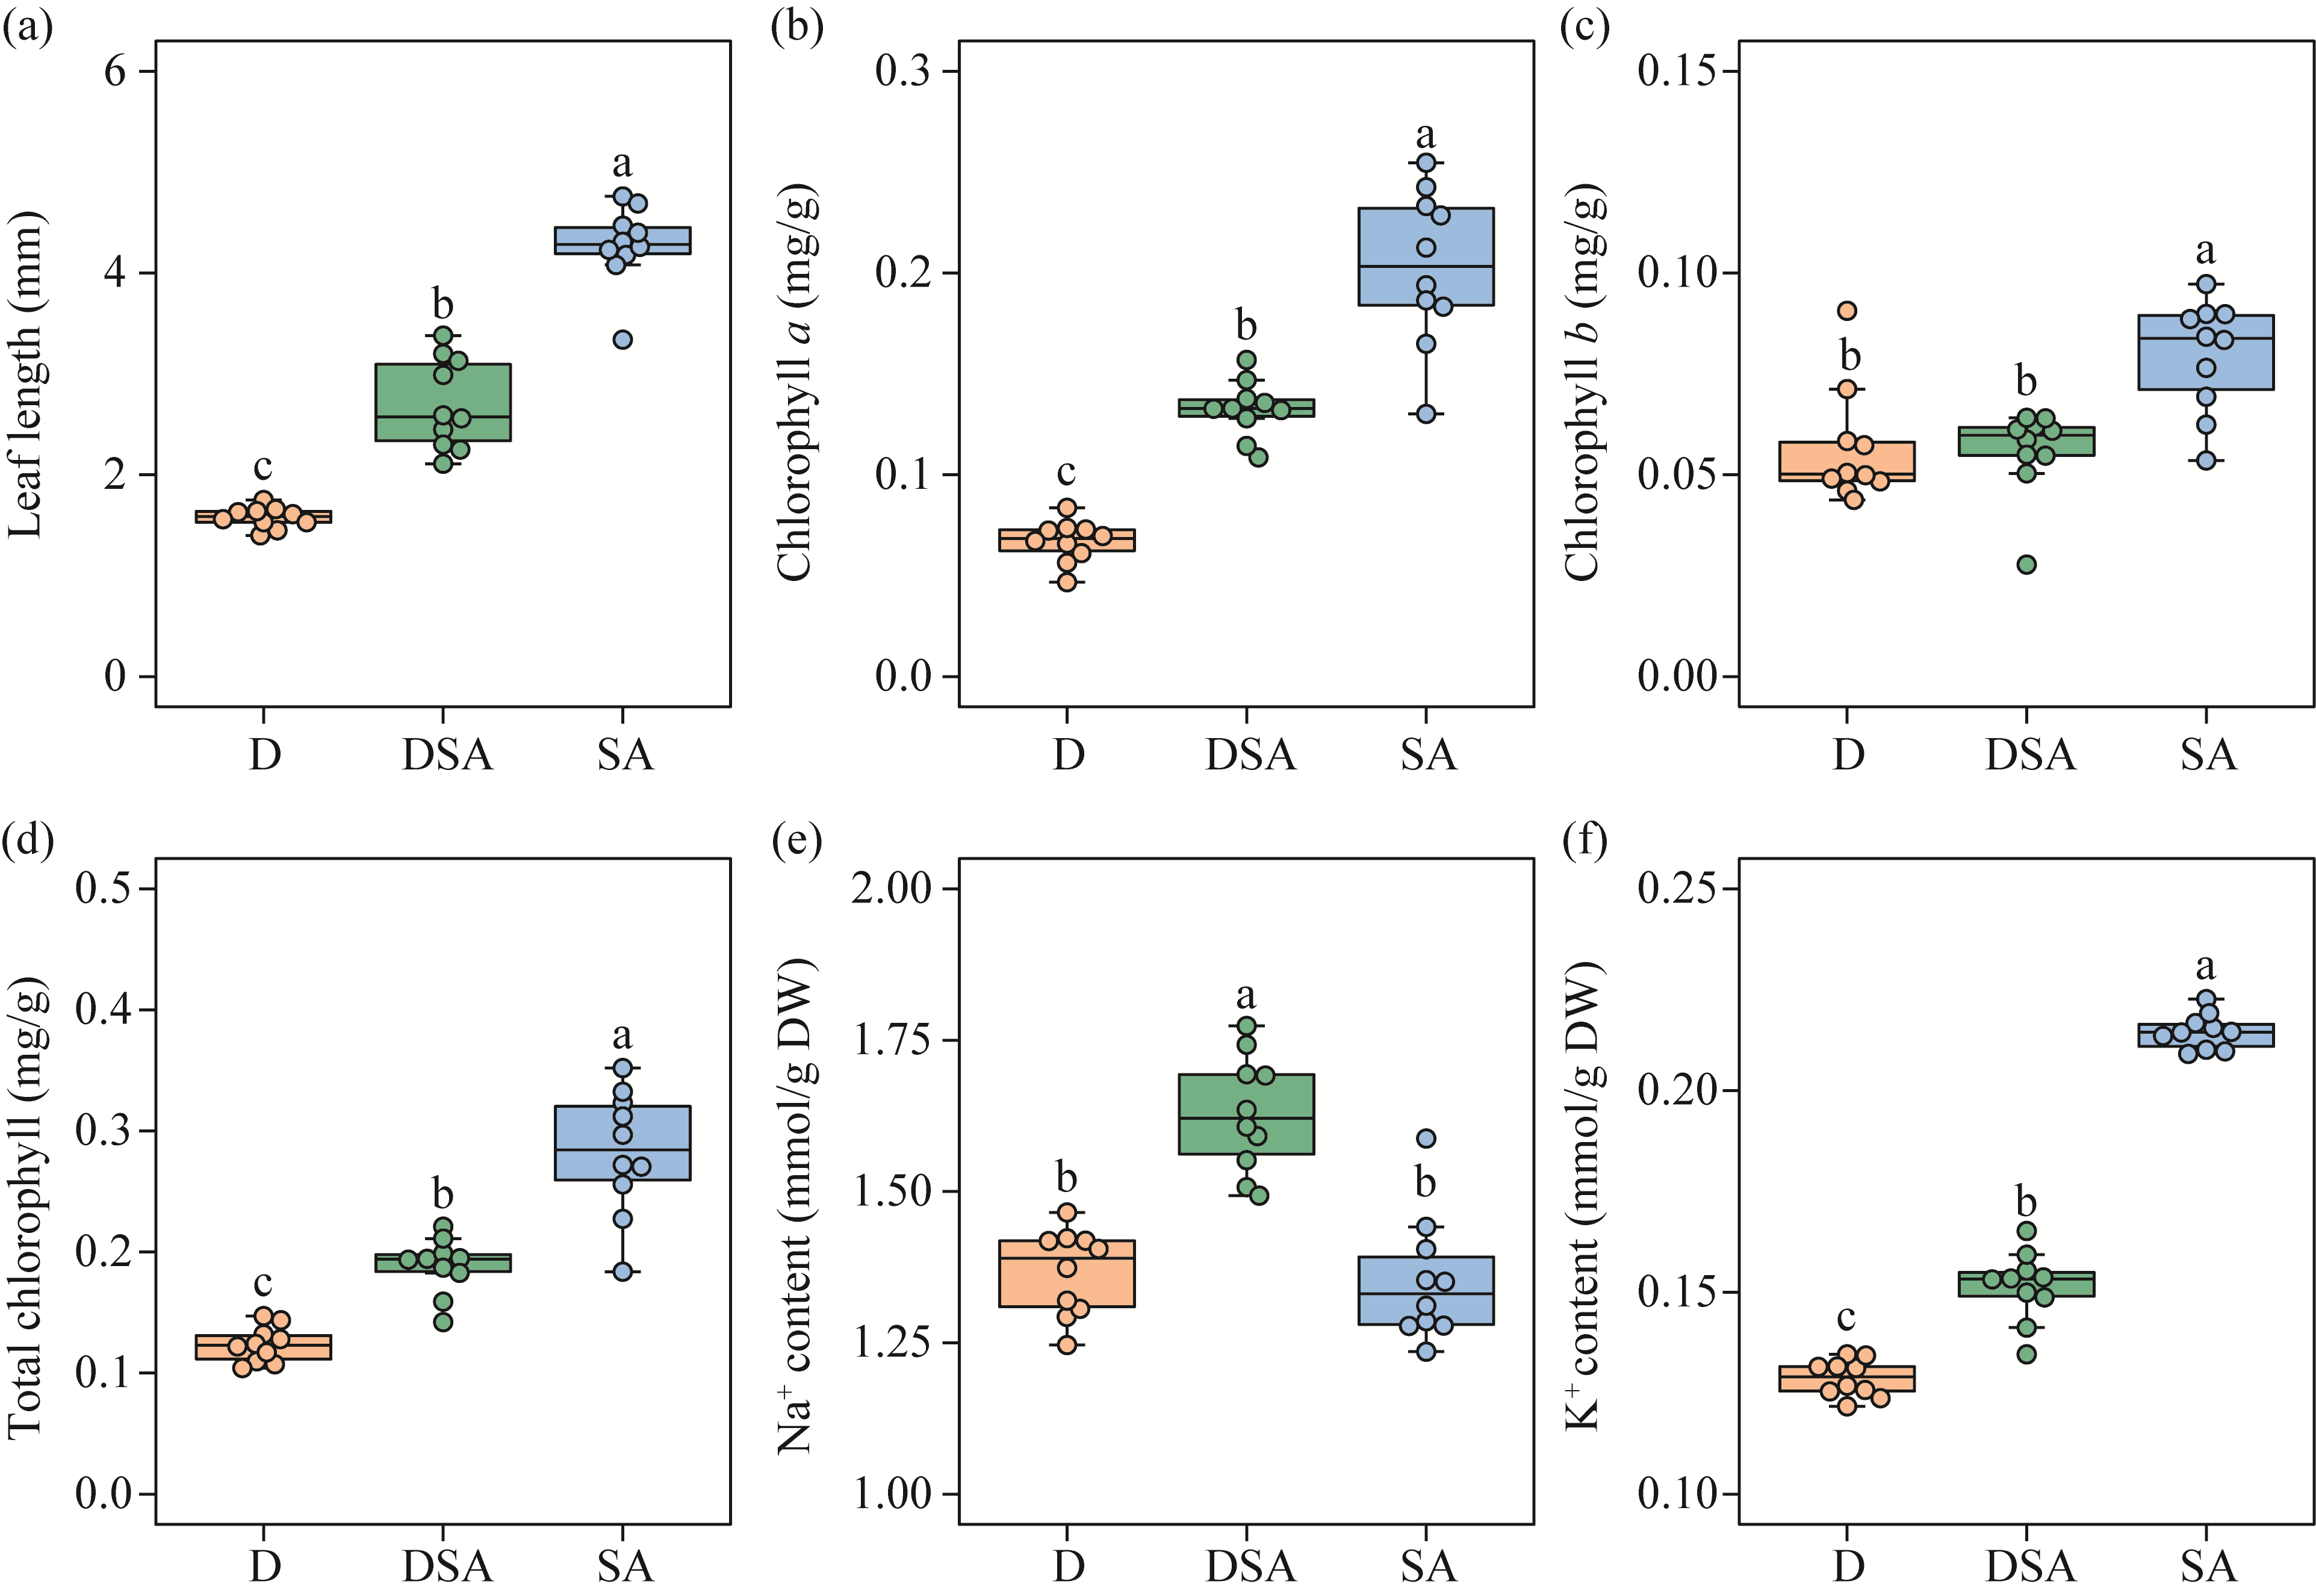
Fig. S1
Traits of the dominant plant species (
R
.
songarica
). (a), leaf length; (b), chlorophyll
a
; (c), chlorophyll
b
; (d), total chlorophyll; (e), Na
+
content; (f), K
+
content. D, drought; SA, saline-alkaline; DSA, combined stress of D and SA; DW, dry weight. Boxes indicate the IQR (interquartile range, 75
th
to 25
th
of the data). The median value is shown as a line within the box. Whiskers extend to the most extreme value within 1.5×IQR. Different lowercase letters indicate significant differences at
P
<0.050 level among different groups.
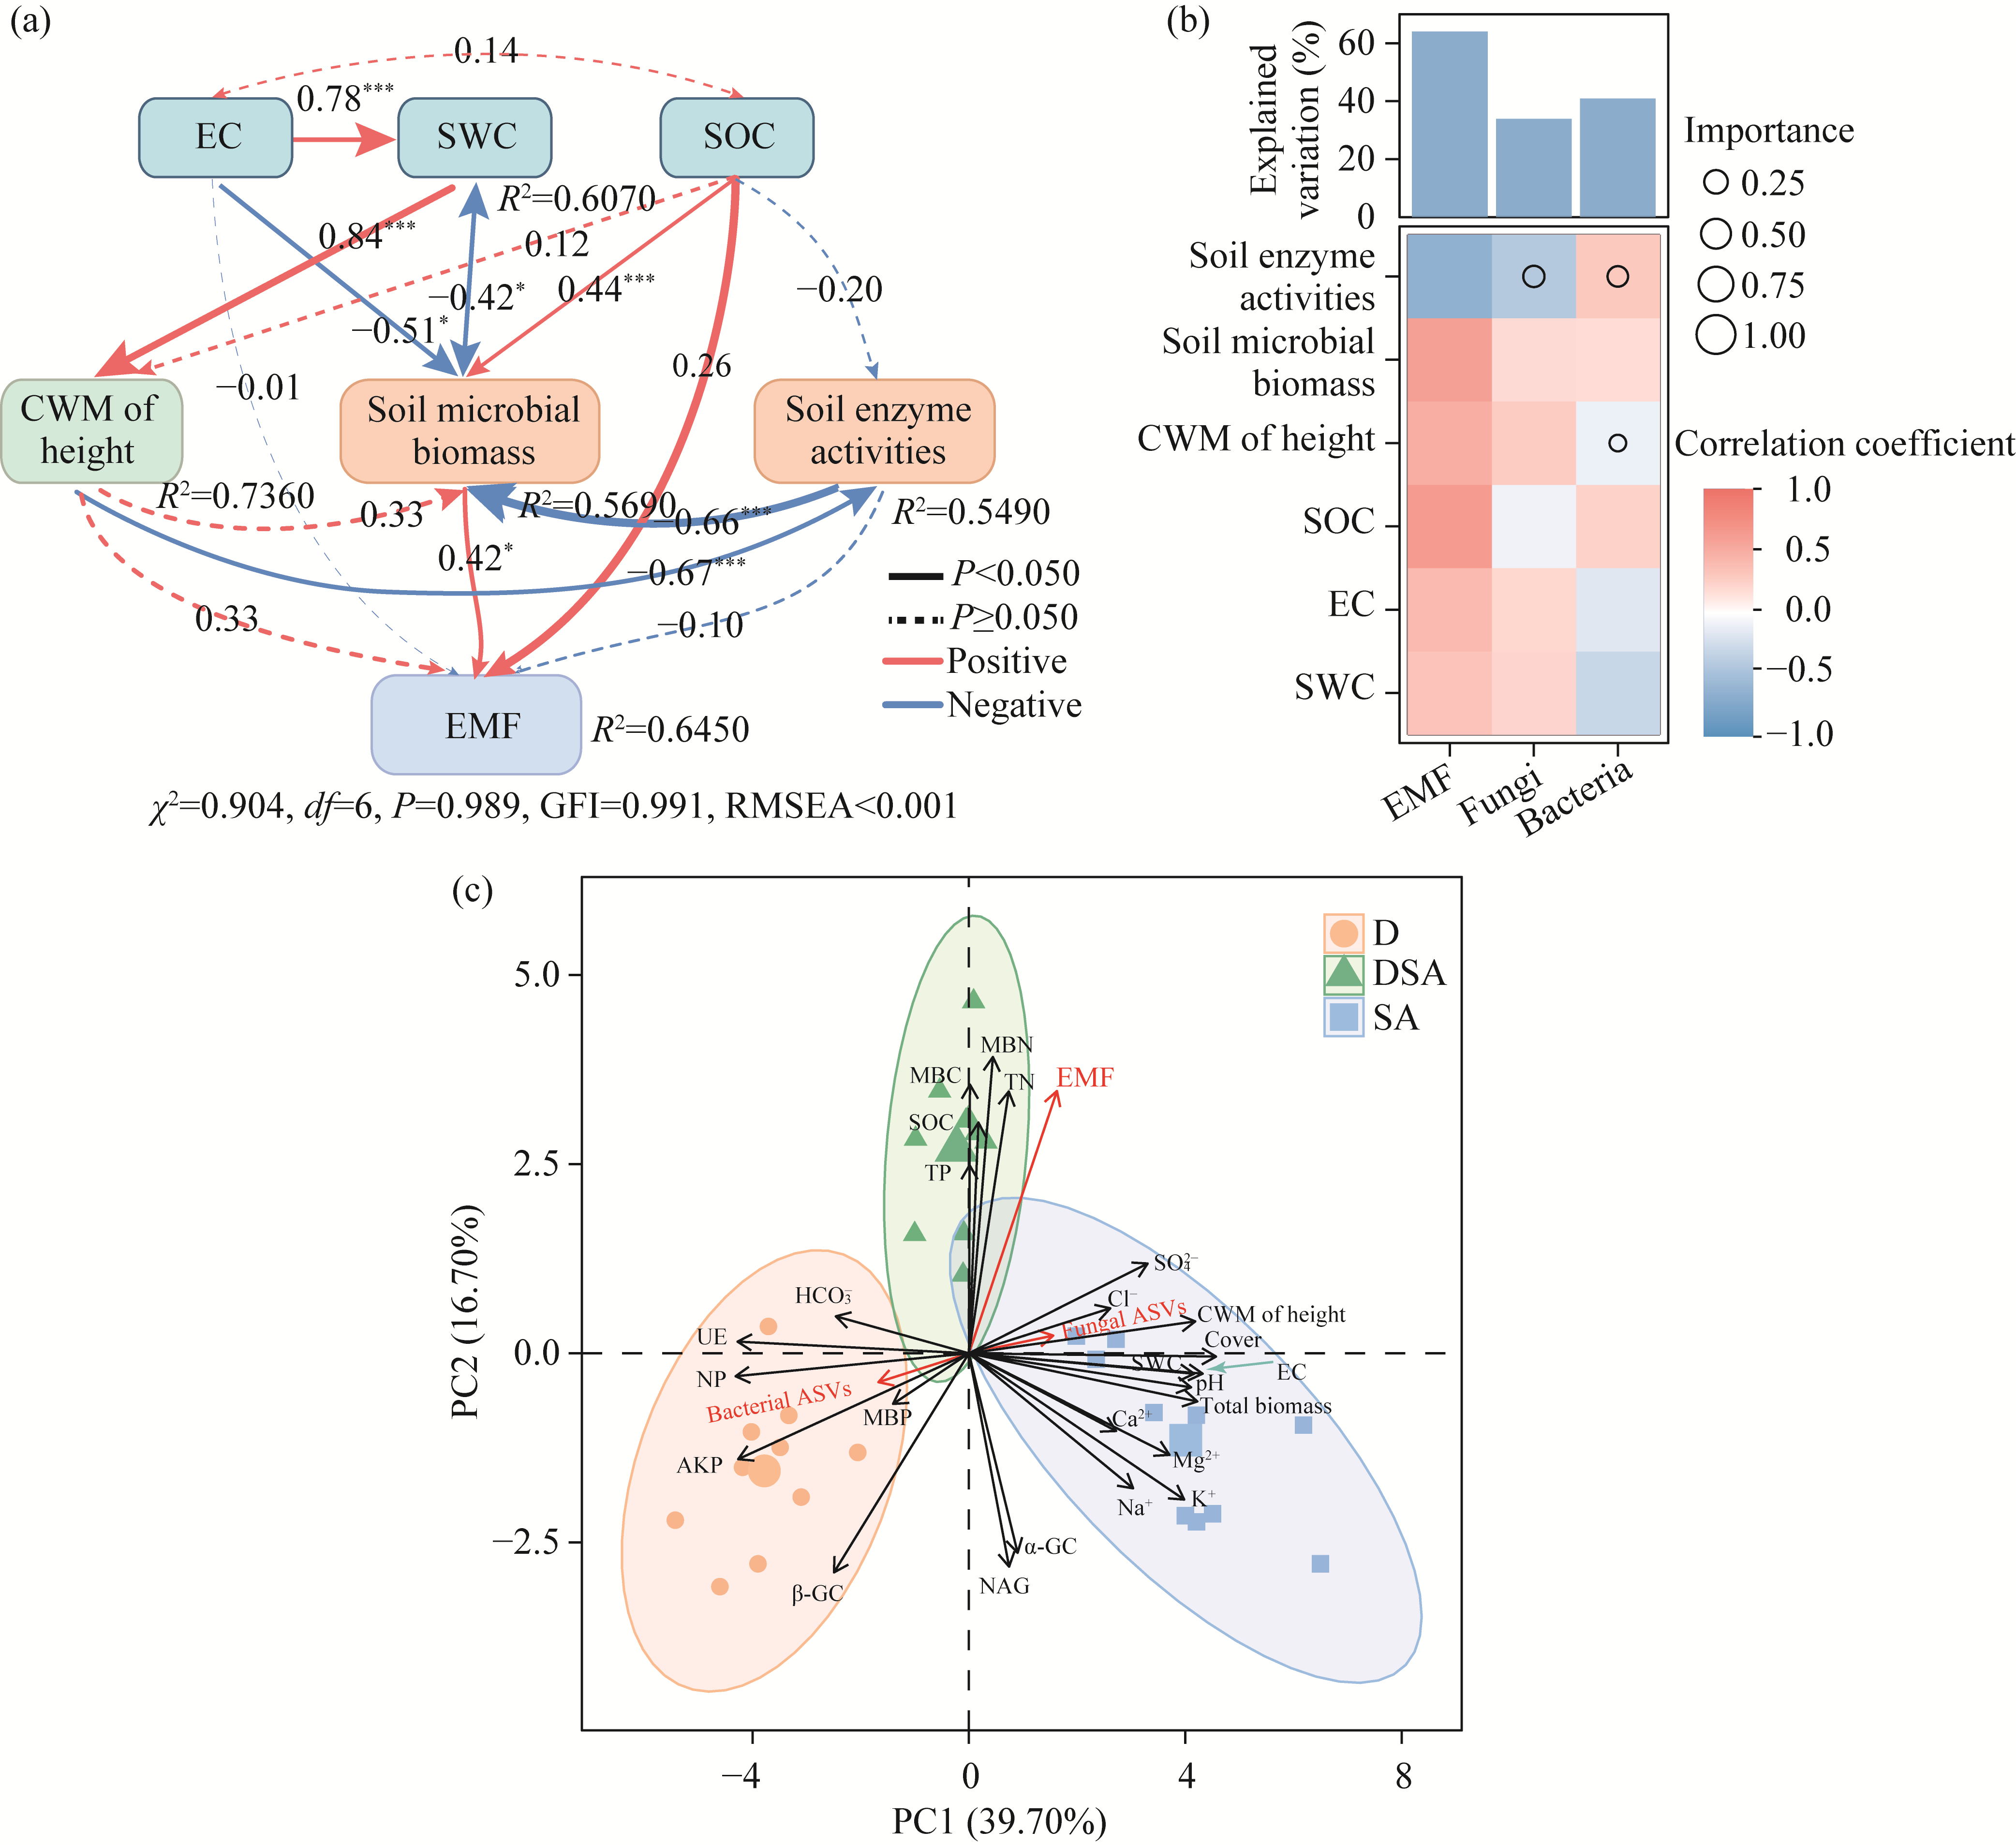
Fig. 6
Drivers of ecosystem multifunctionality (EMF). (a), SEM (structural equation modeling) showing the direct and indirect effects of factors; (b), contributions of biotic and abiotic factors to soil microbial ASVs and EMF based on Spearman's correlation and regression model; (c), PCA (principal component analysis) result. GFI, comparative fit index; RMSEA, root mean square error of approximation; PC, principal component; UE, urease; NP, neutral phosphatase; AKP, alkaline phosphatase; β-GC, β-glucosidase; NAG, N-acetyl-glucosaminidase; α-GC, α-glucosidase.
*
, P<0.050 level;
***
, P<0.001 level.
Table S3
Distribution of keystone taxa in bacterial and fungal networks
Table 1
Soil ions content and soil enzyme activities in different groups
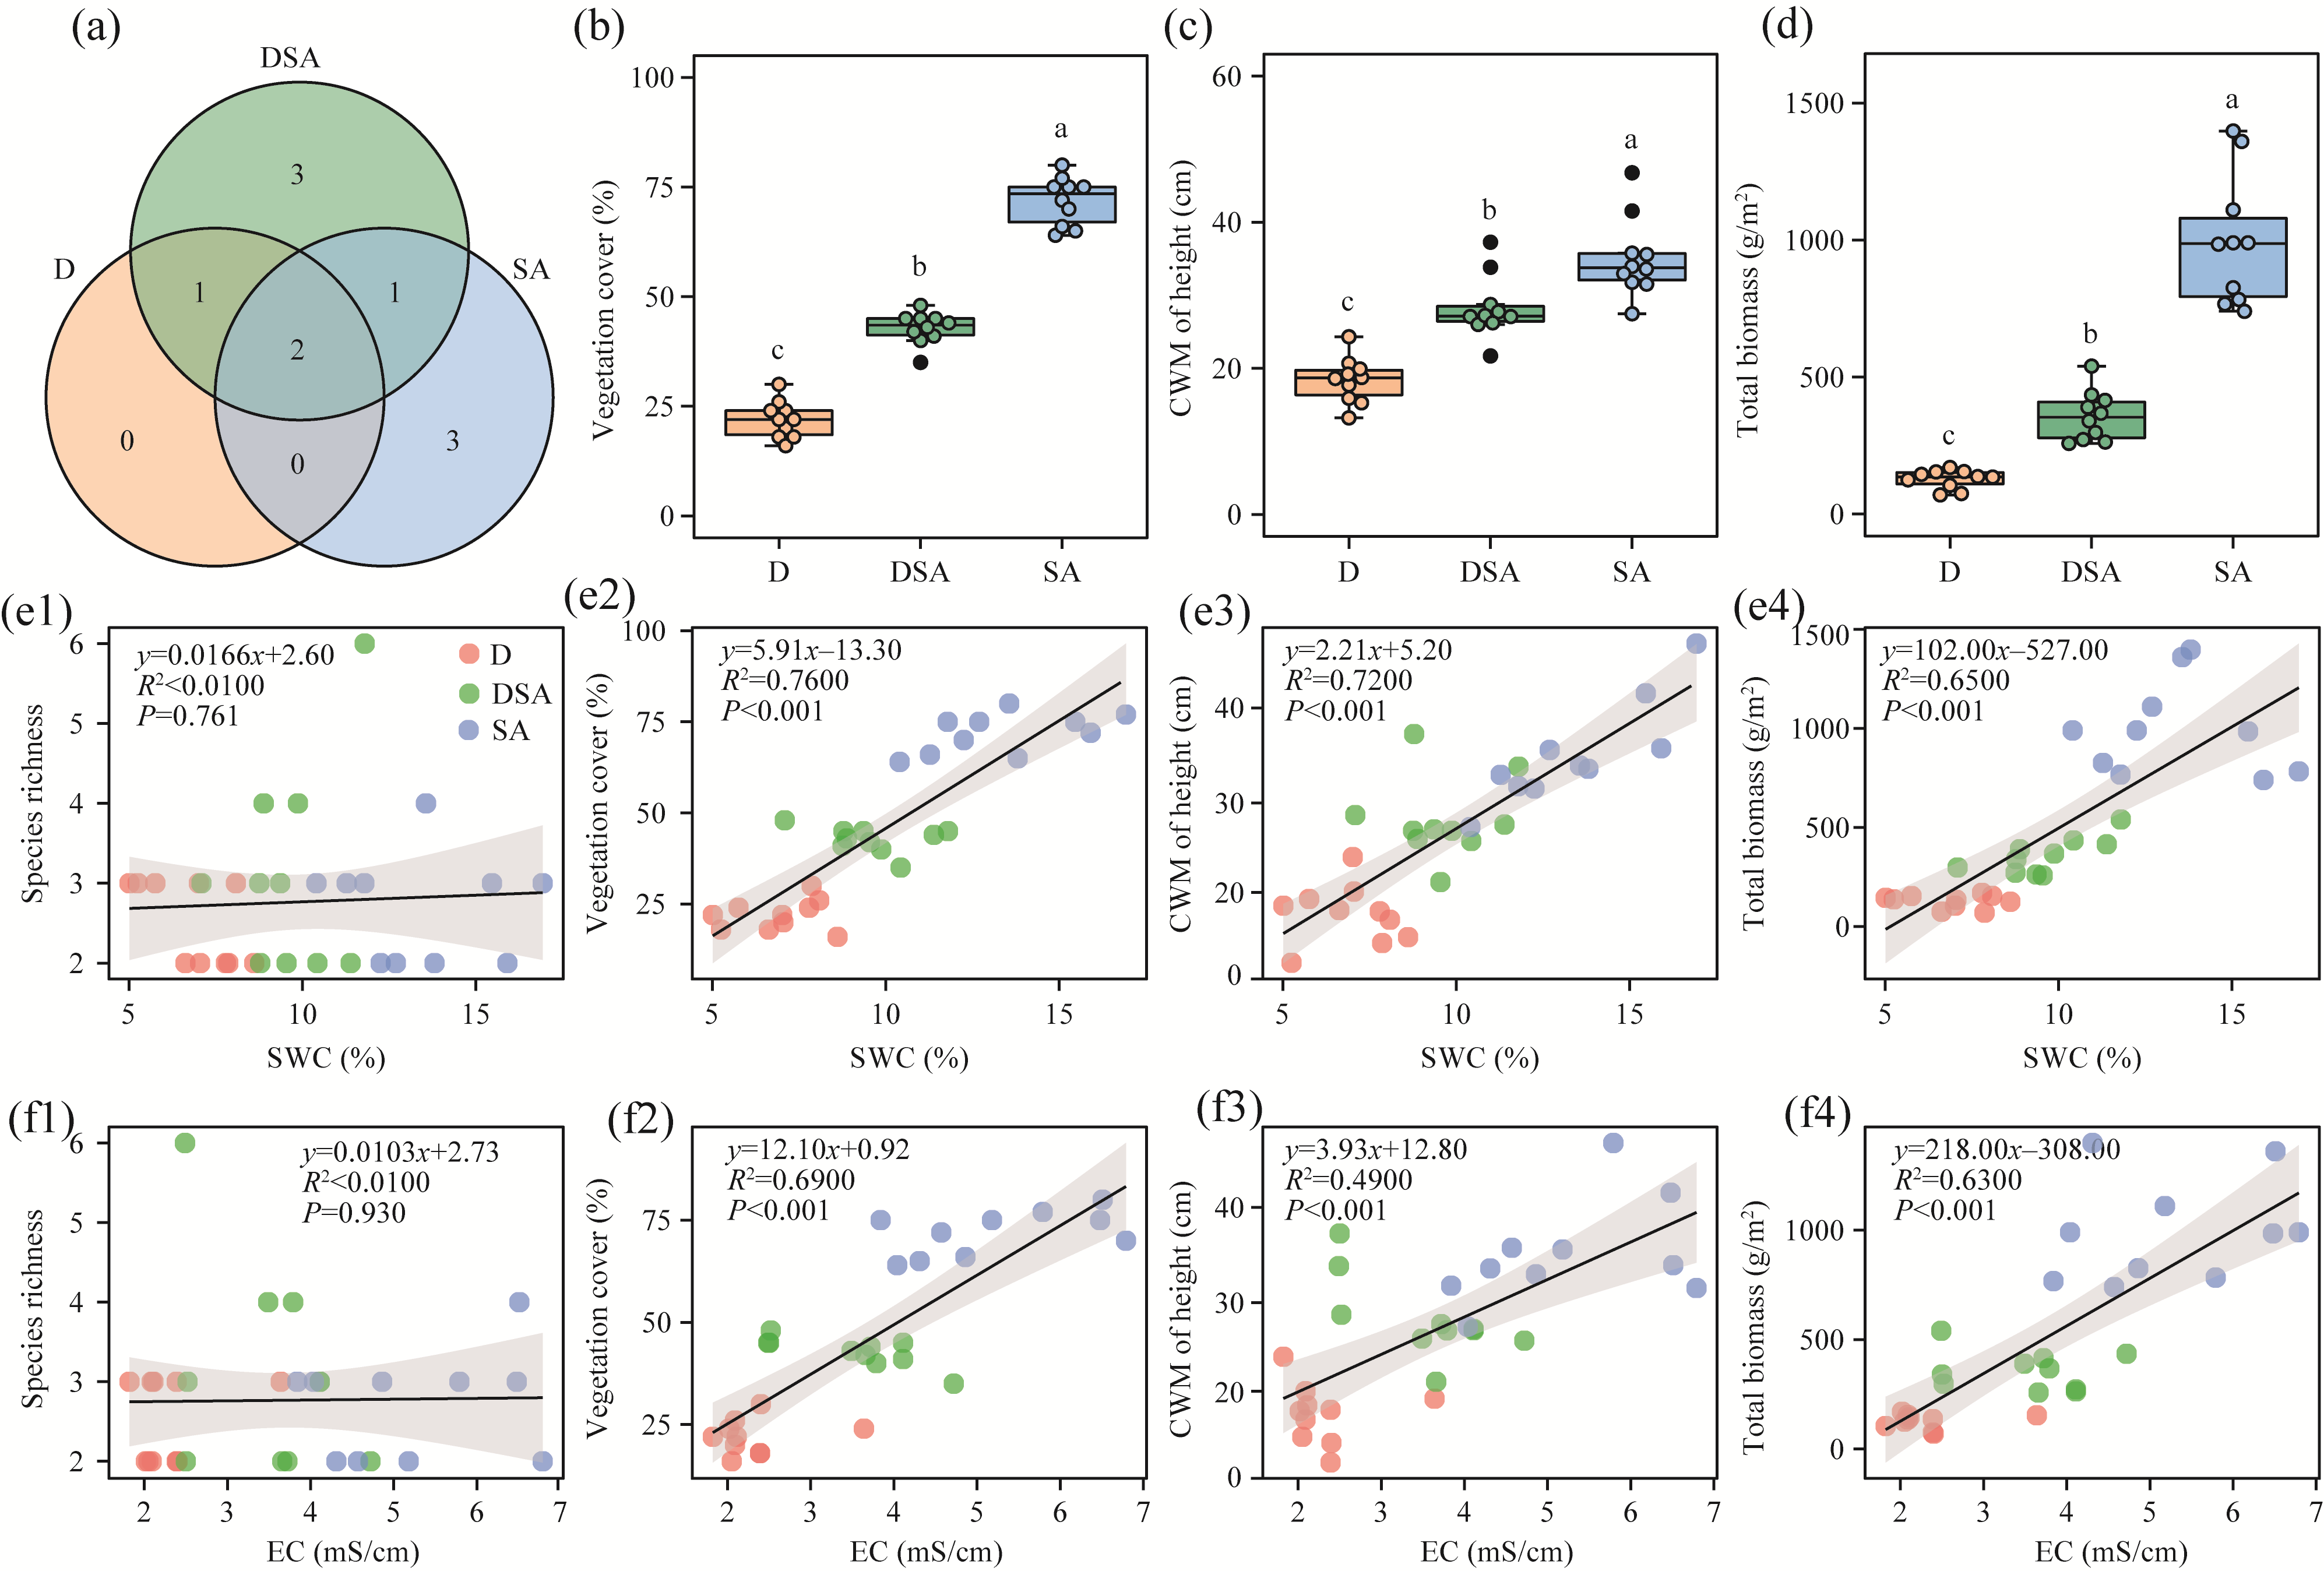
Fig. 2
Plant community features and their relationship with SWC and EC. (a), Venn diagram showing the number of unique and shared plant species; (b), vegetation cover; (c), CWM (community-weighted mean value) of height; (d), total biomass; (e1-e4), relationships between plant community features and SWC; (f1-f4), relationships between plant community features and EC. Different lowercase letters in
Figure 2b-d
indicate significant differences at P<0.050 level among different groups. Shaded area in
Figure 2e1-e4
and
f1-f4
indicates the 95.00% confidence interval.
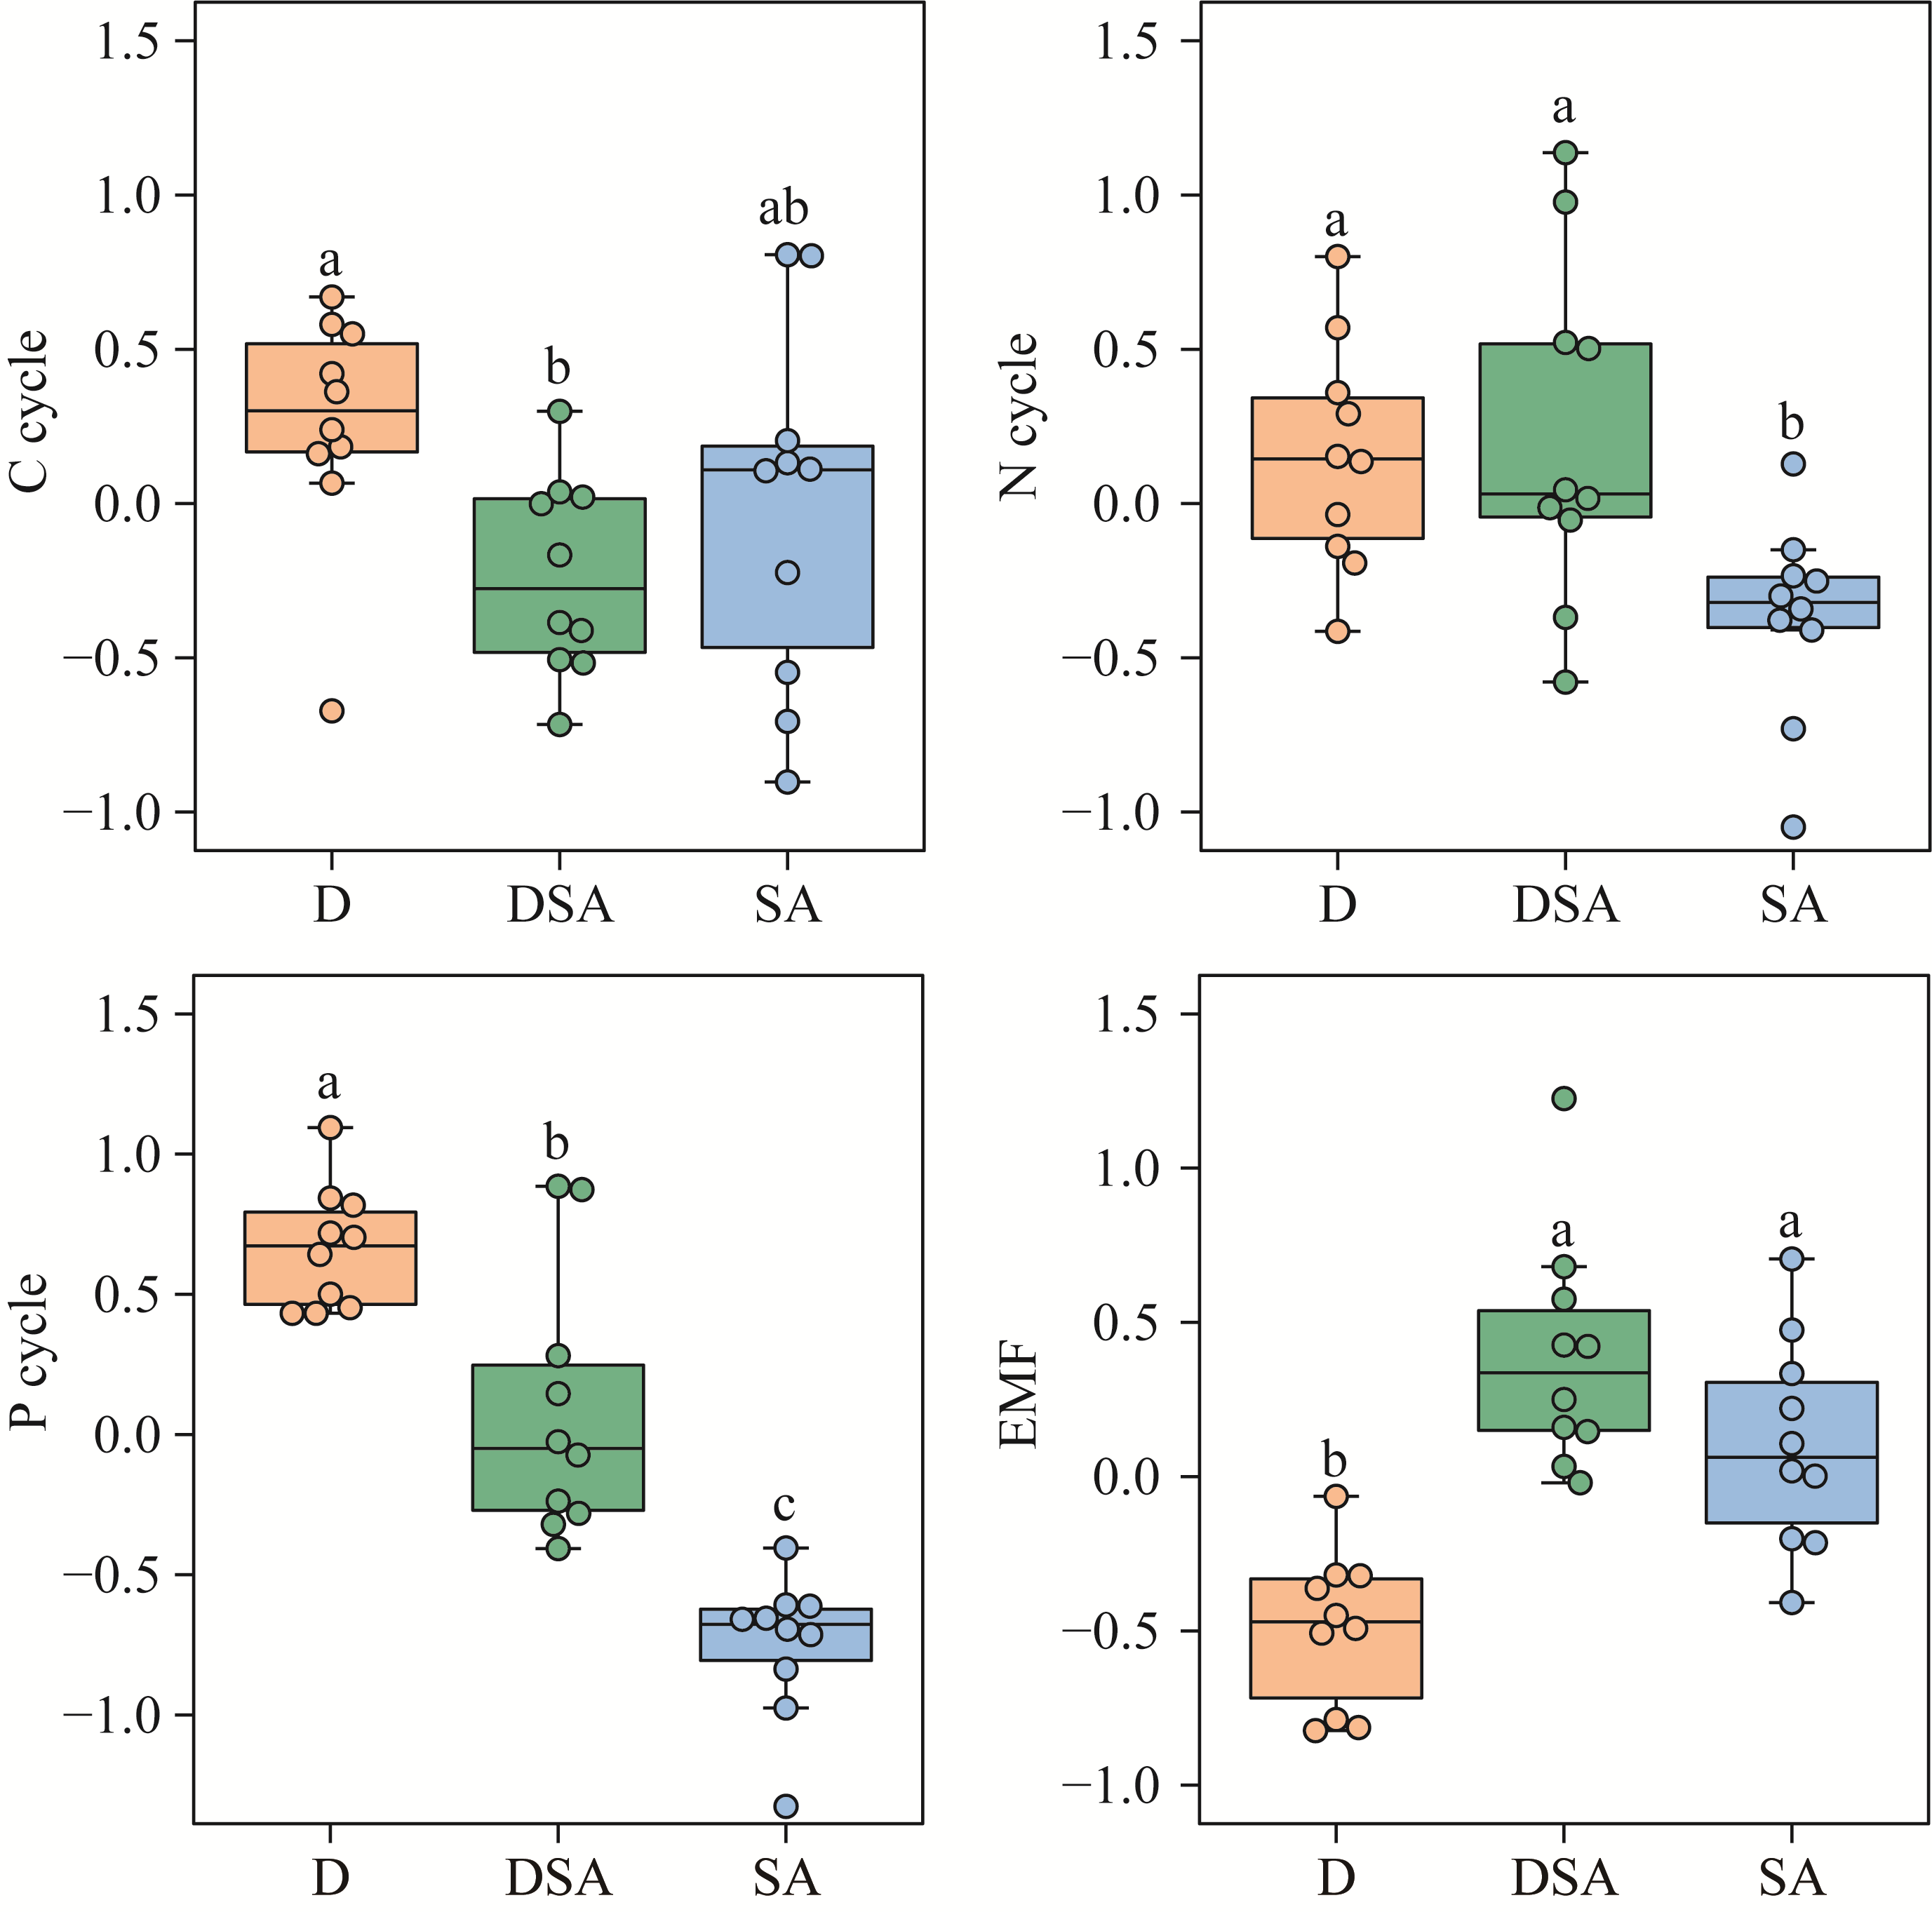
Fig. S3
Soil carbon (C; a), nitrogen (N; b), and phosphorus (P; c) cycles and ecosystem multifunctionality (EMF; d). Different lowercase letters indicate significant differences at
P
<0.050 level among different groups.
Table S1
Distribution of plants in each group
Table S2
Classification of nodes to identify keystone taxa in bacterial and fungal networks
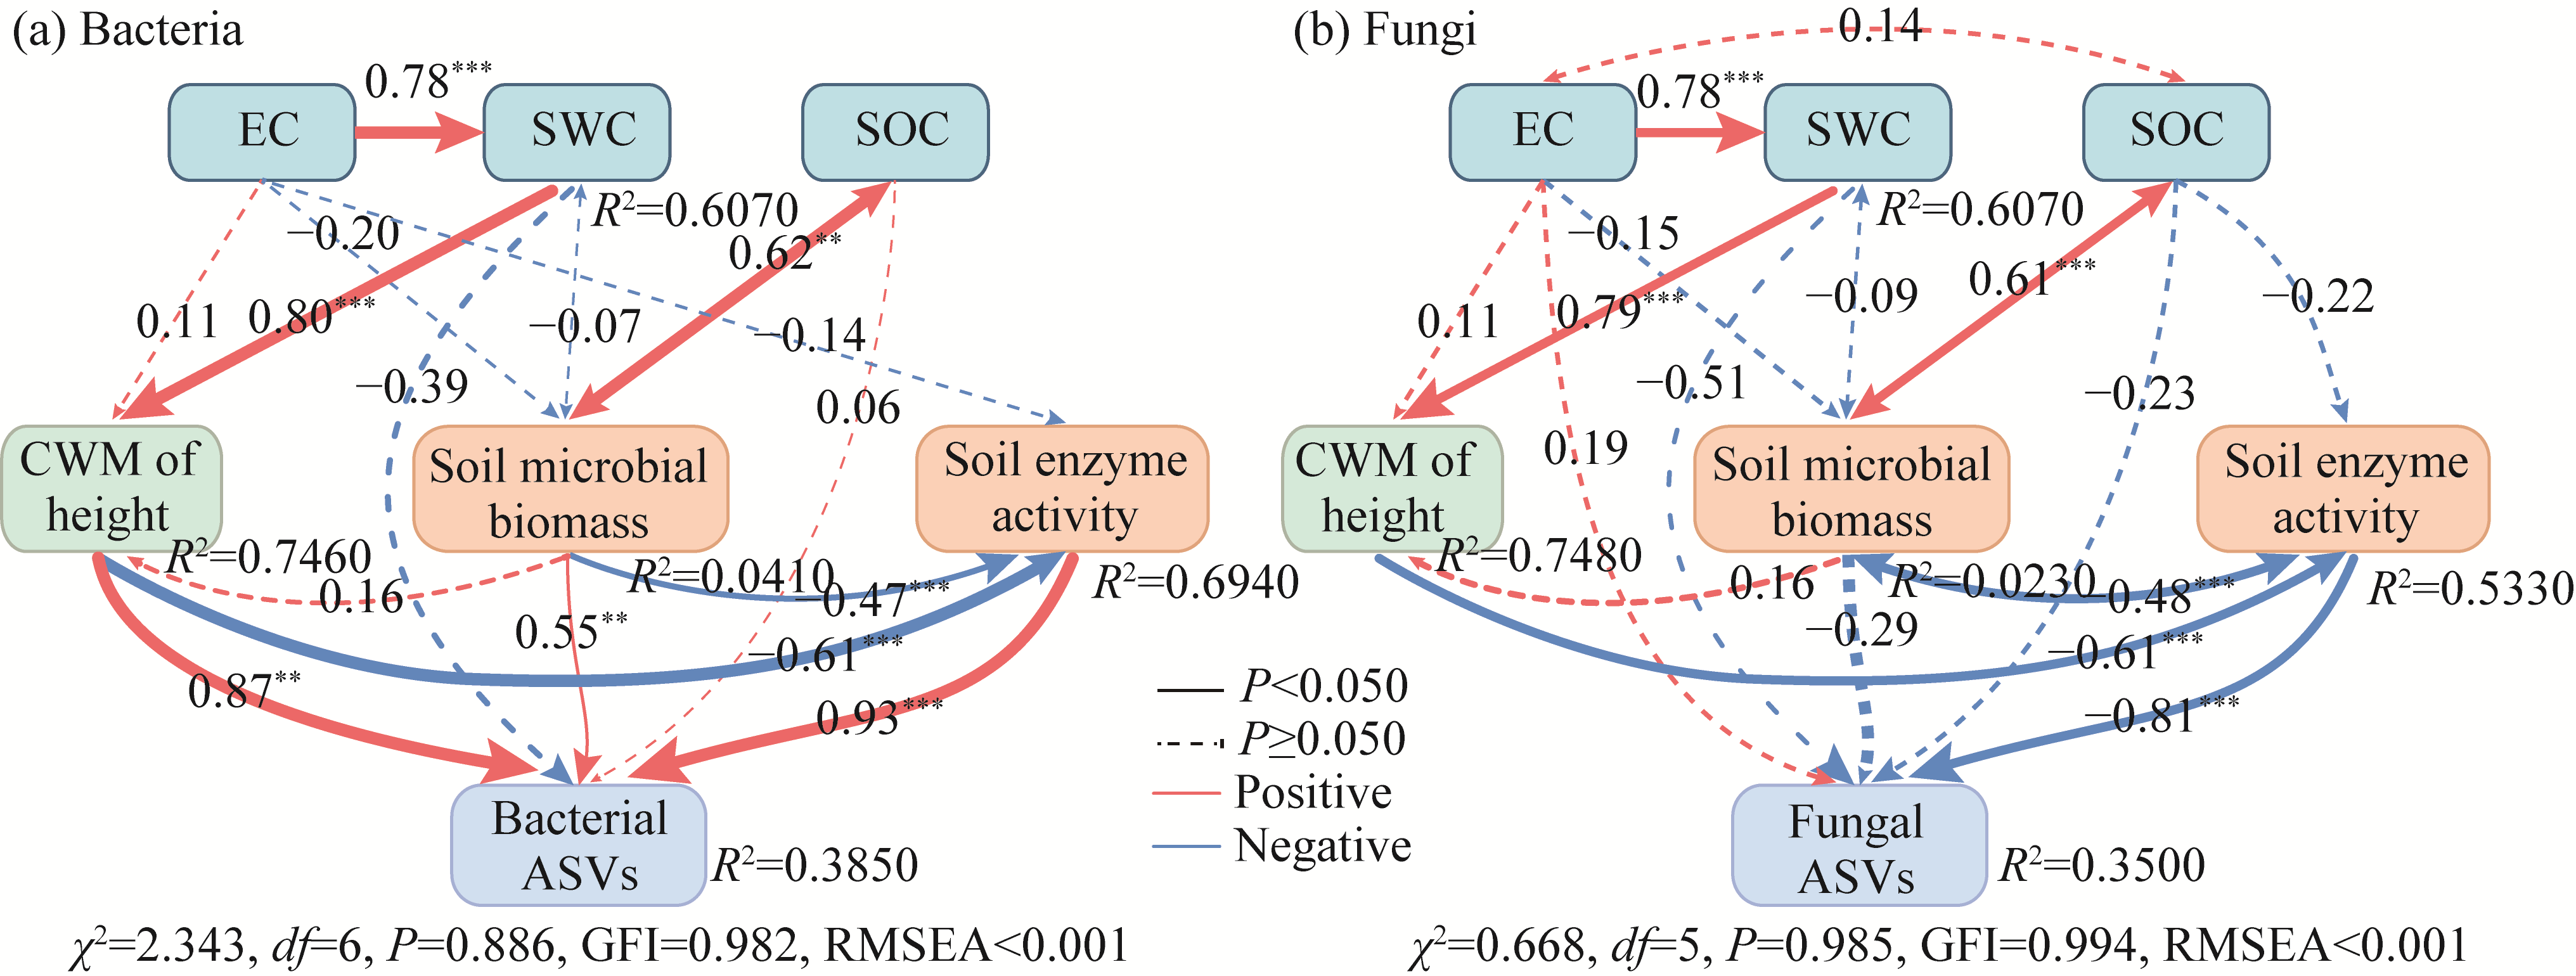
Fig. S4
Structural equation modeling (SEM) showing the direct and indirect effects of drivers of soil microbial amplicon sequence variants (ASVs). (a), bacteria; (b), fungi. EC, electrical conductivity; SWC, soil water content; SOC, soil organic carbon; CWM, community-weighted means; GFI, goodness-of-fit index; RMSEA, root mean square error of approximation;
**
,
P
<0.010 level;
***
,
P
<0.001 level.