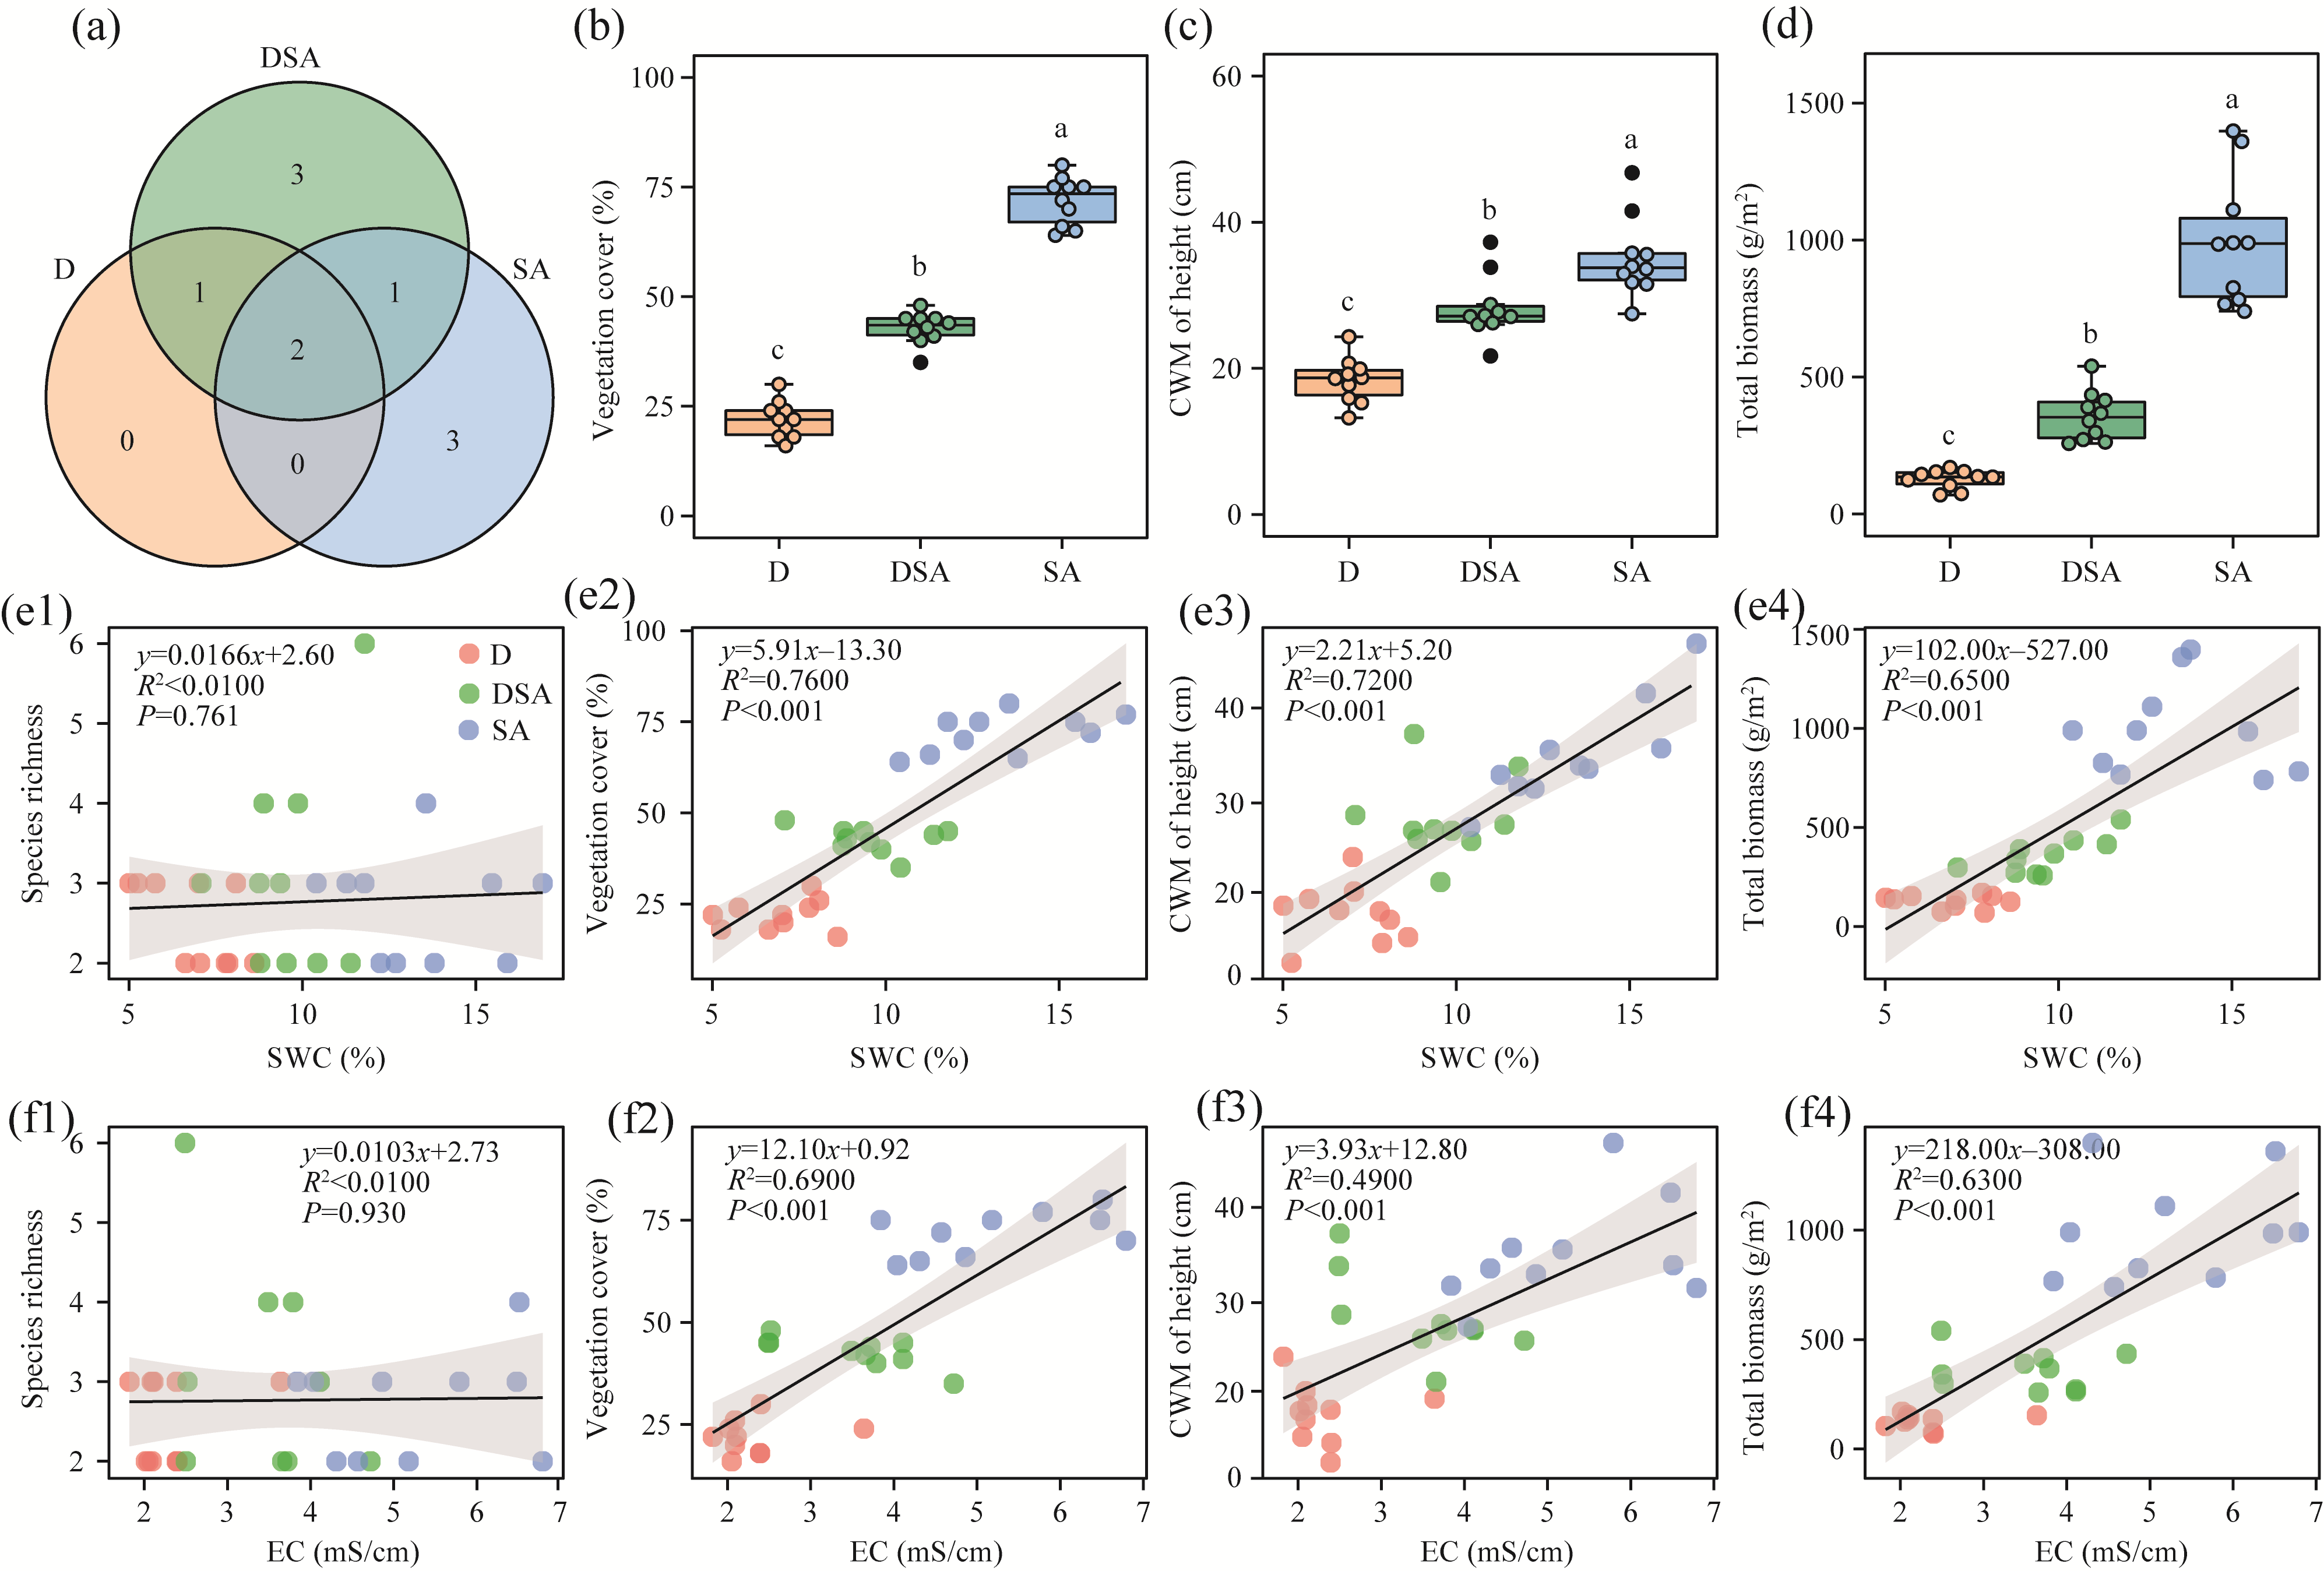
Fig. 1 Soil properties and soil microbial biomass in different groups. (a), pH; (b), SWC (soil water content); (c), EC (electrical conductivity); (d), SOC (soil organic carbon); (e), TN (total nitrogen); (f), TP (total phosphorus); (g), MBC (microbial biomass carbon); (h), MBN (microbial biomass nitrogen); (i), MBP (microbial biomass phosphorus). D, drought; SA, saline-alkaline; DSA, combined stress of D and SA. Boxes indicate the IQR (interquartile range, 75th to 25th of the data). The median value is shown as a line within the box. Outlier is shown as black point. Whiskers extend to the most extreme value within 1.5×IQR. Different lowercase letters indicate significant differences at P<0.050 level among different groups.
Fig. 4 Amplicon sequence variants (ASVs), alpha diversity, NMDS, and relationships of dissimilarity distance with SWC and EC. (a1-a3), bacterial ASVs and alpha diversity; (b1-b3), fungal ASVs and alpha diversity; (c), NMDS analysis for bacteria; (d), NMDS analysis for fungi; (e1 and e2), relationships of dissimilarity distance with SWC and EC for bacteria, respectively; (f1 and f2), relationships of dissimilarity distance with SWC and EC for fungi, respectively. Different lowercase letters in
Fig. 3 Composition of plant communities and species attributes. (a), species cover; (b), Shannon-Wiener index; (c), Simpson index; (d), non-metric multidimensional scaling (NMDS) analysis; (e1-e3), plant density; (f1-f3), importance value (IV); (g1-g3) biomass. A. mongolicum, Allium mongolicum Regel; A. capillaris, Artemisia capillaris Thunb.; A. gobicus, Asparagus gobicus Ivanova ex Grubov; C. album, Chenopodium album L.; K. gracile, Kalidium gracile Fenzl.; L. angustus, Leymus angustus (Trin.) Pilg.; N. tangutorum, Nitraria tangutorum Bobrov; P. harmala; Peganum harmala L.; R. songarica, Reaumuria songarica (Pall.) Maxim; Z. mucronatum, Zygophyllum mucronatum Maxim. Different lowercase letters indicate significant differences at P<0.050 level among different groups or plant species. Bars in
Fig. 5 Co-occurrence networks and topological properties of networks. (a1-a3), bacterial networks in different groups; (b1-b3), fungal networks in different groups; (c1-c3), ratio of links to nodes, average degree, and density in different groups; (d1-d3), within-module connectivity (Zi) and among-module connectivity (Pi) plots showing the distribution of ASVs based on their topological roles and ability to predict keystone ASVs in networks, with red dashed lines on the x-axis and y-axis representing Pi=0.62 and Zi=2.5, respectively. In Figure a1-a3 and b1-b3, nodes represent ASVs. The node color represents the top 6 phyla, and node size indicates the degree.
Fig. S1 Traits of the dominant plant species (R. songarica). (a), leaf length; (b), chlorophyll a; (c), chlorophyll b; (d), total chlorophyll; (e), Na+ content; (f), K+ content. D, drought; SA, saline-alkaline; DSA, combined stress of D and SA; DW, dry weight. Boxes indicate the IQR (interquartile range, 75th to 25th of the data). The median value is shown as a line within the box. Whiskers extend to the most extreme value within 1.5×IQR. Different lowercase letters indicate significant differences at P<0.050 level among different groups.
Fig. 6 Drivers of ecosystem multifunctionality (EMF). (a), SEM (structural equation modeling) showing the direct and indirect effects of factors; (b), contributions of biotic and abiotic factors to soil microbial ASVs and EMF based on Spearman's correlation and regression model; (c), PCA (principal component analysis) result. GFI, comparative fit index; RMSEA, root mean square error of approximation; PC, principal component; UE, urease; NP, neutral phosphatase; AKP, alkaline phosphatase; β-GC, β-glucosidase; NAG, N-acetyl-glucosaminidase; α-GC, α-glucosidase. *, P<0.050 level; ***, P<0.001 level.
Fig. S4 Structural equation modeling (SEM) showing the direct and indirect effects of drivers of soil microbial amplicon sequence variants (ASVs). (a), bacteria; (b), fungi. EC, electrical conductivity; SWC, soil water content; SOC, soil organic carbon; CWM, community-weighted means; GFI, goodness-of-fit index; RMSEA, root mean square error of approximation; **, P<0.010 level; ***, P<0.001 level.