
新疆表层土壤粒径分形特征及驱动因素分析
|
刘全渝(2001-),男,硕士研究生,主要从事荒漠化防治与生态恢复研究. E-mail: liuquanyu12345@126.com |
收稿日期: 2025-04-13
修回日期: 2025-07-03
网络出版日期: 2026-03-11
基金资助
新疆维吾尔自治区“天山英才”(2022TSYCCX0004)
新疆维吾尔自治区“天山英才”(2022TSYCJC0005)
新疆维吾尔自治区“天山创新团队”(2024D14014)
新疆维吾尔自治区杰出青年基金(2022D01E97)
新疆维吾尔自治区重点研发计划(2022B03030)
Fractal characteristics and driving factors of soil particle size in the surface layer of Xinjiang
Received date: 2025-04-13
Revised date: 2025-07-03
Online published: 2026-03-11
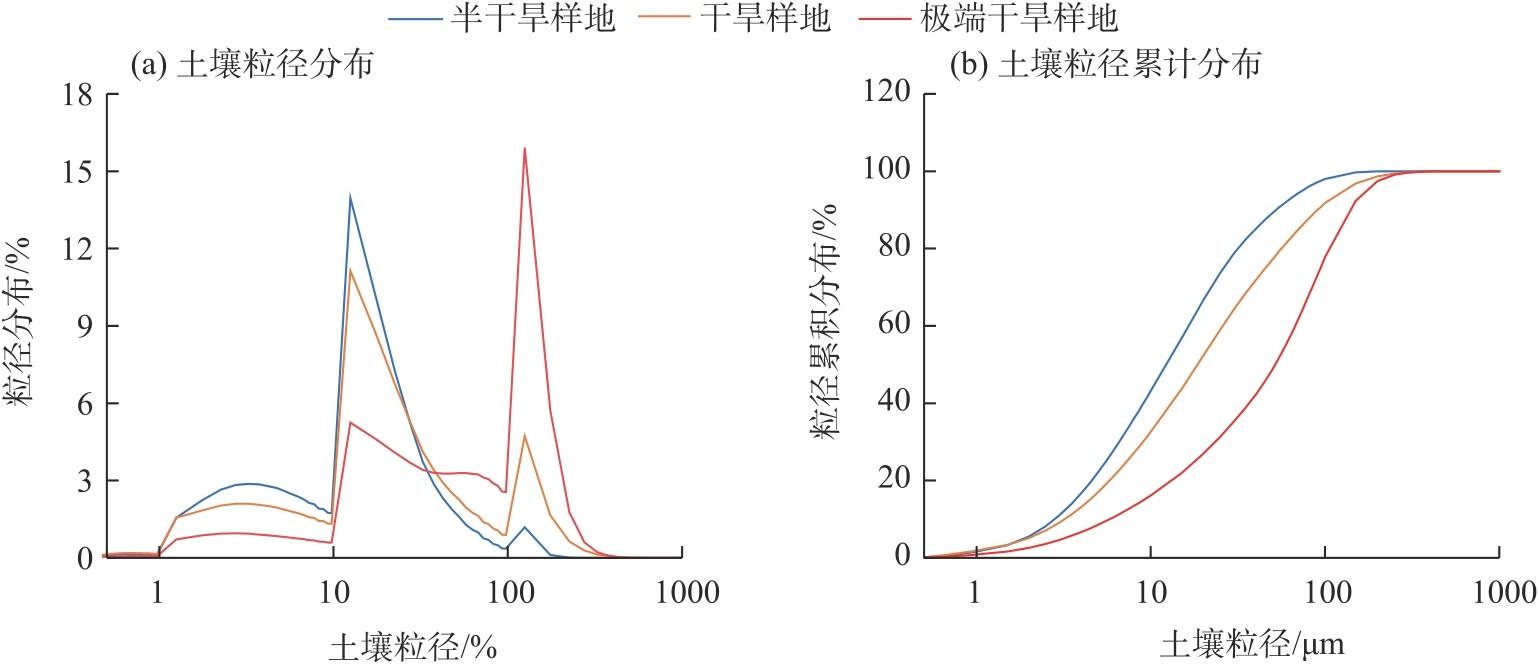
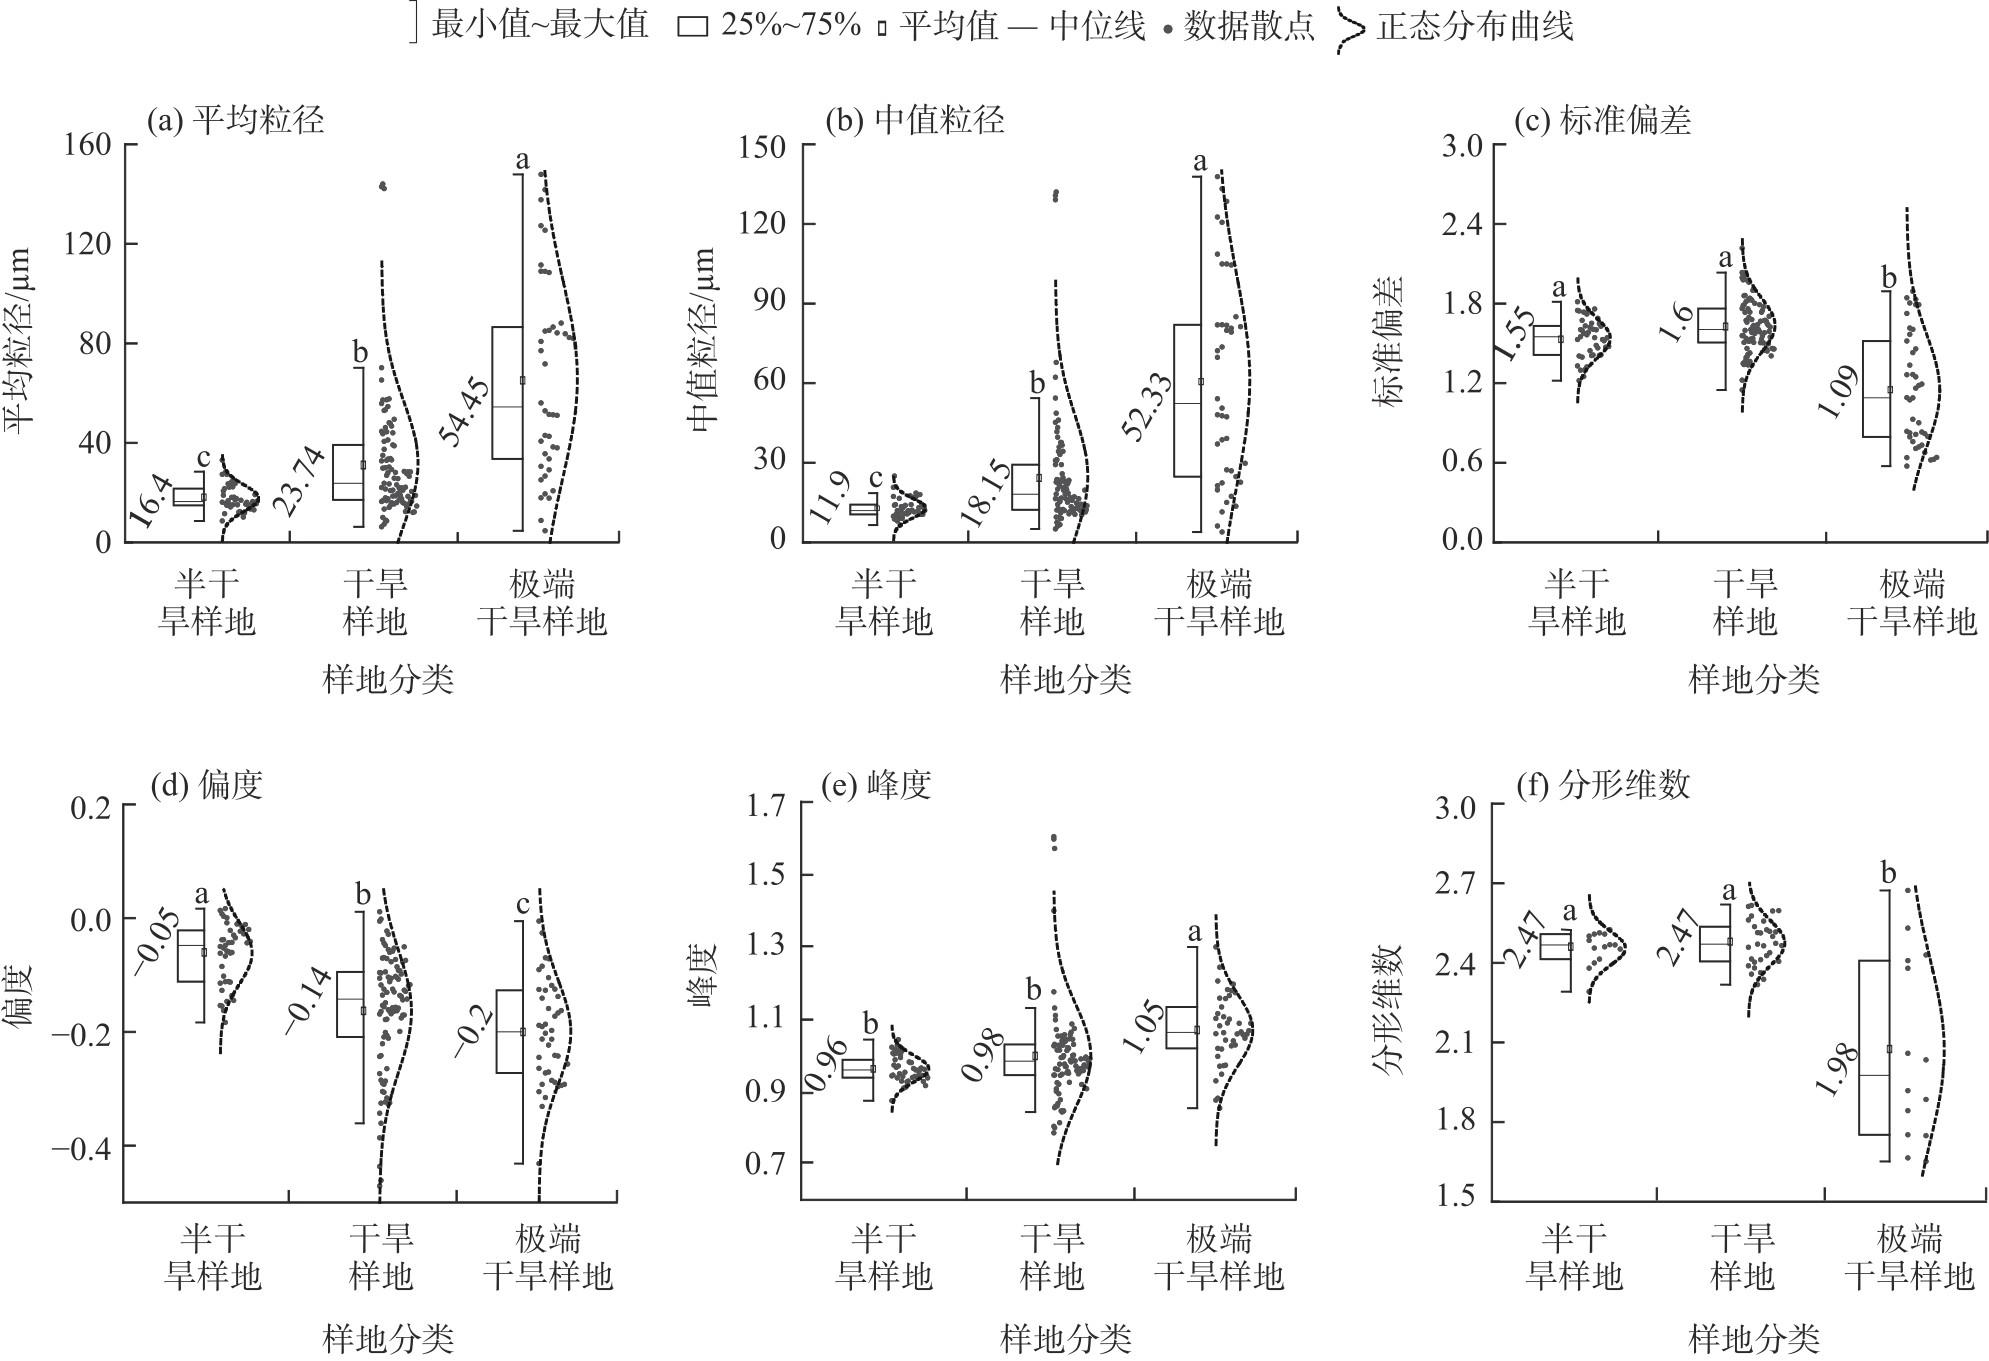
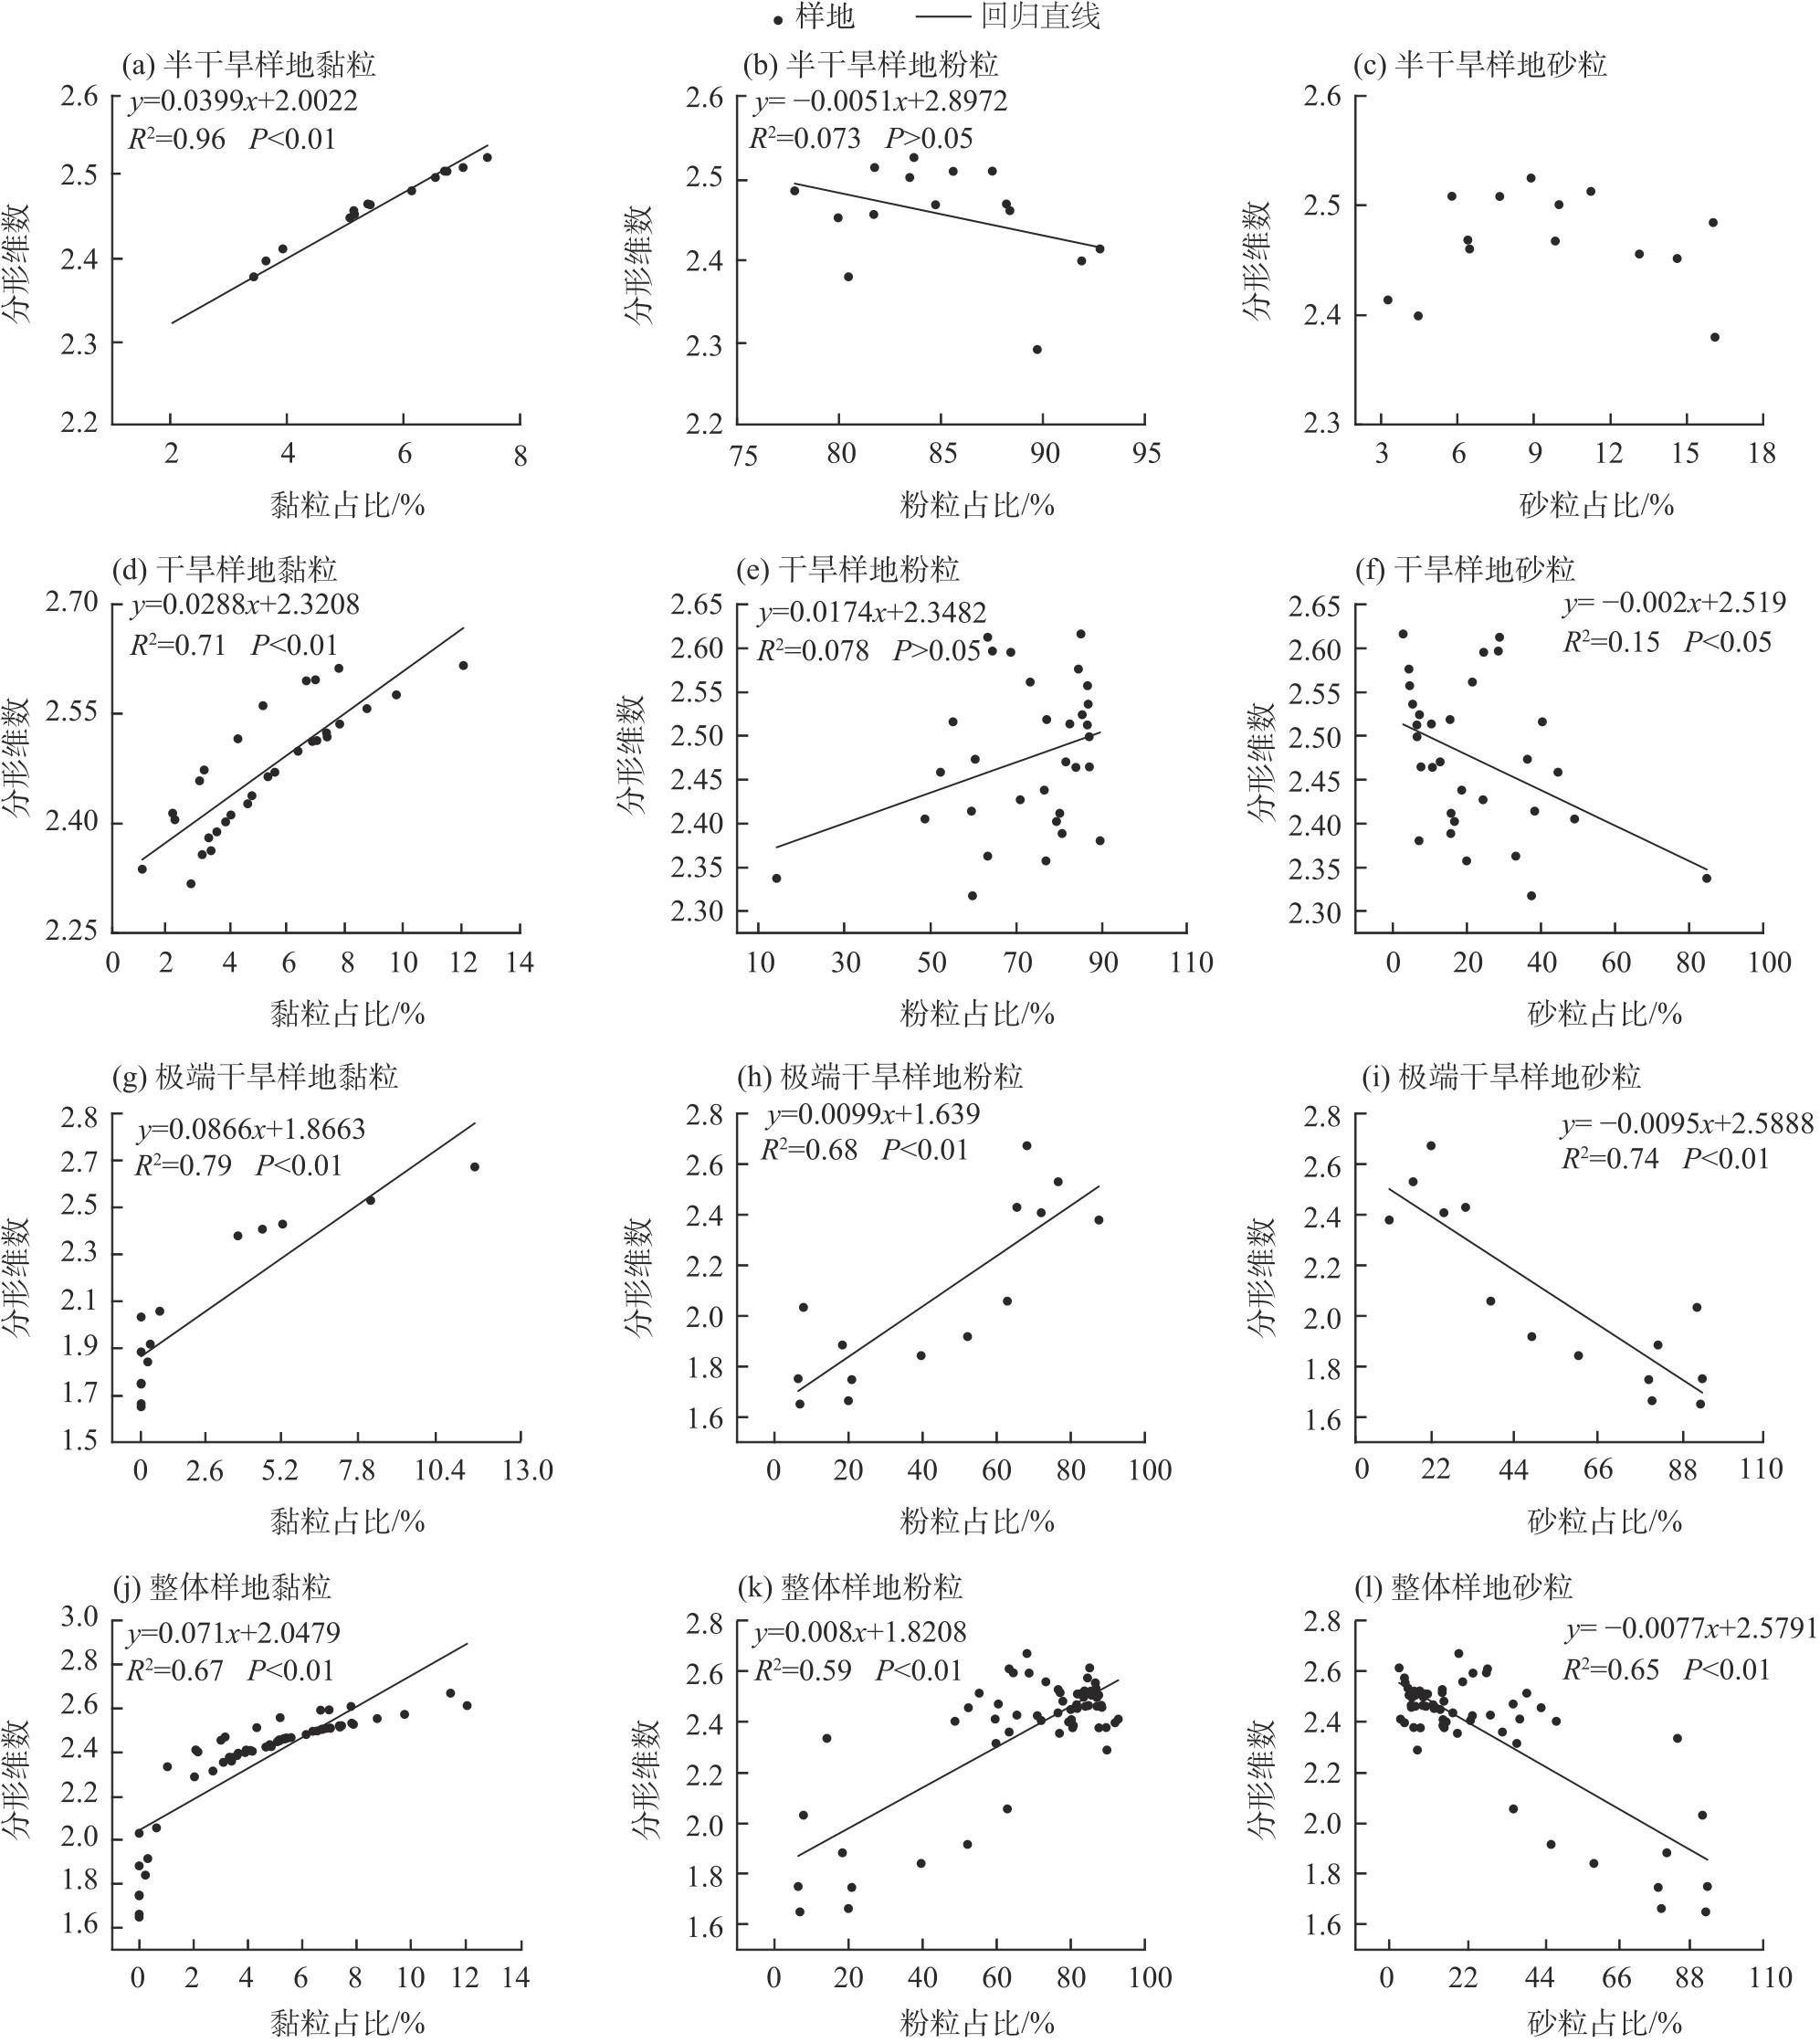
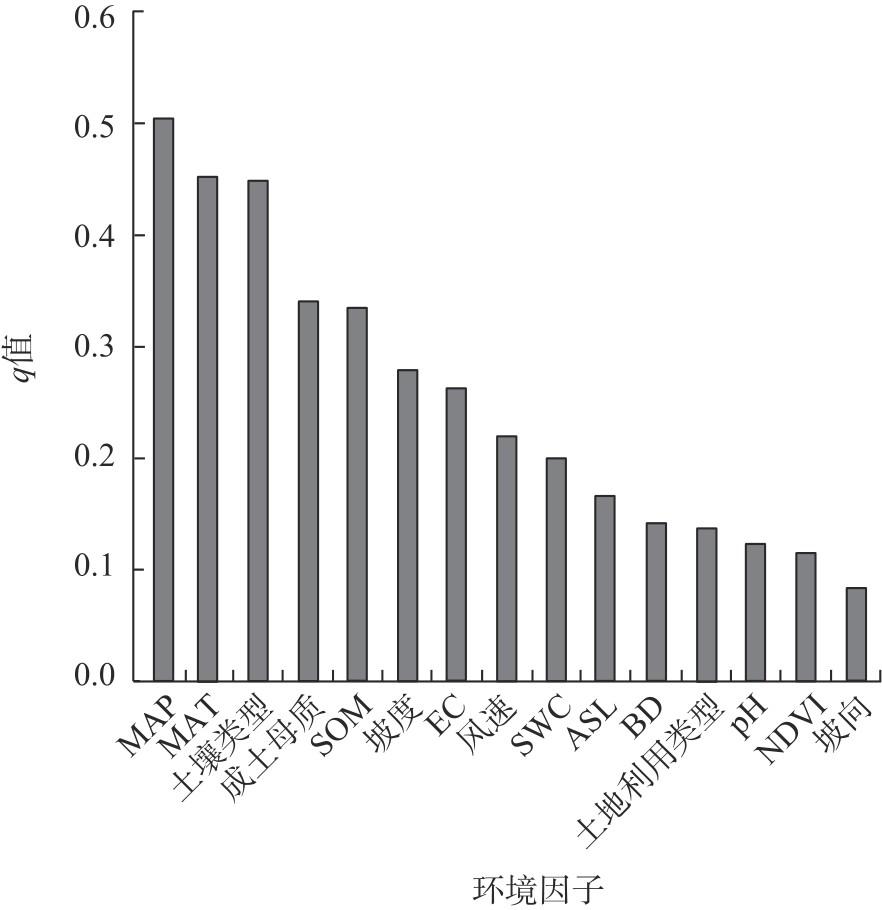
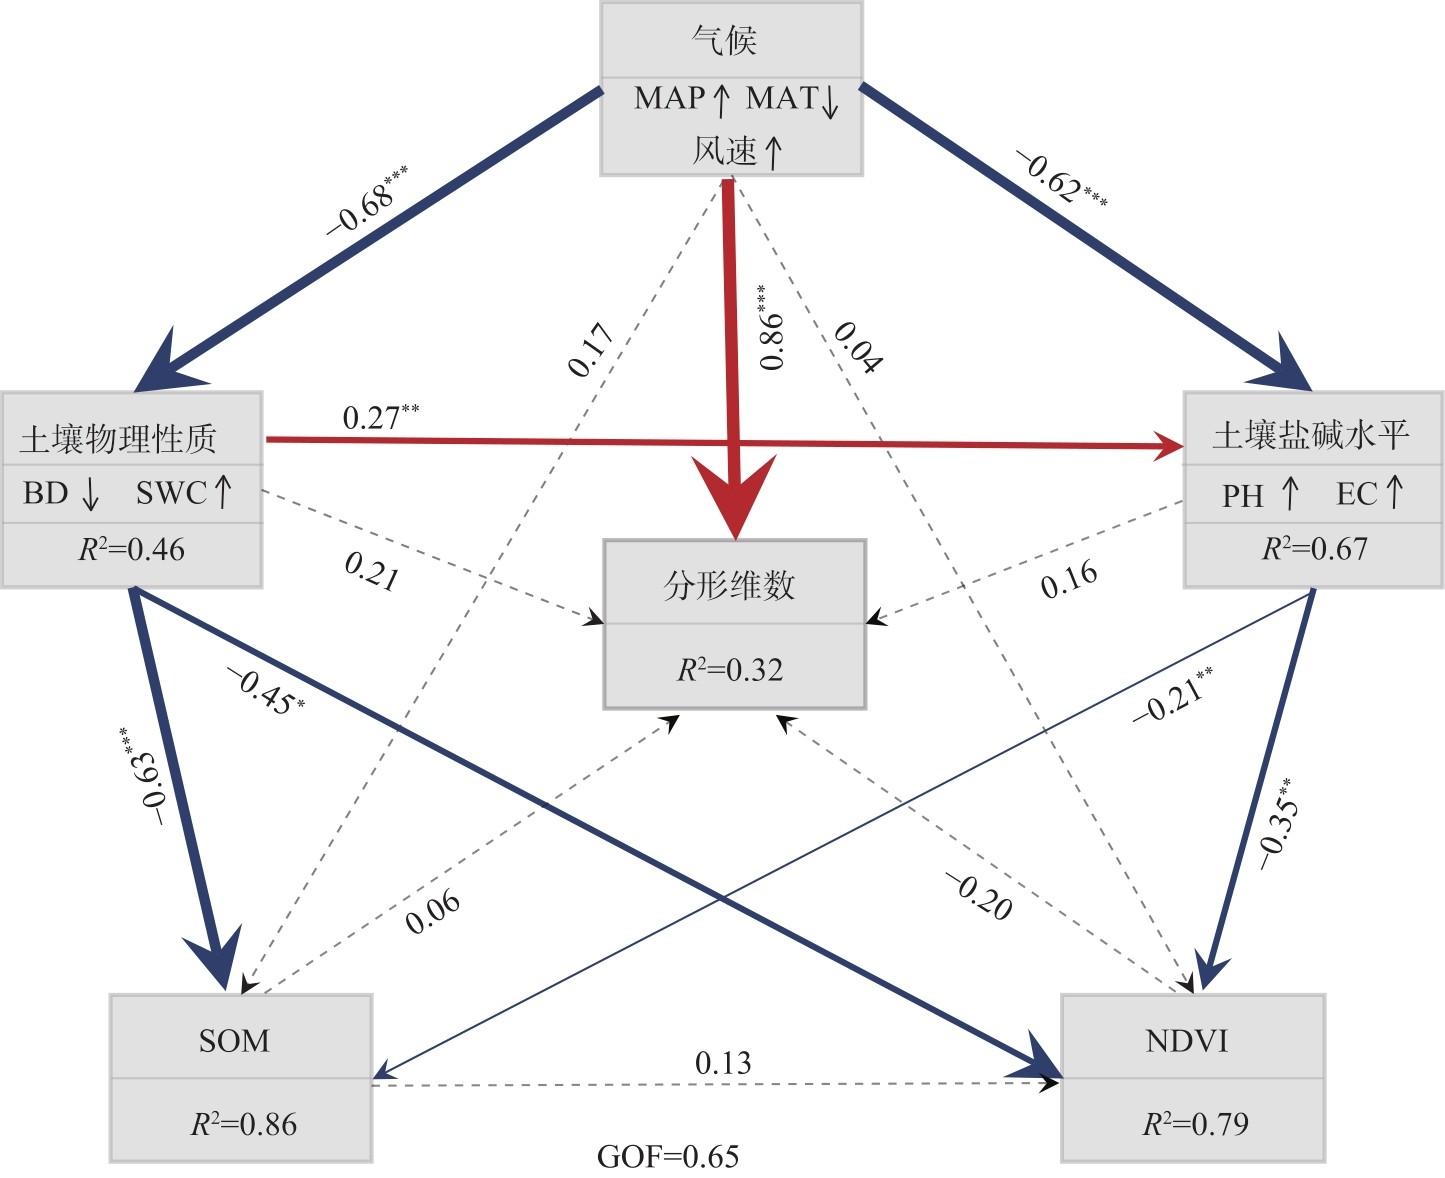
新疆是中国生态脆弱区和风蚀沙化灾害频发区,其表层土壤颗粒组成关系区域生态稳定。以新疆60个样地、180个样点表层土壤粒径为研究对象,通过干旱指数将采样点分为半干旱、干旱、极端干旱样地,探讨不同干旱梯度下土壤粒径分形特征和环境因子对新疆表土粒径分形特征的影响。结果表明:(1)随着干旱程度的增加,土壤表层颗粒分布逐渐粗化并呈现过渡性特征,半干旱、干旱样地土壤颗粒以粉粒为主,极端干旱样地土壤颗粒以砂粒为主,其中极细砂和细砂占比53.48%。(2)整体粒度特征分选较差,随着干旱程度增加,土壤颗粒的离散程度降低,分布区间更为集中,土壤分形维数集中在1.98~2.47之间。(3)分形维数受黏粒影响较大,与黏粒、粉粒呈显著正相关,与沙粒呈显著负相关,不同干旱梯度样地对分形维数拟合效果为极端干旱>干旱>半干旱。(4)因子探测器表明,年平均降水量(MAP)、年平均气温(MAT)、土壤类型、成土母质等因素对土壤分形维数解释较高。结构方程模型结果表明,本研究所选连续变量因子中,气候因子对新疆表层土壤分形维数影响显著,其中MAP与风速对分形维数为正向影响,MAT对分形维数为负向影响。研究结果可以为区域土壤利用、生态管理提供重要科学依据,进而有利于新疆的水土保持、植被恢复及生态系统稳定性。
刘全渝 , 刘馨璐 , 李桂真 , 李从娟 . 新疆表层土壤粒径分形特征及驱动因素分析[J]. 干旱区地理, 2026 , 49(1) : 56 -68 . DOI: 10.12118/j.issn.1000-6060.2025.201
Xinjiang, an ecologically fragile region in China that is prone to aeolian desertification, has a surface-soil particle composition that plays a critical role in regional ecosystem stability. This study analyzed the particle composition of surface soils collected from 180 sampling points across 60 plots in Xinjiang, China. Using the aridity index, sampling sites were classified into semi-arid, arid, and hyper-arid plots to examine the fractal characteristics of soil particle-size distributions across drought gradients and to assess how environmental factors influence these fractal properties in surface soils. The results demonstrated that (1) With increasing aridity, the surface-soil particle-size distribution became progressively coarser and showed clear transitional features. Semi-arid and arid plots were dominated by silt, whereas hyper-arid plots were dominated by sand, with very fine and fine sand together accounting for 53.48%. (2) Overall, the soils exhibited poor sorting. Particle dispersion decreased with increasing aridity, resulting in progressively narrower size distributions, and the fractal dimensions ranged from 1.98 to 2.47. (3) The fractal dimension was strongly influenced by clay content, showing positive correlations with clay and silt and a significant negative correlation with sand. Furthermore, the model-fitting performance of the fractal dimension in plots under different aridity gradients followed the order: hyper-arid>arid>semi-arid. (4) The factor detector results indicated that mean annual precipitation (MAP), mean annual temperature (MAT), soil type, and parent material had strong explanatory power for the soil fractal dimension. Structural equation modeling further showed that, among the continuous variables examined, climatic factors had a significant influence on the surface-soil fractal dimension in Xinjiang. Specifically, MAP and wind speed exerted positive effects, whereas MAT had a negative effect. This research provides a scientific basis for regional soil use and ecological management, supporting soil and water conservation, vegetation restoration, and ecosystem stability in Xinjiang.
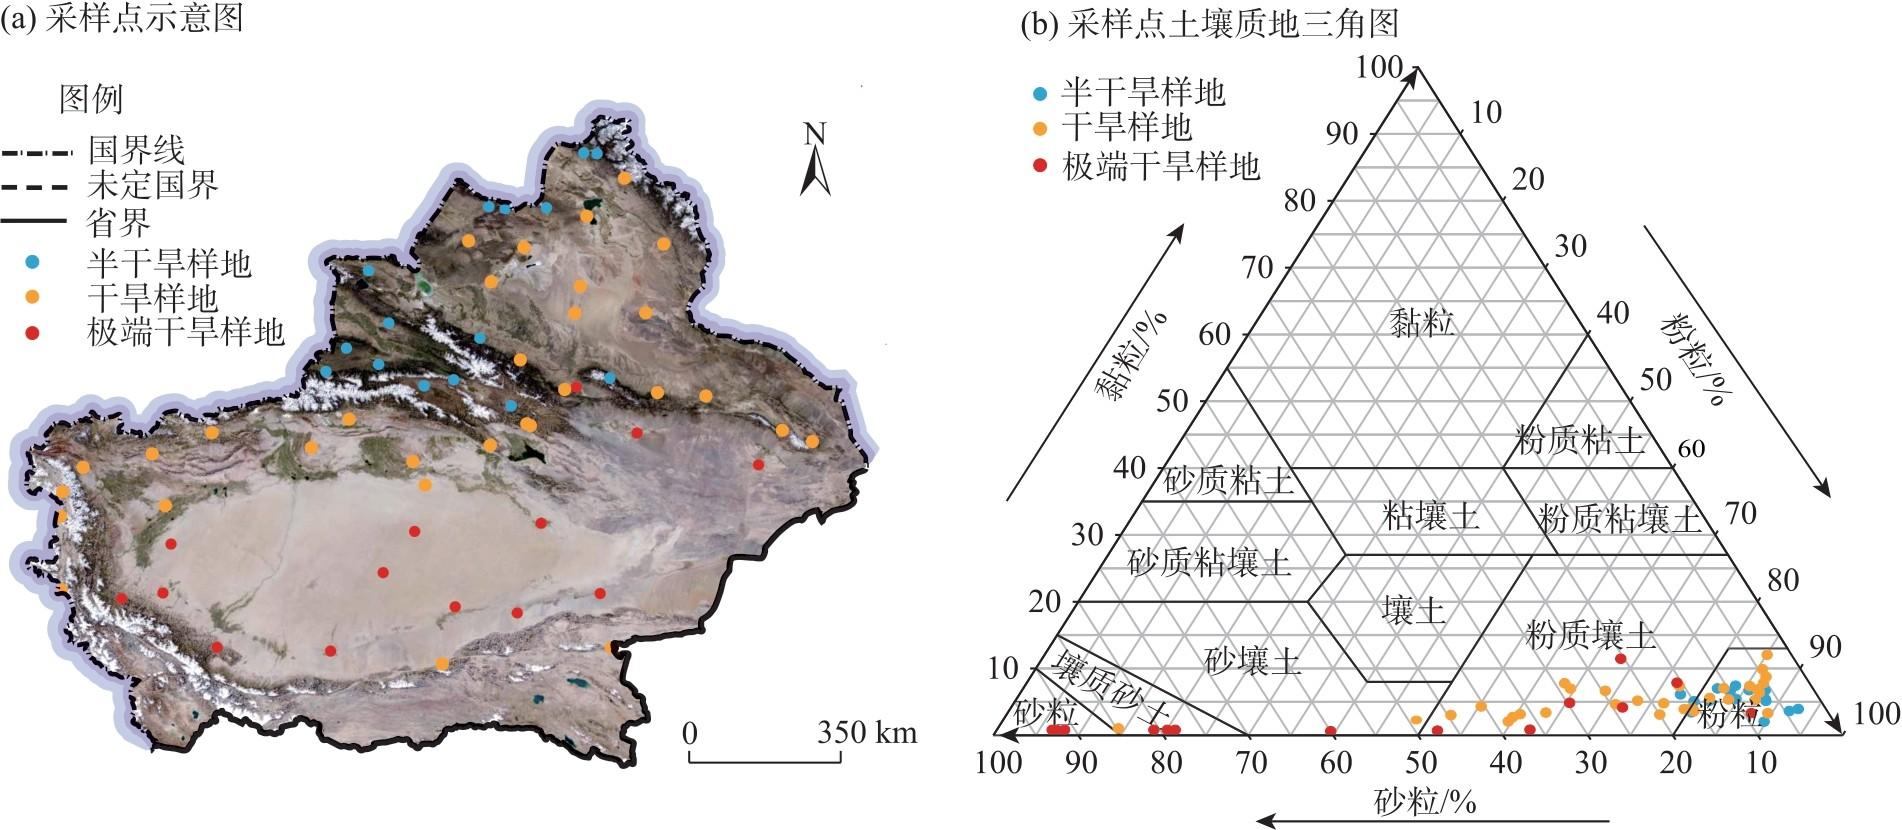
图1 研究区采样点与土壤质地三角图注:基于自然资源部标准地图服务网站审图号为GS(2023)2763号的标准地图制作,底图边界无修改。 Fig. 1 Sampling points in the study area and soil texture triangle diagram |
表1 样地气候情况Tab. 1 Climate of the sample site |
| 样地分类 | MAP/mm | MAT/℃ | AI |
|---|---|---|---|
| 半干旱样地 | 307.20±11.43 | 0.35±0.85 | 0.31±0.08 |
| 干旱样地 | 140.13±9.81 | 4.82±0.78 | 0.10±0.04 |
| 极端干旱样地 | 34.00±10.73 | 10.49±0.80 | 0.018±0.005 |
注:MAP为年平均降水量;MAT为年平均气温;AI为干旱指数。下同。 |
表2 粒度参数分级标准Tab. 2 Classification standards of particle size parameters |
| 标准偏差( ) | 偏度( ) | 峰度( ) | |||||
|---|---|---|---|---|---|---|---|
| 分选级别 | 取值范围 | 偏度等级 | 取值范围 | 峰度等级 | 取值范围 | ||
| 极好 | 极负偏 | 很宽平 | |||||
| 好 | 负偏 | 宽平 | |||||
| 较好 | 近于对称 | 中等 | |||||
| 中等 | 正偏 | 尖窄 | |||||
| 较差 | 极正偏 | 很尖窄 | |||||
| 差 | 极尖窄 | ||||||
| 极差 | |||||||
表3 不同干旱梯度样地土壤颗粒组成描述性统计Tab. 3 Descriptive statistics of soil particle composition in plots under different aridity gradients |
| 样地分类 | 黏粒/% | 粉粒/% | 砂粒/% | ||||
|---|---|---|---|---|---|---|---|
| 极细砂 | 细砂 | 中砂 | 粗砂 | 总量 | |||
| 半干旱样地 | 5.33±0.39a | 85.17±1.158a | 8.19±0.81c | 1.32±0.29b | 0.57±0.47a | 0.22±0.02a | 9.50±1.05c |
| 干旱样地 | 5.34±0.44a | 72.63±2.87b | 14.34±1.38b | 7.09±1.78b | 0.97±0.74a | 0.02±0.01a | 21.99±3.16b |
| 极端干旱样地 | 2.35±0.96b | 43.20±7.79c | 30.07±3.95a | 23.41±5.87a | 0.52±0.29a | 0.02±0.01a | 54.45±8.48a |
注:不同小写字母表示同列不同干旱梯度样地间差异显著(P<0.05)。下同。 |
表4 不同成土母质下土壤颗粒组成差异Tab. 4 Differences in soil particle composition under different soil-forming parent materials |
| 母质类型 | 样本数 | 黏粒占比/% | 粉粒占比/% | 砂粒占比/% | 分形维数 |
|---|---|---|---|---|---|
| 坡、残积母质 | 102 | 5.32±0.42a | 75.31±3.17a | 19.37±3.40b | 2.45±0.03a |
| 洪、冲积母质 | 48 | 4.69±3.25a | 72.98±3.80a | 22.24±4.38b | 2.37±0.06a |
| 风积母质 | 21 | 1.07±1.65b | 24.63±7.41b | 74.29±7.97a | 2.01±0.15b |
| 黄土状母质 | 9 | 5.03±1.00a | 77.70±2.94a | 17.27±3.65b | 2.44±0.04a |
注:不同小写字母表示同列不同母质类型间差异显著(P<0.05)。 |
表5 不同土壤类型下土壤颗粒组成差异Tab. 5 Differences in soil particle composition under different soil types |
| 土壤类型 | 样本数 | 黏粒占比/% | 粉粒占比/% | 砂粒占比/% | 分形维数 |
|---|---|---|---|---|---|
| 风沙土 | 24 | 0.91±0.53b | 25.65±9.18c | 73.44±9.69a | 2.00±0.34b |
| 黑钙土 | 24 | 5.71±0.47a | 85.24±1.89a | 9.05±1.65bc | 2.47±0.05a |
| 黑毡土 | 9 | 6.20±0.53a | 87.16±0.82a | 6.64±0.55c | 2.49±0.03a |
| 冷钙土 | 9 | 4.55±0.9ab | 79.93±5.00ab | 15.52±9.01bc | 2.43±0.02a |
| 粟钙土 | 33 | 4.91±0.59ab | 78.72±2.97ab | 16.36±3.37bc | 2.45±0.02a |
| 盐土 | 15 | 3.88±1.15ab | 75.89±5.99ab | 20.23±6.87bc | 2.35±0.08a |
| 棕钙土 | 18 | 5.65±1.18a | 72.55±5.32b | 21.58±6.49bc | 2.47±0.03a |
| 棕漠土 | 24 | 6.32±1.16a | 64.27±4.31b | 29.41±5.27b | 2.46±0.09a |
注:不同小写字母表示同列不同土壤类型间差异显著(P<0.05)。沼泽土等样本数较少的土类未放入此表中。 |
表6 不同土地利用方式下土壤颗粒组成差异Tab. 6 Differences in soil particle composition under different land use methods |
| 土地利用方式 | 样本数 | 黏粒占比/% | 粉粒占比/% | 砂粒占比/% | 分形维数 |
|---|---|---|---|---|---|
| 草地 | 123 | 4.85±0.42a | 71.29±20.28a | 23.85±3.45b | 2.42±0.03a |
| 林地 | 30 | 5.00±0.50a | 82.31±5.53a | 12.69±1.98b | 2.44±0.06a |
| 未利用土地 | 27 | 3.30±1.43a | 43.17±31.59b | 53.53±11.73a | 2.09±0.41b |
注:不同小写字母表示同列不同土壤利用方式间差异显著(P<0.05)。未利用土地包括沙地、戈壁、盐碱地、裸土地等地块。 |
表7 不同干旱梯度样地环境特征Tab. 7 Environmental characteristics in plots under different aridity gradients |
| 样地分类 | ASL/m | 坡度 | 坡向 | BD/g·cm-3 | SWC/% |
|---|---|---|---|---|---|
| 半干旱样地 | 1994.33±161.92a | 7.46±1.21a | 175.66±27.70a | 82.91±6.74b | 23.76±3.46a |
| 干旱样地 | 1758.58±194.67ab | 4.22±0.87b | 175.75±22.50a | 119.01±6.51a | 8.75±1.88b |
| 极端干旱样地 | 1195.86±184.51b | 2.03±0.97b | 229.82±31.80a | 134.00±4.76a | 4.05±1.70c |
| 样地分类 | SOM/g·kg-1 | pH | EC/μS·cm-1 | NDVI | 风速/m·s-1 |
| 半干旱样地 | 99.85±11.98a | 6.68±0.26b | 146.47±16.42b | 0.51±0.04a | 10.46±0.88a |
| 干旱样地 | 29.41±7.35b | 8.23±0.11a | 3813.46±1692.26a | 0.21±0.03b | 10.69±0.59a |
| 极端干旱样地 | 7.96±4.24c | 8.52±0.31a | 3625.83±1122.65a | 0.14±0.03b | 9.14±0.44a |
注:ASL为海拔;BD为容重;SWC为土壤含水量;SOM为土壤有机质;EC为土壤电导率;NDVI为归一化植被指数。下同。 |
图5 因子探测结果注:MAP为年平均降水量;MAT为年平均气温;SOM为土壤有机质;EC为土壤电导率;SWC为土壤含水量;ASL为海拔;BD为容重;NDVI为归一化植被指数;q值为环境因子对分形维数的解释程度。下同。 Fig. 5 Factor detection results |
图6 不同环境因子对土壤粒径分形维数特征驱动作用结构方程模型(SEM)注:红色和蓝色实箭头分别表示正向和负向影响;虚线表示不显著的路径;箭头旁的数字表示标准路径系数;箭头宽度与关联强度成正比。多层矩阵中,PC2向上箭头表示相邻变量与相应PC1之间的正向关系;向下箭头表示相邻变量与相应PC1之间的负向关系。*、**、***分别表示不同环境因子间显著(P<0.05)、极显著(P<0.01)、极其显著(P<0.001)。R2为决定系数,衡量模型对变量变异的解释能力;GOF为模型整体拟合优度的指标,GOF>0.4视为接受模型。 Fig. 6 SEM of the driving effect of different environmental factors on the fractal dimension characteristics of soil particle size |
表8 不同环境因子与分形维数Pearson相关性分析Tab. 8 Pearson correlation analysis between different environmental factors and fractal dimension |
| 驱动因子 | MAP | MAT | ASL | 坡度 | 坡向 | BD | SWC | SOM | pH | EC | NDVI | 风速 | 分形维数 |
|---|---|---|---|---|---|---|---|---|---|---|---|---|---|
| MAP | 1.00 | - | - | - | - | - | - | - | - | - | - | - | - |
| MAT | -0.68** | 1.00 | - | - | - | - | - | - | - | - | - | - | - |
| ASL | 0.20 | -0.73** | 1.00 | - | - | - | - | - | - | - | - | - | - |
| 坡度 | 0.45** | -0.60** | 0.58** | 1.00 | - | - | - | - | - | - | - | - | - |
| 坡向 | -0.19 | 0.66** | -0.019 | 0.033 | 1.00 | - | - | - | - | - | - | - | - |
| BD | -0.61** | 0.56** | -0.42** | -0.58** | 0.089 | 1.00 | - | - | - | - | - | - | - |
| SWC | 0.66** | -0.61** | 0.44** | -0.54** | -0.14 | -0.84** | 1.00 | - | - | - | - | - | - |
| SOM | 0.75** | -0.67** | 0.38** | -0.64** | -0.15 | -0.84** | 0.88** | 1.00 | - | - | - | - | - |
| pH | -0.79** | 0.59** | -0.21** | -0.47** | 0.012 | 0.71** | -0.70** | -0.79** | 1.00 | - | - | - | - |
| EC | -0.33* | -0.43** | -0.23 | -0.30* | 0.11 | 0.05 | -0.12 | -0.24 | 0.21 | 1.00 | - | - | - |
| NDVI | 0.75** | -0.61** | 0.31* | -0.57** | -0.029 | -0.81** | 0.79** | 0.84** | -0.81** | -0.22 | 1.00 | - | - |
| 风速 | 0.17 | -0.20 | -0.09 | -0.09 | 0.03 | 0.05 | 0.001 | 0.071 | -0.16 | -0.18 | -0.10 | 1.00 | - |
| 分形维数 | 0.42** | -0.45** | 0.12 | 0.16 | -0.10 | -0.12 | 0.16 | 0.24 | -0.26* | -0.10 | 0.16 | 0.29* | 1.00 |
注:*、**分别表示同列不同环境因子间显著(P<0.05)、极显著(P<0.01)相关。 |
| [1] |
徐加盼, 李继洪, 魏玉杰, 等. 不同母质类型发育土壤颗粒组成分形特征[J]. 土壤学报, 2020, 57(5): 1197-1205.
[
|
| [2] |
张世文, 张立平, 袁君, 等. 基于分形理论和地质统计学的表层土壤颗粒大小分布变化特征[J]. 中国农业科学, 2014, 47(13): 2591-2601.
[
|
| [3] |
|
| [4] |
|
| [5] |
贾重建, 卢瑛, 吴刚, 等. 广东罗浮山土壤颗粒分形维数分布特征[J]. 土壤通报, 2022, 53(5): 1049-1055.
[
|
| [6] |
杜丹丹, 高瑞忠, 贾德彬. 吉兰泰盐湖盆地土壤颗粒分形特征与空间变异分析[J]. 水土保持研究, 2023, 30(6): 93-101.
[
|
| [7] |
吕圣桥, 高鹏, 耿广坡, 等. 黄河三角洲滩地土壤颗粒分形特征及其与土壤有机质的关系[J]. 水土保持学报, 2011, 25(6): 134-138.
[
|
| [8] |
黄业芸, 邱开阳, 朱亚超, 等. 贺兰山不同海拔植被生物量与土壤分形特征和土壤水分的相关关系[J]. 草业学报, 2023, 32(12): 24-35.
[
|
| [9] |
赵守强, 迟大群, 贾付诚, 等. 不同地区盐渍土土壤颗粒的分形特征[J]. 江苏农业科学, 2021, 49(6): 203-207.
[
|
| [10] |
周雷, 曲潇琳, 周涛, 等. 宁夏土壤颗粒组成特点及其影响因素分析[J]. 中国农业科学, 2023, 56(21): 4272-4287.
[
|
| [11] |
刘全渝, 李从娟, 李桂真. 添加膨润土对风蚀沙化土壤理化性质及植被生长的影响[J]. 干旱区研究, 2025, 42(3): 456-466.
[
|
| [12] |
贺郝钰, 刘蔚, 常宗强, 等. 沙区生物土壤结皮演替对表层土壤养分和微生物群落组成的影响[J]. 干旱区地理, 2024, 47(10): 1724-1734.
[
|
| [13] |
王会静, 郭玉川, 白运保, 等. 新疆植被动态格局及其对气候的时滞效应[J]. 农业工程学报, 2023, 39(11): 137-145.
[
|
| [14] |
宋小龙, 李陇堂, 任婕, 等. 西北干旱生态地理区NDVI时空变化特征及其驱动力[J]. 干旱区地理, 2025, 48(6): 951-962.
[
|
| [15] |
刁二龙, 曹广超, 曹生奎, 等. 不同尺度下土壤粒径及分形特征[J]. 水土保持研究, 2024, 31(5): 212-220.
[
|
| [16] |
|
| [17] |
|
| [18] |
张永成, 王洪辉, 谭桂花. 基于Excel VBA的图解粒度参数计算[J]. 成都理工大学学报(自然科学版), 2010, 37(6): 650-653.
[
|
| [19] |
|
| [20] |
罗玉红, 黄予姝, 珠娜, 等. 锡林郭勒盟典型草原区草地开垦及退耕造林对土壤粒径分布和养分的影响[J]. 中国农业科学, 2024, 57(24): 4919-4932.
[
|
| [21] |
王国梁, 周生路, 赵其国. 土壤颗粒的体积分形维数及其在土地利用中的应用[J]. 土壤学报, 2005, 42(4): 545-550.
[
|
| [22] |
宛倩, 王杰, 王向涛, 等. 青藏高原不同草地利用方式对土壤粒径分形特征的影响[J]. 生态学报, 2022, 42(5): 1716-1726.
[
|
| [23] |
|
| [24] |
陈京平, 余子莹, 杨帆, 等. 塔克拉玛干沙漠腹地沙尘暴和地表沙物质粒度特征[J]. 中国沙漠, 2023, 43(2): 150-158.
[
|
| [25] |
|
| [26] |
刘云鹏, 王国栋, 张社奇, 等. 陕西4种土壤粒径分布的分形特征研究[J]. 西北农林科技大学学报(自然科学版), 2003, 31(2): 92-94.
[
|
| [27] |
杨培岭, 罗远培, 石元春. 用粒径的重量分布表征的土壤分形特征[J]. 科学通报, 1993, 38(20): 1896-1899.
[
|
| [28] |
杨娟, 高永, 王瑞东, 等. 沙质草原风蚀坑土壤粒度组成及养分特征[J]. 中国农业科技导报, 2024, 26(10): 186-194.
[
|
| [29] |
刘茜雅, 王海兵, 左合君, 等. 苏宏图戈壁沉积物分形空间变异性及其成因[J]. 干旱区地理, 2021, 44(1): 168-177.
[
|
| [30] |
段晓明, 夏栋, 马悦阳, 等. 不同生态修复方式对土壤团聚体稳定性及胶结物质的影响[J]. 生态学报, 2025, 45(11): 5178-5190.
[
|
| [31] |
杜雅仙, 樊瑾, 李诗瑶, 等. 荒漠草原不同植被微斑块土壤粒径分布分形特征与养分的关系[J]. 应用生态学报, 2019, 30(11): 3716-3724.
[
|
| [32] |
|
| [33] |
郭玉琳, 赵勇, 周雅蔓, 等. 新疆天山山区夏季降水日变化特征及其与海拔高度关系[J]. 干旱区地理, 2022, 45(1): 57-65.
[
|
| [34] |
|
/
| 〈 |
|
〉 |