
地级市尺度下中国物流企业空间格局演化特征及影响因素
|
戢晓峰(1982-),男,博士,教授,主要从事交通地理与区域发展研究. E-mail: yiluxinshi@sina.com |
收稿日期: 2025-02-27
修回日期: 2025-05-06
网络出版日期: 2026-03-11
基金资助
云南省哲学社会科学基金项目(QN202413)
云南交投集团科技创新项目(YCIC-YF-2024-04)
昆明理工大学哲学社会科学科研创新团队项目(CXTD2024007)
Spatial pattern evolution characteristics and influencing factors of logistics enterprises in China at prefecture-level city scale
Received date: 2025-02-27
Revised date: 2025-05-06
Online published: 2026-03-11
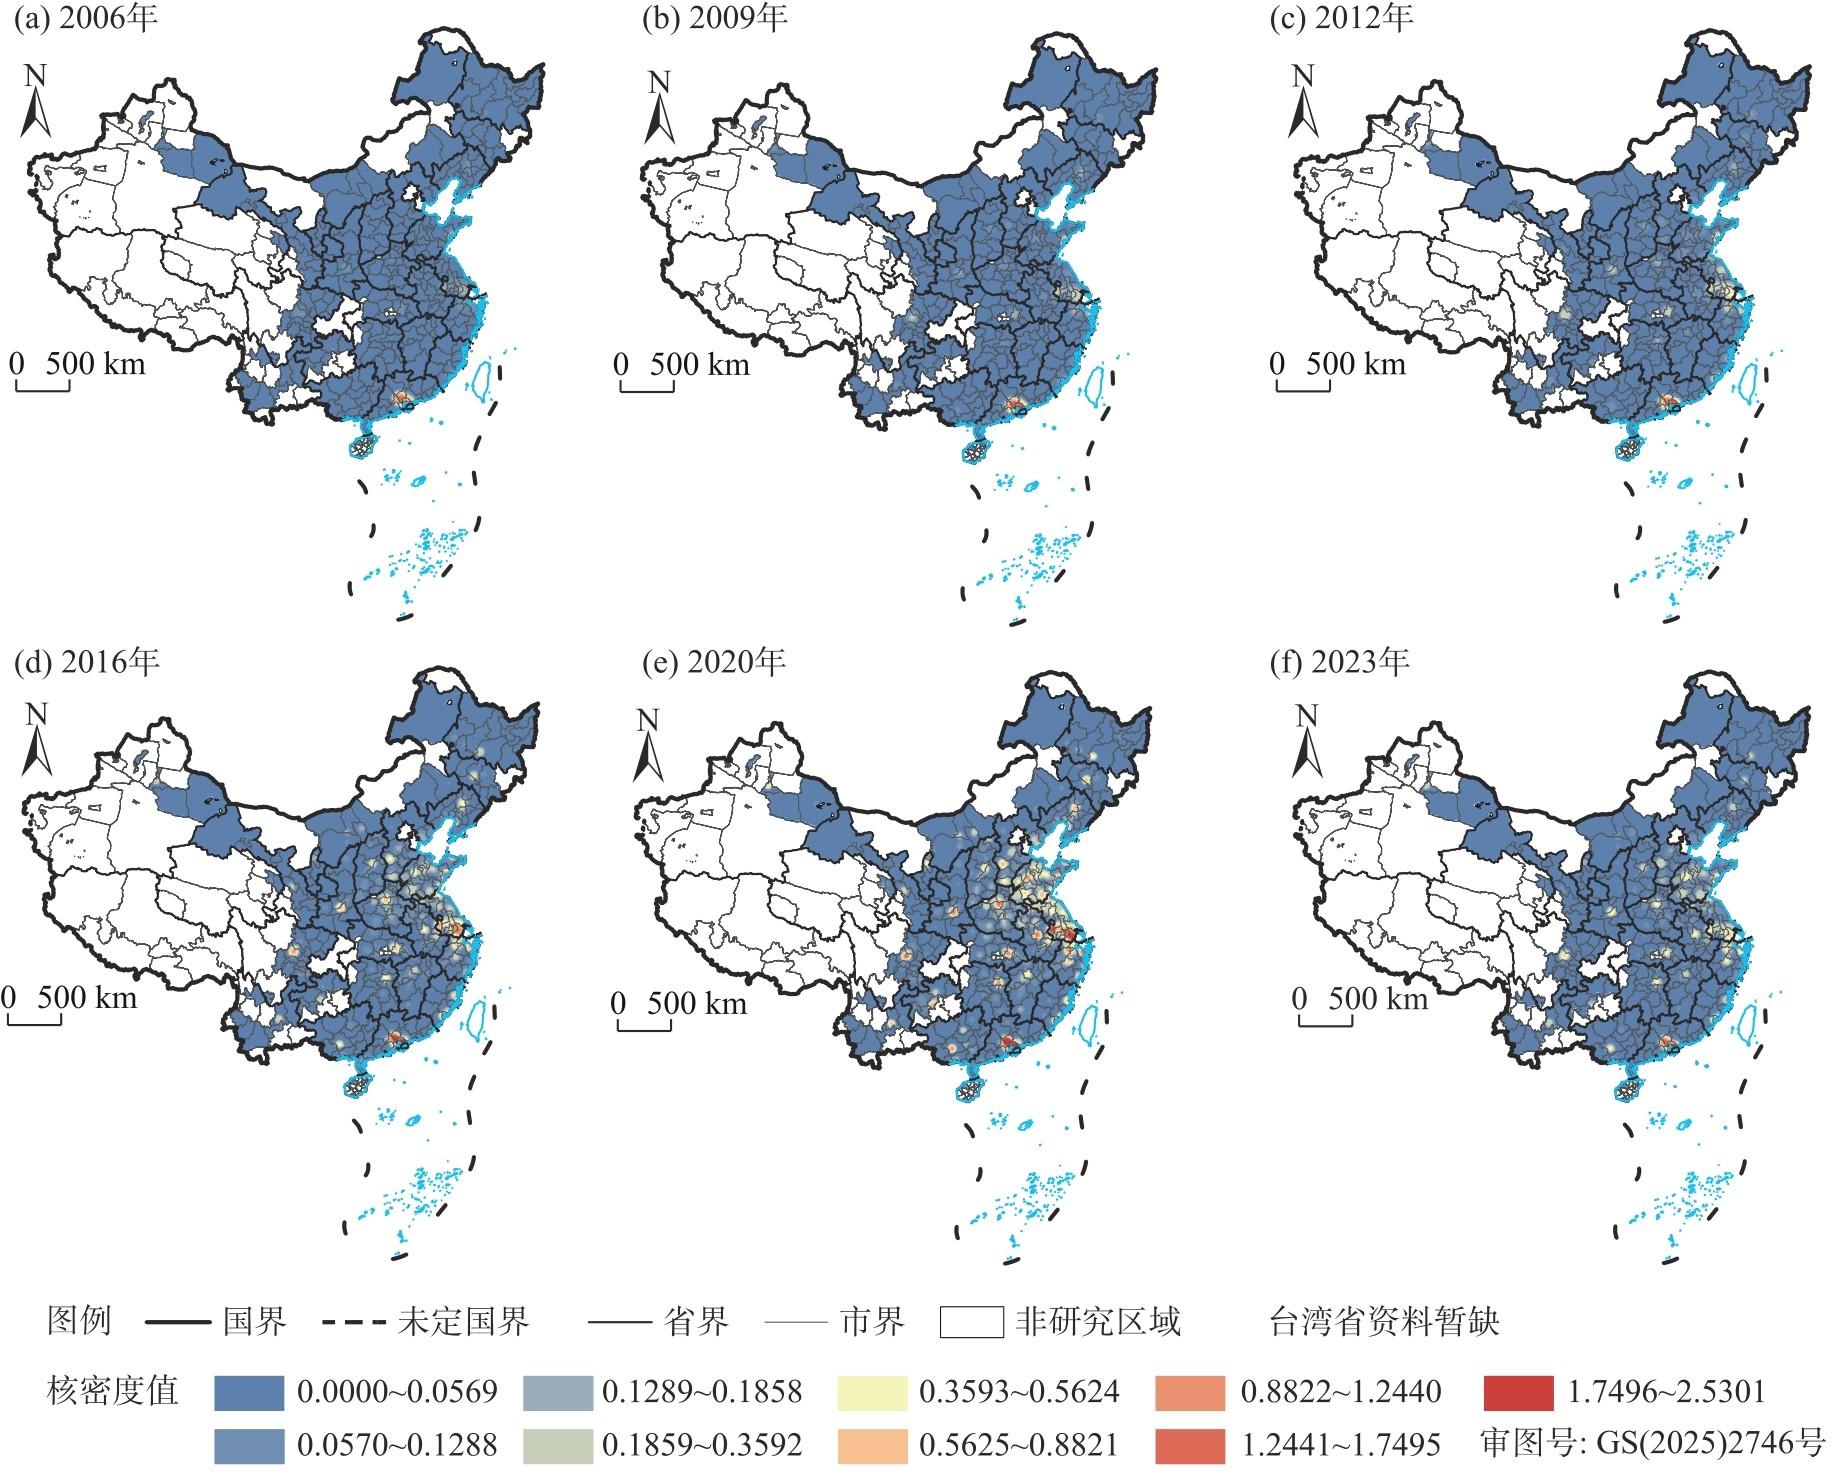
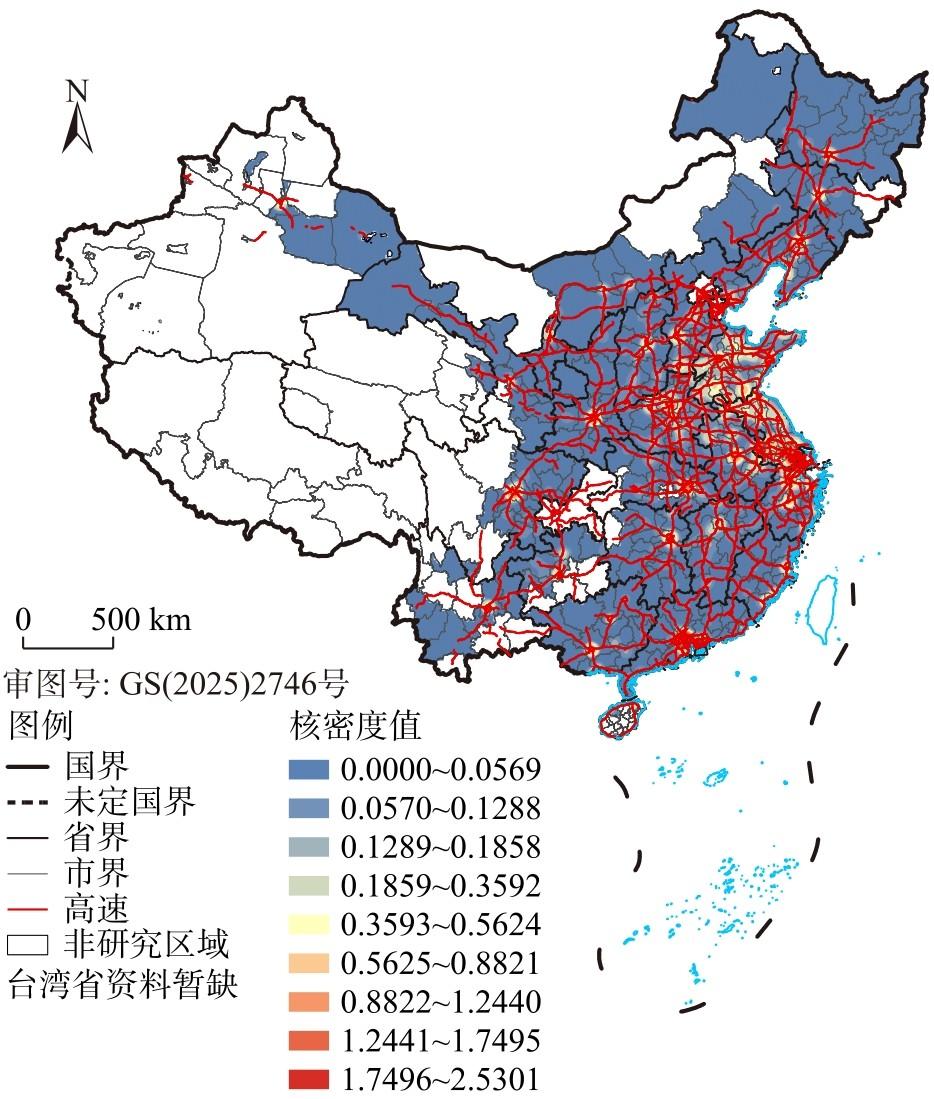
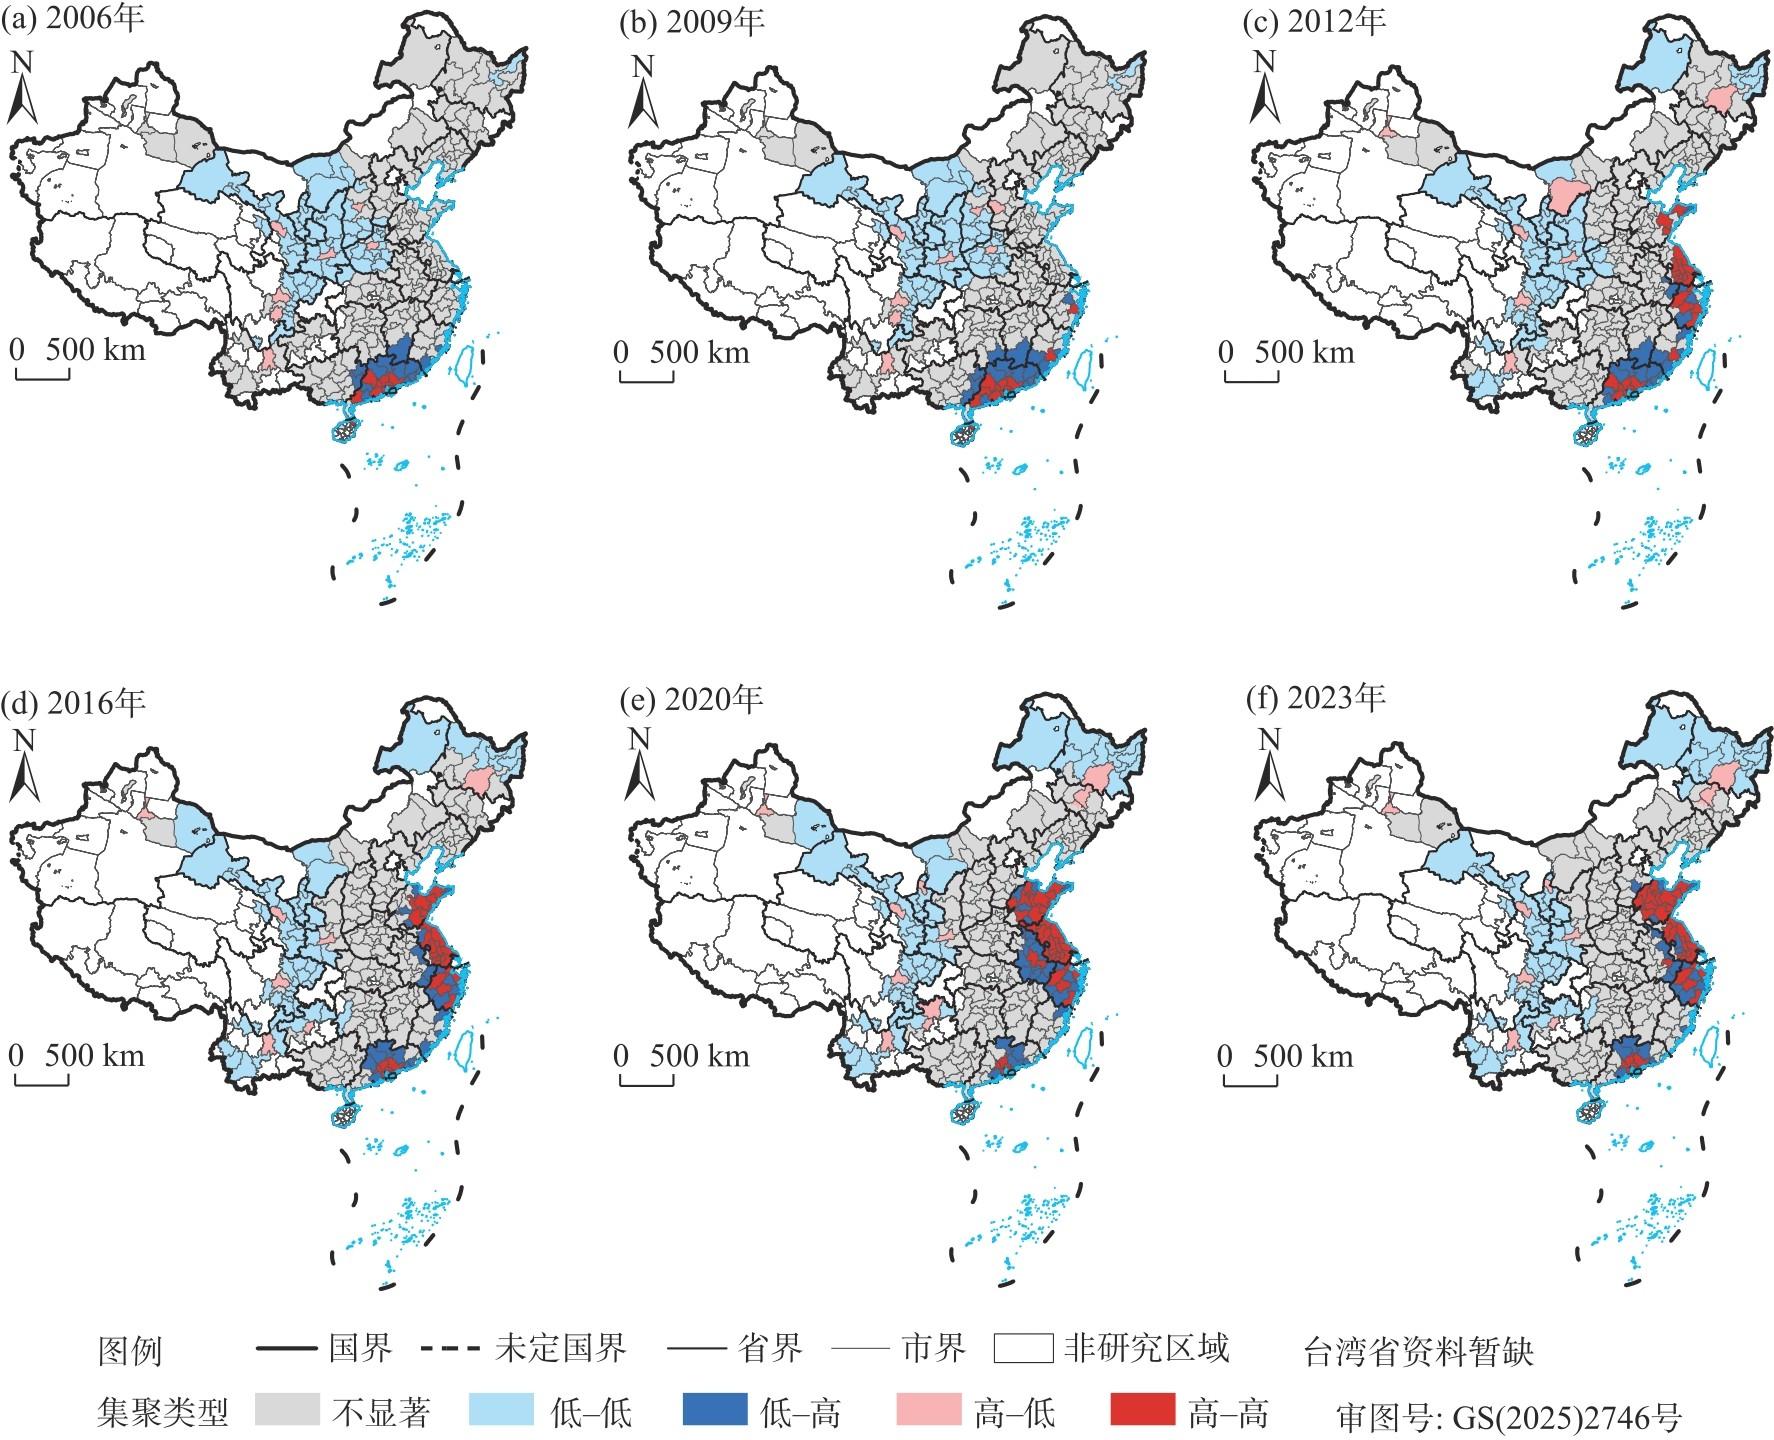
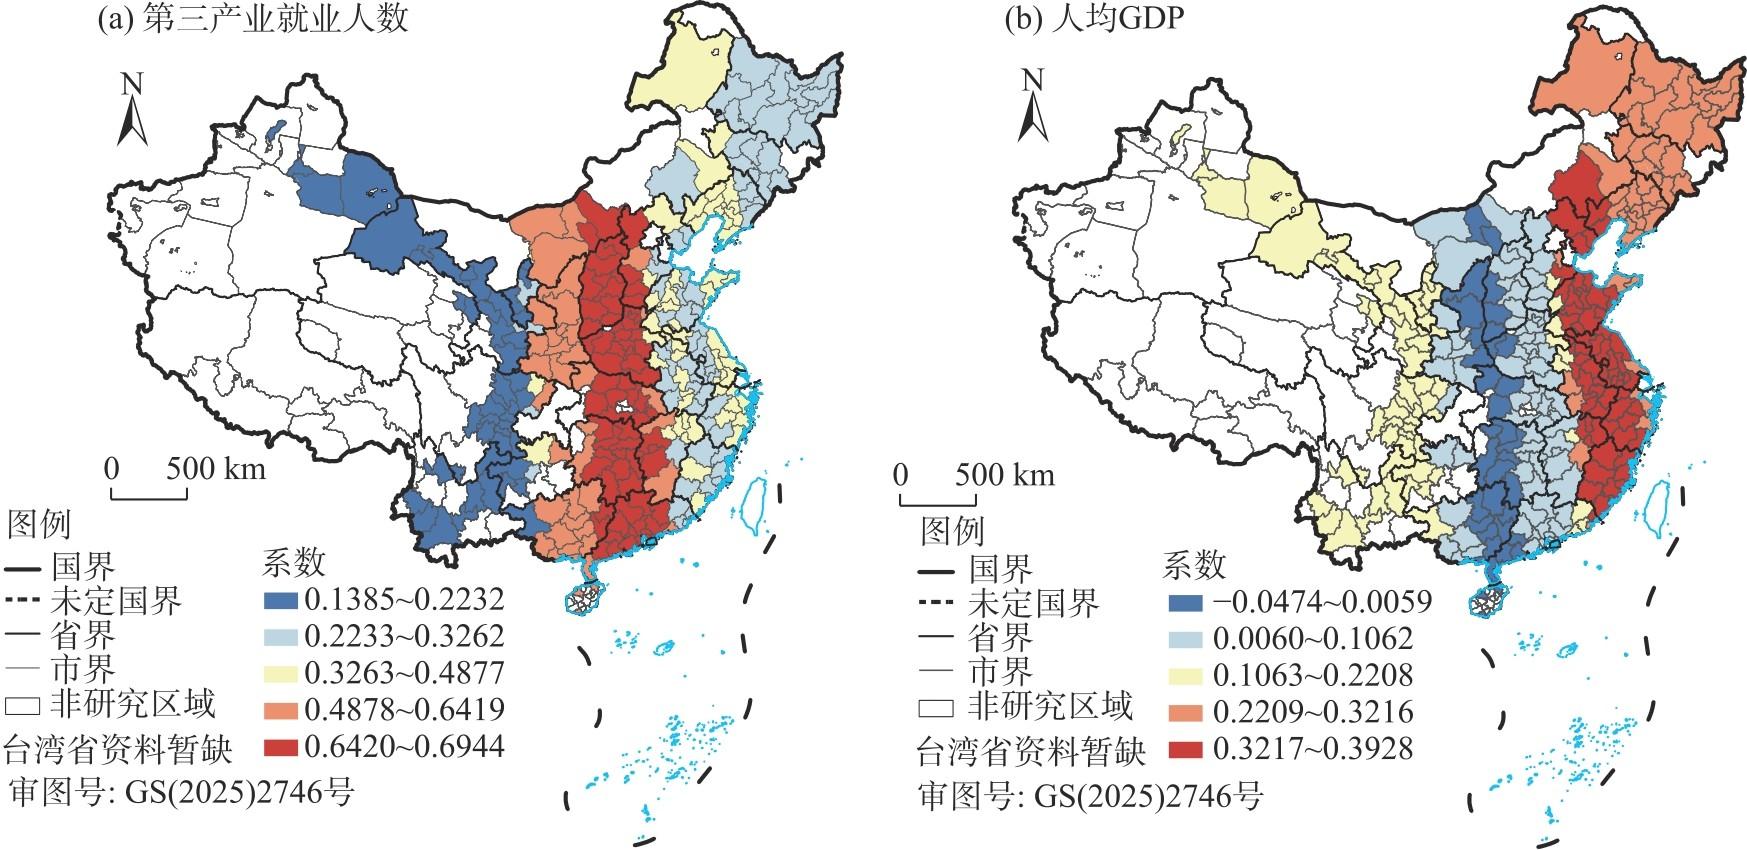
物流企业在区域经济中发挥着至关重要的作用,其分布情况直接影响区域经济的资源配置和市场竞争力,研究地级市物流企业空间格局演化特征及影响因素,有助于揭示物流企业集聚的形成机制。基于2006—2023年中国地级市物流企业地理位置数据,运用核密度分析、标准差椭圆、平均最近邻、空间自相关等空间分析方法,获取地级市尺度下物流企业时空格局及演化特征,并使用多尺度地理加权回归模型分析影响物流企业空间格局的因素及其空间分异特征。结果表明:(1)中国物流企业空间分布始终保持集聚特征,其空间格局经历了“一核带动、多点集聚”转变为“多核”,再逐渐转变为“双核”的演化过程,且存在廊道扩散和邻近扩散效应。(2)物流企业发展存在显著的正向溢出效应,发展较快的城市能够带动周边城市的发展。欠发达城市受发达城市的“虹吸效应”影响,处于“虹吸潮”的低洼地带具有显著的负向溢出效应。(3)第三产业就业人数和进出口总额为物流企业空间格局的主要影响因素。其中,进出口总额、外资企业数量为全局影响因素;第三产业就业人数和人均GDP为局部影响因素。
戢晓峰 , 李子歆 , 曹瑞 , 李武 , 陈方 . 地级市尺度下中国物流企业空间格局演化特征及影响因素[J]. 干旱区地理, 2026 , 49(1) : 176 -185 . DOI: 10.12118/j.issn.1000-6060.2025.095
Logistics enterprises play a crucial role in a regional economy, with their distribution directly affecting its resource allocation and market competitiveness. The study of the evolution characteristics of the spatial pattern of logistics enterprises in prefecture-level cities and their influencing factors can help reveal the formation mechanism of logistics enterprises’ agglomeration. Based on the geographic location data of logistics enterprises in prefecture-level cities in China from 2006 to 2023, we use spatial analysis methods, such as kernel density analysis, standard deviation ellipse, average nearest neighbor, and spatial autocorrelation, to obtain the spatiotemporal pattern and evolution characteristics of logistics enterprises at prefecture-level city scale. The factors affecting the spatial pattern of logistics enterprises and their spatial differentiation are analyzed using multi-scale geographically weighted regression models. The results reveal that (1) The spatial distribution of logistics enterprises in China has always maintained the agglomeration characteristics, and its spatial pattern has experienced the “one-core-driven, multi-point agglomeration” to “multiple cores” and then gradually to the “dual-core” evolutionary process, with corridor diffusion and neighborhood diffusion effects. (2) Logistics enterprise development has a significant positive spillover effect, as a faster development of a city can drive the development of neighboring cities. Underdeveloped cities around a developed city experiencing a “siphon effect” in the “siphon tide” of low-lying areas would experience a significant negative spillover effect. (3) The number of employments in the tertiary industry and the total amount of imports and exports are the main influencing factors of the spatial pattern of logistics enterprises. Moreover, the total amount of imports and exports and the number of foreign-funded enterprises are global influencing factors, while the number of employments in the tertiary industry and GDP per capita are local influencing factors.
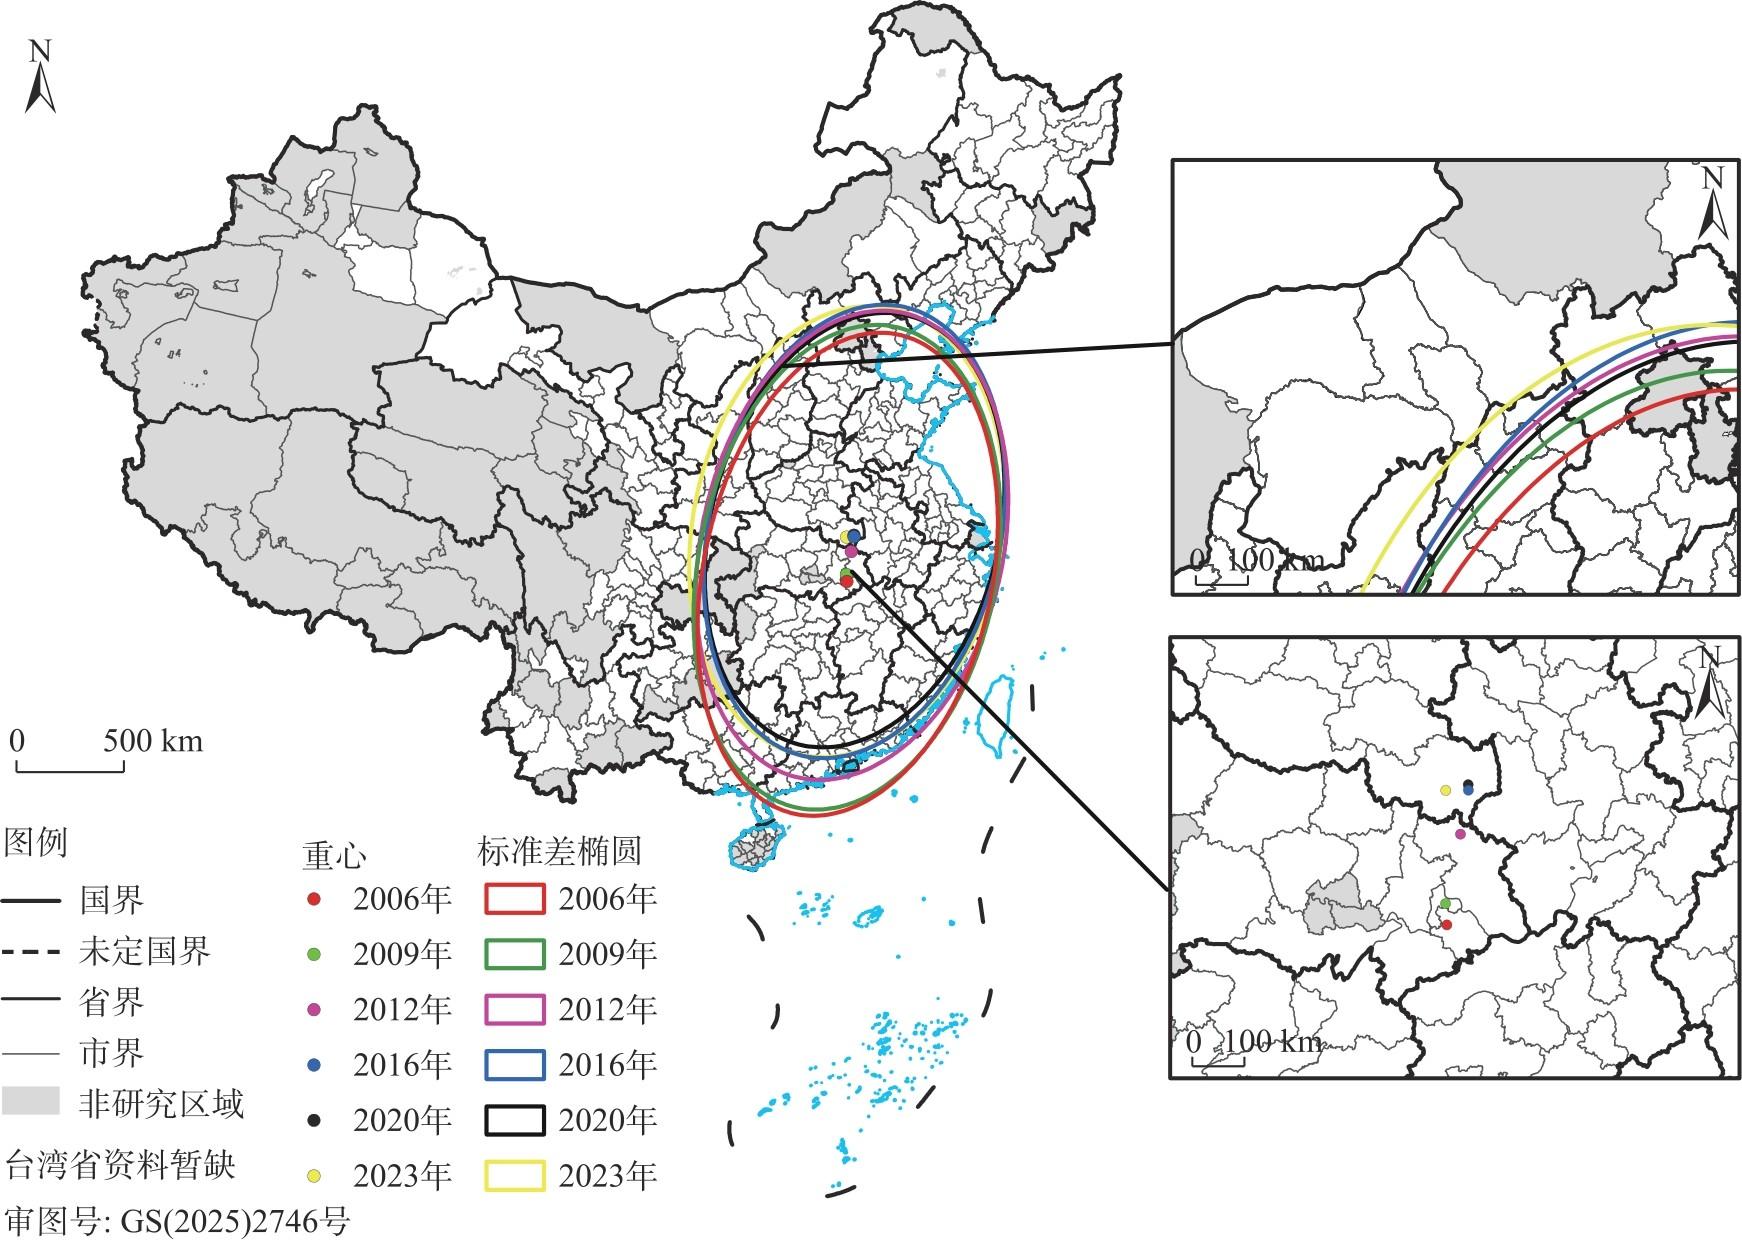
表1 地级市物流企业标准差椭圆参数Tab. 1 Standard deviation ellipse parameter of logistics enterprises in prefecture-level cities |
| 年份 | 椭圆中心经度/°E | 椭圆中心纬度/°N | 长轴长度/km | 短轴长度/km | 长短轴差距/km | 转角/(°) |
|---|---|---|---|---|---|---|
| 2006 | 115.0129 | 30.5001 | 1137.3493 | 678.1388 | 459.2105 | 11.3497 |
| 2009 | 115.0120 | 30.7920 | 1136.2869 | 699.4086 | 436.8783 | 10.4809 |
| 2012 | 115.3627 | 31.6742 | 1097.2123 | 706.1017 | 391.1106 | 12.1632 |
| 2016 | 115.5566 | 32.2317 | 1056.2653 | 681.2854 | 374.9799 | 12.1285 |
| 2020 | 115.5574 | 32.2692 | 1015.2783 | 672.8005 | 342.4778 | 13.9228 |
| 2023 | 115.1534 | 32.2529 | 1045.1275 | 723.0230 | 322.1045 | 10.5968 |
表2 地级市物流企业平均最近邻分析结果Tab. 2 Average nearest neighbor analysis results for logistics companies in prefecture-level cities |
| 年份 | 平均观测距离/km | 最近邻比率 | Z值 | P值 | 分布类型 |
|---|---|---|---|---|---|
| 2006 | 975.2468 | 0.1425 | -441.0534 | 0.0000 | 显著聚集 |
| 2009 | 812.1787 | 0.1420 | -528.3189 | 0.0000 | 显著聚集 |
| 2012 | 719.0645 | 0.1421 | -597.4309 | 0.0000 | 显著聚集 |
| 2016 | 479.3788 | 0.1296 | -831.6884 | 0.0000 | 显著聚集 |
| 2020 | 373.5720 | 0.1217 | -1015.6757 | 0.0000 | 显著聚集 |
| 2023 | 630.1272 | 0.1435 | -686.7394 | 0.0000 | 显著聚集 |
注:Z值表示统计值;P值表示显著性水平。下同。 |
表3 地级市物流企业全局自相关分析结果Tab. 3 Results of global autocorrelation analysis of logistics enterprises in prefecture-level cities |
| 年份 | 全局Moran’s I指数 | Z值 | P值 |
|---|---|---|---|
| 2006 | 0.0668 | 11.5576 | 0.0000 |
| 2009 | 0.1324 | 18.3909 | 0.0000 |
| 2012 | 0.1026 | 13.9922 | 0.0000 |
| 2016 | 0.0587 | 8.5120 | 0.0000 |
| 2020 | 0.0761 | 10.2908 | 0.0000 |
| 2023 | 0.0584 | 8.0763 | 0.0000 |
表4 物流企业空间分布影响因素Tab. 4 Factors affecting the spatial distribution of logistics enterprises |
| 维度 | 变量 | 指标 |
|---|---|---|
| 经济因素 | 地区经济水平 | 地区生产总值/104元 |
| 经济发展水平 | 地方财政收入总额/104元 | |
| 社会因素 | 交通发展水平 | 道路网密度/km·km-2 |
| 劳动力水平 | 第三产业就业人数/104人 | |
| 市场因素 | 居民消费能力 | 人均GDP/元 |
| 开放程度 | 国际贸易水平 | 进出口总额/104元 |
| 对外开放水平 | 外资企业数量/个 |
表5 OLS模型、GWR模型和MGWR模型结果对比Tab. 5 Comparison of OLS model, GWR model and MGWR model results |
| 变量 | OLS模型 | GWR模型 | MGWR模型 | |||||
|---|---|---|---|---|---|---|---|---|
| 系数 | VIF | Mean | 带宽 | Mean | 带宽 | |||
| 地区生产总值 | 0.00001** | 19.67 | - | - | - | - | ||
| 地方财政收入总额 | 0.00004* | 18.54 | - | - | - | - | ||
| 道路网密度 | -73.27181 | 7.12 | 0.013 | 74 | 0.364 | 154 | ||
| 第三产业就业人数 | 1.21569 | 4.97 | 0.392*** | 74 | 0.361*** | 66 | ||
| 人均GDP | 0.43760** | 4.38 | 0.166*** | 74 | 0.106*** | 86 | ||
| 进出口总额 | 0.00002*** | 2.61 | 0.666*** | 74 | 0.472*** | 286 | ||
| 外资企业数量 | -1.01783*** | 1.26 | 0.221*** | 74 | -0.206*** | 183 | ||
| AICc | 4157.667 | 163.599 | 162.389 | |||||
| R2 | 0.885 | 0.924 | 0.930 | |||||
| 调整后R2 | 0.883 | 0.912 | 0.920 | |||||
注:OLS为普通最小二乘法;GWR为地理加权回归;MGWR为多尺度地理加权回归;VIF为膨胀因子;Mean为变量系数估计均值;AICc为修正的赤池正信息量准则;R2为拟合优度;***、**、*分别表示通过1%、5%和10%显著性检验。 |
| [1] |
梁双波, 曹有挥, 吴威. 上海大都市区港口物流企业的空间格局演化[J]. 地理研究, 2013, 32(8): 1448-1456.
[
|
| [2] |
蒋天颖, 伍婵提, 陈改改. 浙江省A级物流企业时空格局特征研究[J]. 地理科学, 2017, 37(11): 1720-1727.
[
|
| [3] |
蒋天颖, 史亚男. 宁波市物流企业空间格局演化及影响因素[J]. 经济地理, 2015, 35(10): 130-138.
[
|
| [4] |
王瑞, 蒋天颖, 王帅. 宁波市港口物流企业空间格局及区位选择[J]. 地理科学, 2018, 38(5): 691-698.
[
|
| [5] |
潘方杰, 万庆, 冯兵, 等. 中国物流企业空间格局及多尺度特征分析[J]. 经济地理, 2021, 41(6): 97-106.
[
|
| [6] |
潘方杰, 王宏志, 宋明洁, 等. 基于GIS的中国A级物流企业时空演变特征及其影响因素[J]. 长江流域资源与环境, 2020, 29(10): 2186-2199.
[
|
| [7] |
|
| [8] |
|
| [9] |
|
| [10] |
张圣忠, 柴廷熠. 西安市物流企业空间格局演化及影响因素分析[J]. 世界地理研究, 2021, 30(6): 1275-1285.
[
|
| [11] |
|
| [12] |
|
| [13] |
王东方, 张华荣, 李金峰, 等. 上海市物流企业时空格局演化及区位选择[J]. 经济地理, 2023, 43(11): 135-144.
[
|
| [14] |
张圣忠, 孟迪, 柴廷熠. 关中平原城市群物流企业空间格局演化及影响因素研究[J]. 世界地理研究, 2024, 33(4): 117-129.
[
|
| [15] |
李天宇, 陆林, 张海洲, 等. 长三角城市群A级物流企业空间演化特征及驱动因素[J]. 经济地理, 2021, 41(11): 157-166.
[
|
| [16] |
张璐璐, 赵金丽, 宋金平. 京津冀城市群物流企业空间格局演化及影响因素[J]. 经济地理, 2019, 39(3): 125-133.
[
|
| [17] |
|
| [18] |
赵学伟, 张志斌, 冯斌, 等. 西北内陆中心城市物流企业空间分异及区位选择——以兰州市为例[J]. 干旱区地理, 2022, 45(5): 1671-1683.
[
|
| [19] |
|
| [20] |
|
| [21] |
|
| [22] |
戢晓峰, 王然, 陈方, 等. 中国城市物流蔓延的时空演化特征——基于329个城市的物流用地面板数据[J]. 地理科学, 2021, 41(2): 215-222.
[
|
| [23] |
林秋平, 李松芮, 杨上广, 等. 乌鲁木齐市物流企业区位时空演化、影响因素和发展策略研究[J]. 干旱区地理, 2024, 47(7): 1252-1262.
[
|
| [24] |
李松芮, 林秋平, 杨上广. 新疆物流企业空间布局多尺度演化特征及影响因素研究[J]. 干旱区地理, 2025, 48(4): 739-752.
[
|
| [25] |
|
| [26] |
戢晓峰, 孔林, 曹瑞, 等. 我国都市圈物流企业空间集聚的时空演化特征与引导策略研究[J]. 昆明理工大学学报(社会科学版), 2025, 25(2): 105-116.
[
|
/
| 〈 |
|
〉 |