
中国资源型城市转型脱碳时空演进及路径选择
|
杨巨星(1998-),男,博士研究生,主要从事资源与环境经济学研究. E-mail: yjuxing@126.com |
收稿日期: 2024-12-08
修回日期: 2025-02-03
网络出版日期: 2026-03-11
基金资助
国家自然科学基金项目(71963030)
科技部重大科技项目暨第三次新疆综合科学考察课题(SQ2021xjkk01800-5)
新疆维吾尔自治区自然科学基金青年项目(2024D01C255)
Spatiotemporal evolution and pathway selection of transformation decarbonization in resource-based cities of China
Received date: 2024-12-08
Revised date: 2025-02-03
Online published: 2026-03-11
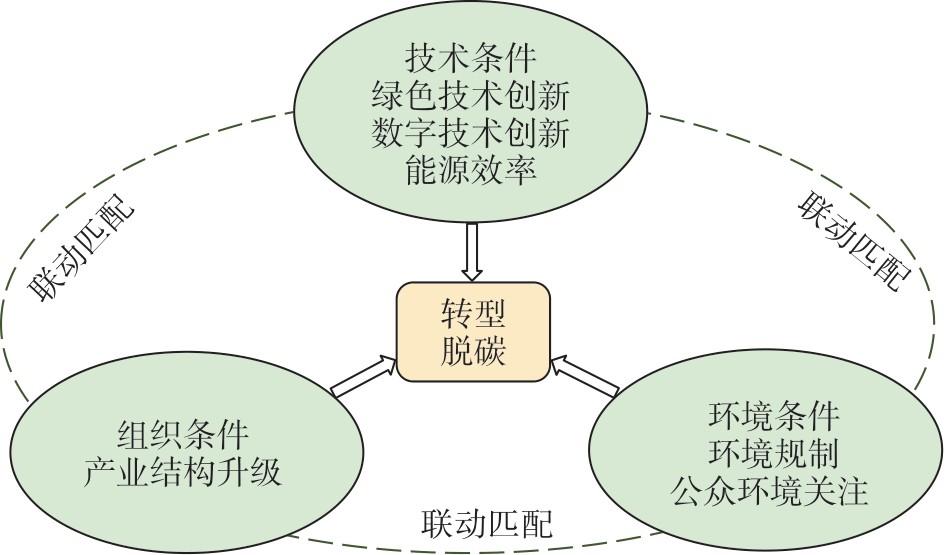
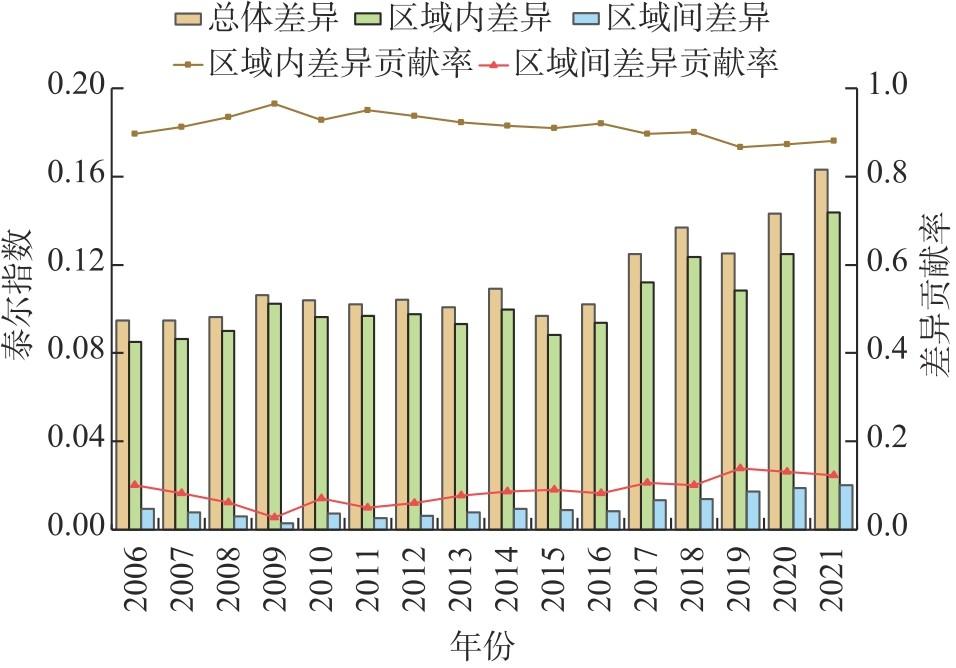
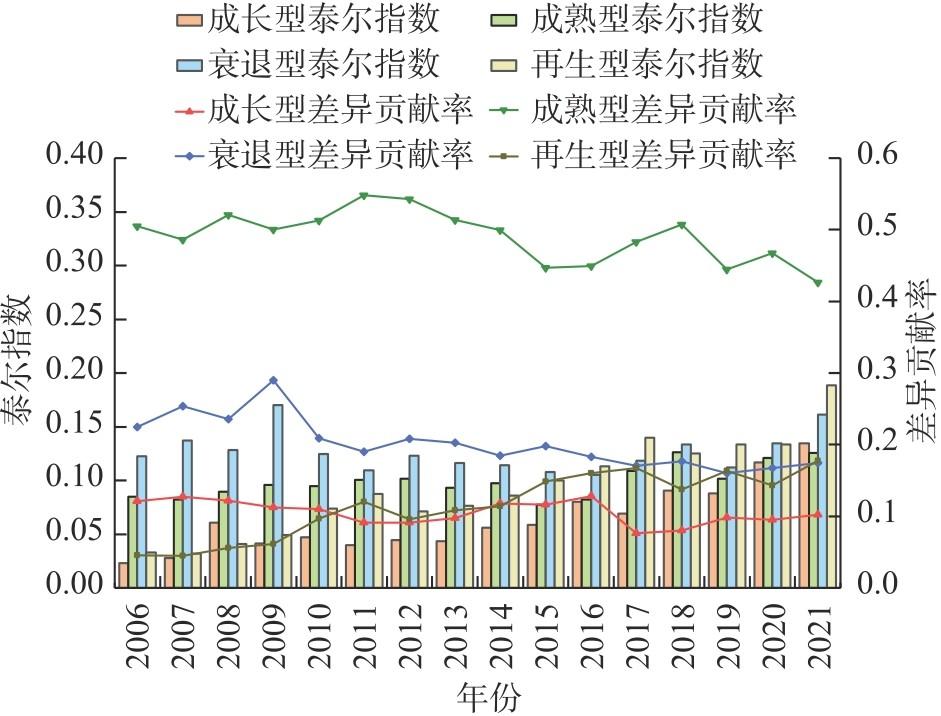
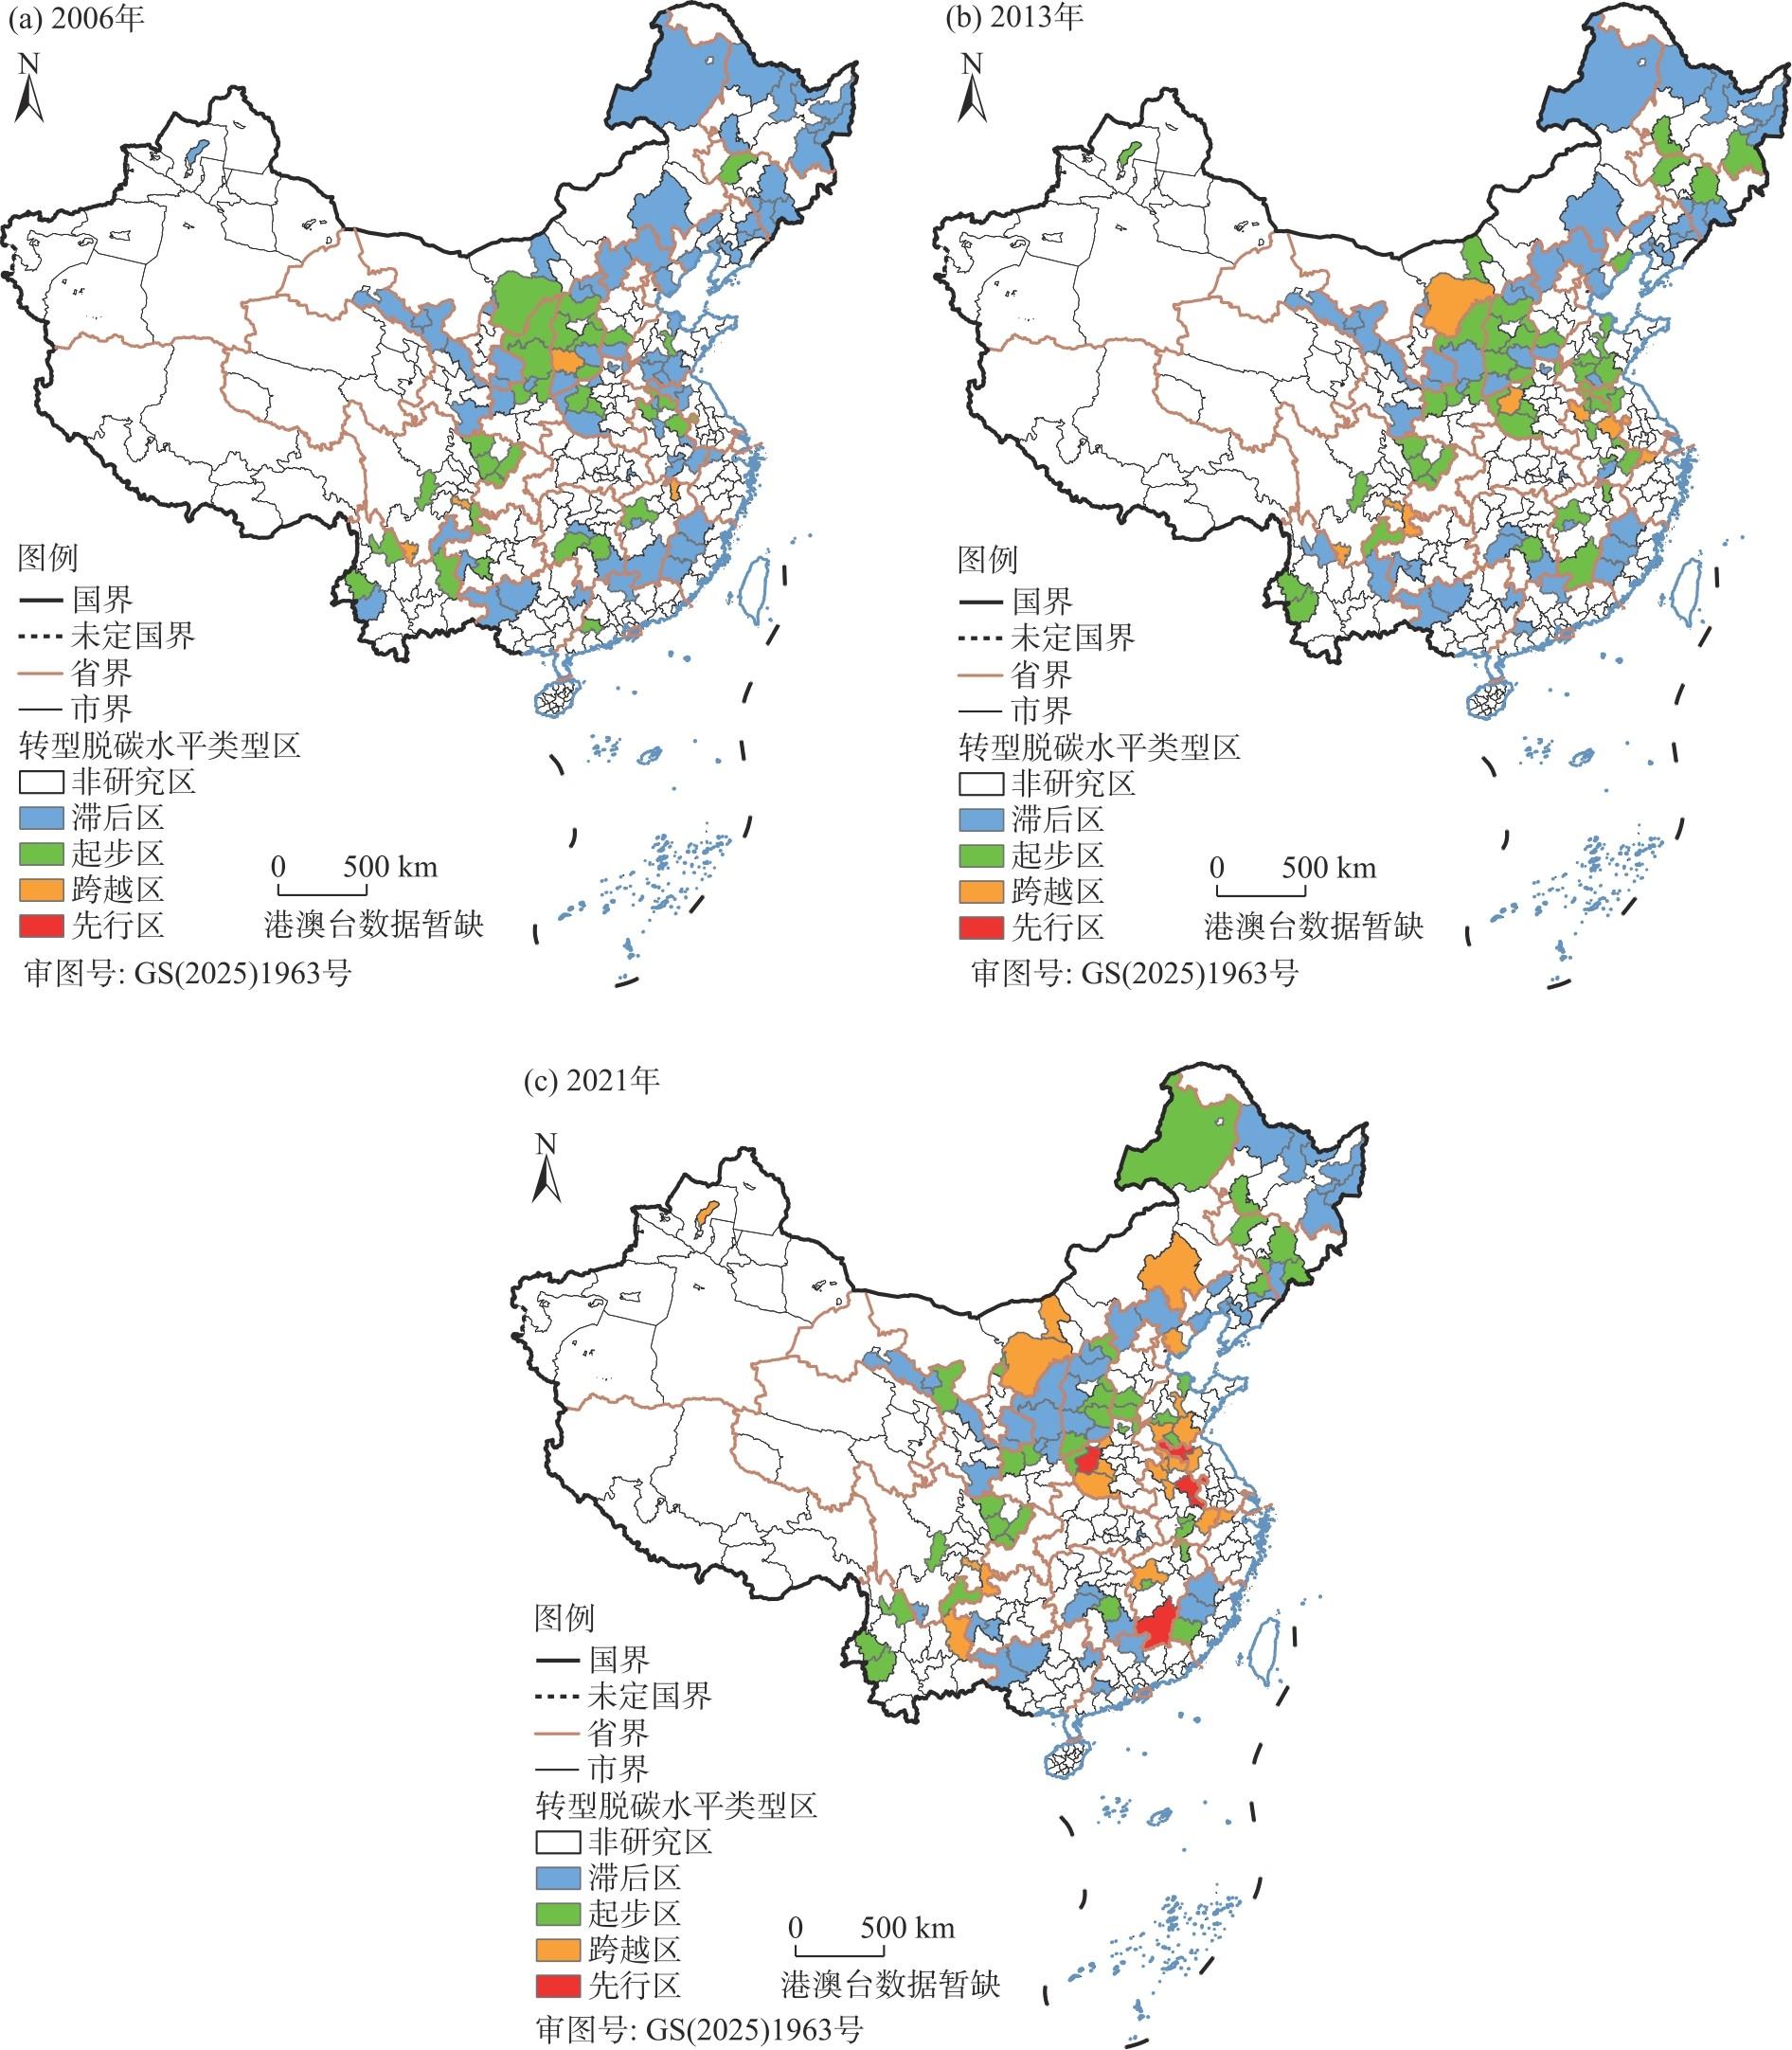
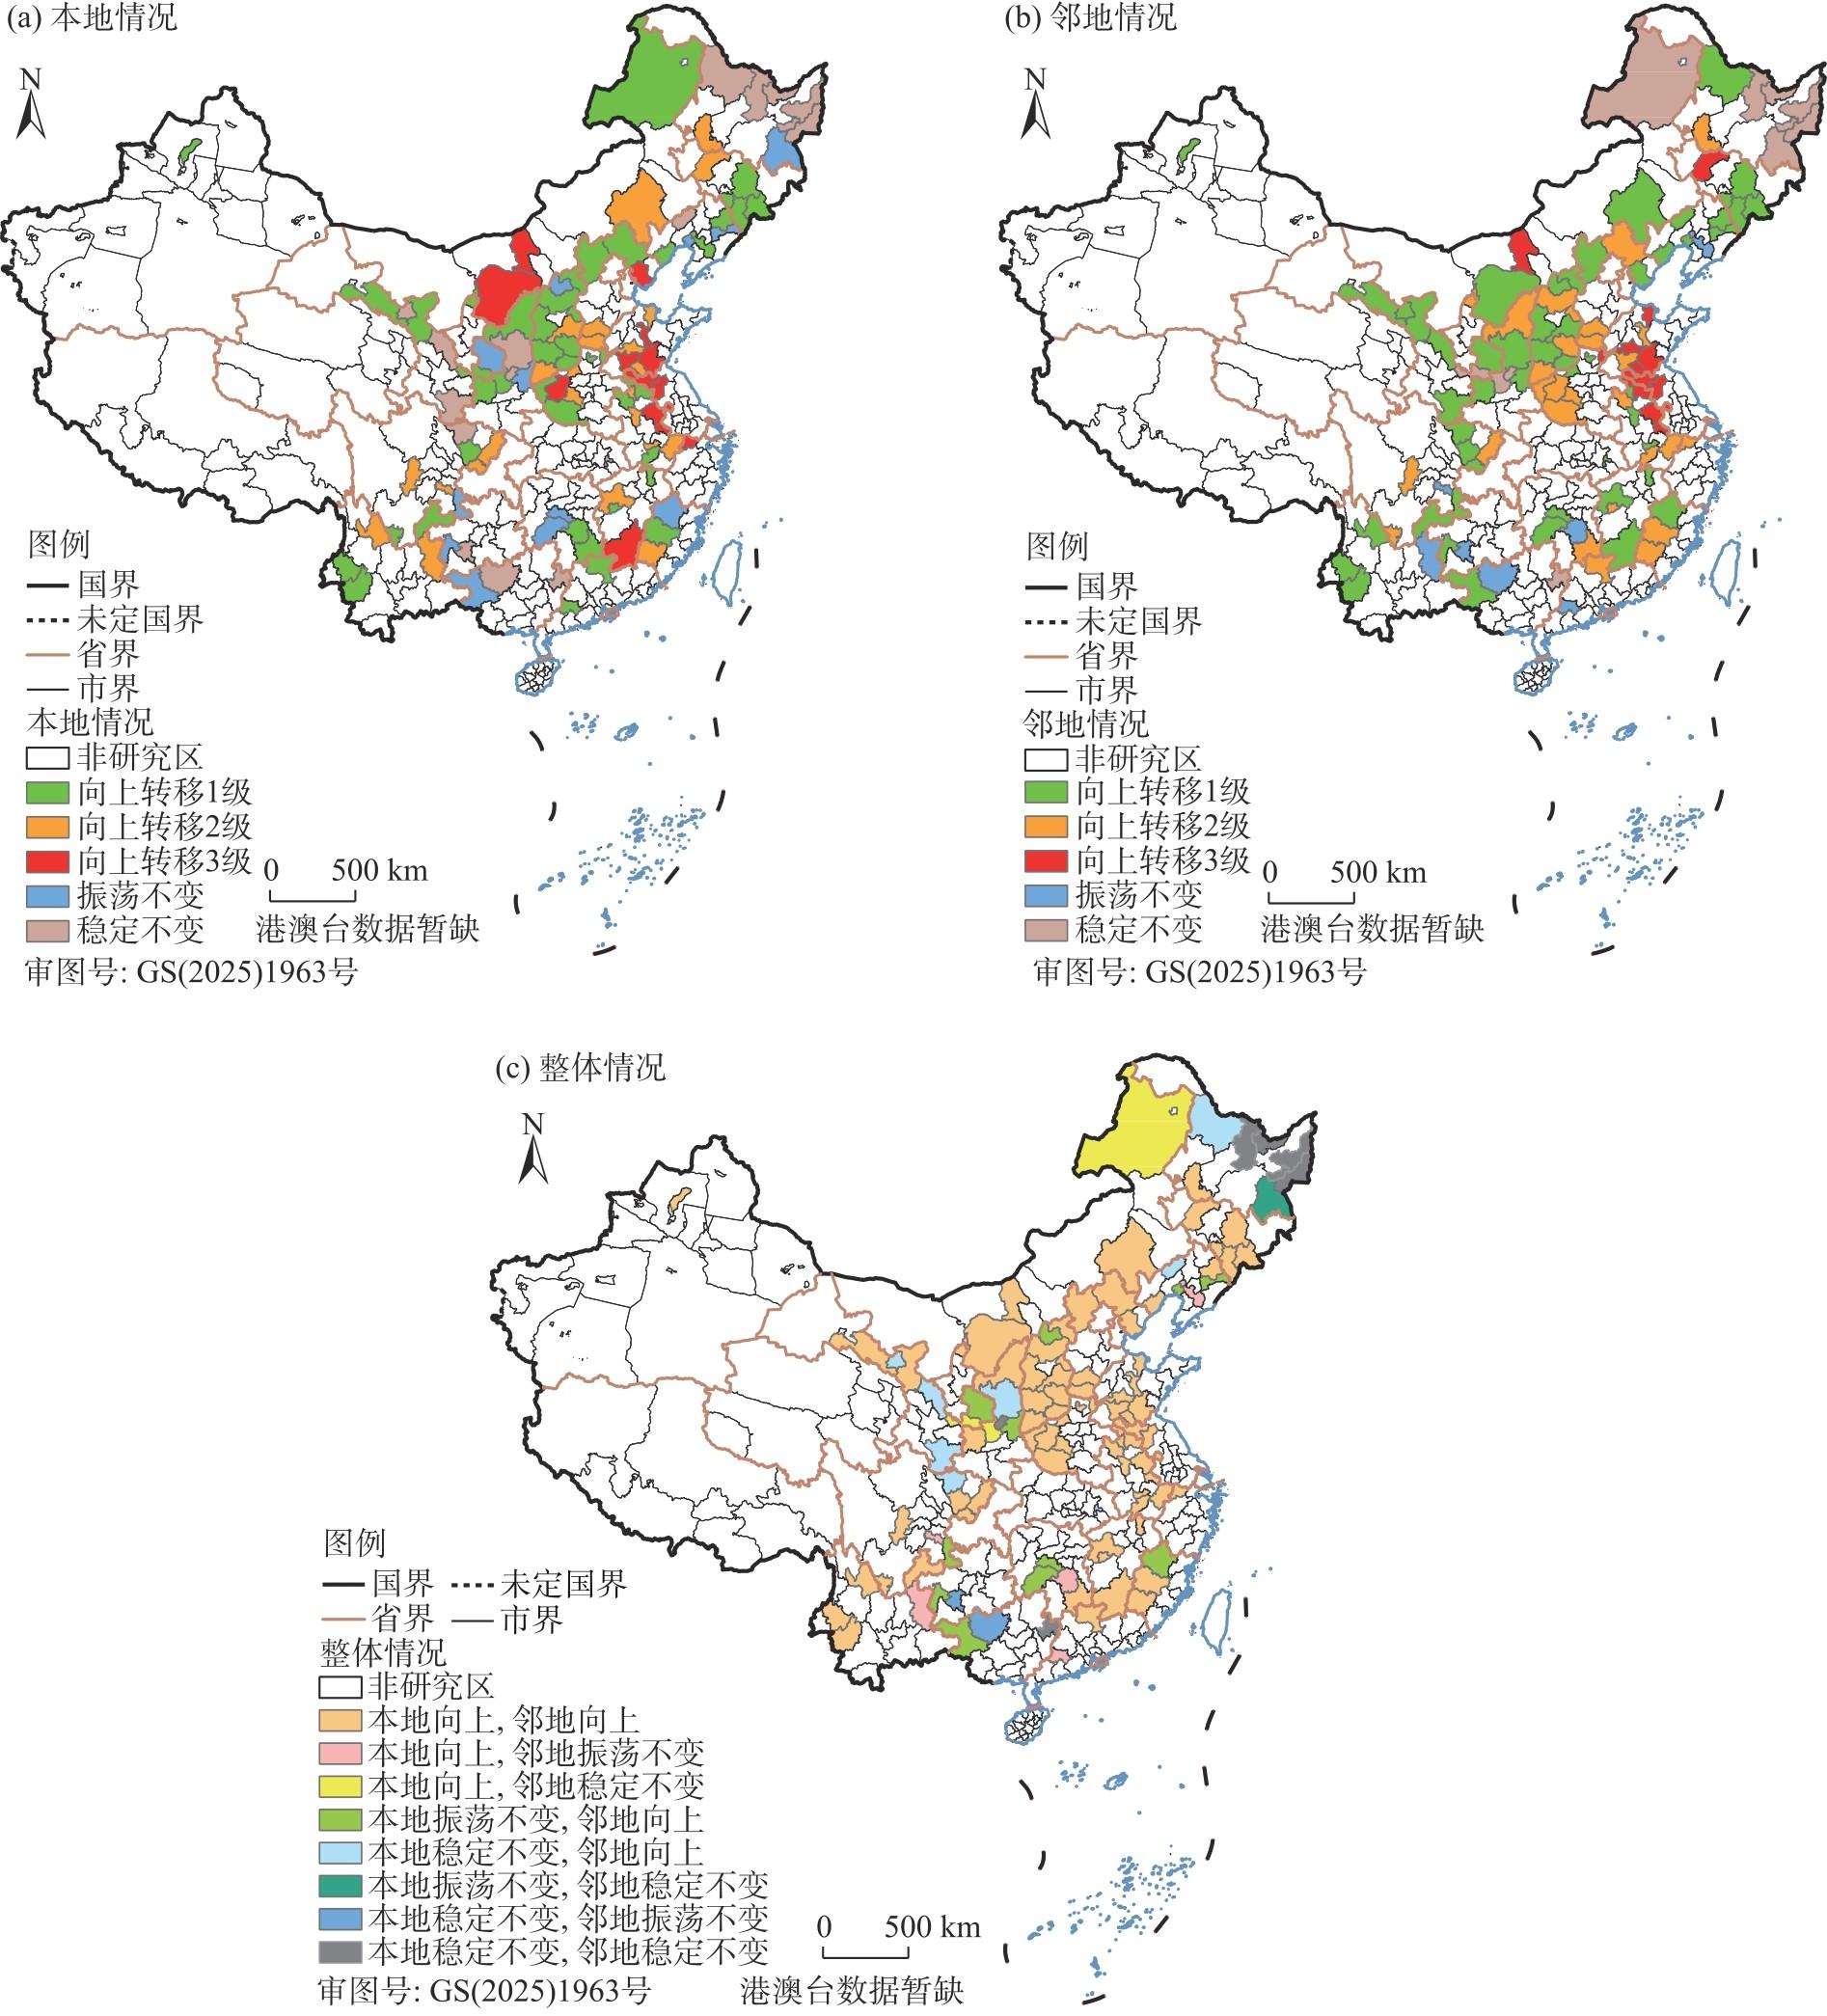
资源型城市转型脱碳是实现“双碳”目标的关键。测度2006—2021年中国资源型城市转型脱碳水平,采用空间马尔科夫链和模糊集定性比较分析(fsQCA)方法,探究资源型城市转型脱碳的时空演进特征及路径选择。结果表明:(1)资源型城市转型脱碳水平逐年上升,发展格局由以滞后区为核心的集中连片分布向跨越区和先行区为核心的组团式分布进行演变;转型脱碳总体差异明显,区域内差异和成熟型城市分别是导致总体差异变大的主要原因及来源。(2)转型脱碳类型的转移具有稳定性,存在“路径依赖”现象;保持初始状态的概率较大,呈现“俱乐部收敛”特征;并在连续向上转移过程中存在“马太效应”,且空间溢出效应明显。(3)技术、组织、环境因素均不能单独构成实现转型脱碳的必要条件,各因素多重并发,形成资源型城市转型脱碳的3种组态路径,分别为“技术-环境”协同驱动型、“技术-组织”协同驱动型与“技术-组织-环境”联合驱动型,其中绿色技术创新发挥核心作用。(4)不同类型资源型城市倚重不同因素:成长型城市依赖数字技术与环境关注,成熟型城市通过技术创新、产业升级和环境因素等多方面联合驱动,衰退型城市受环境因素影响更大,再生型城市强调技术创新与环境因素协同驱动。研究结果可为中国资源型城市实现转型脱碳提供有益经验和实践启示。
杨巨星 , 孙慧 , 周晋楠 , 陀才进 , 张若威 . 中国资源型城市转型脱碳时空演进及路径选择[J]. 干旱区地理, 2026 , 49(1) : 151 -163 . DOI: 10.12118/j.issn.1000-6060.2024.743
The transformation decarbonization of resource-based cities are essential for advancing China’s carbon peaking and carbon neutrality goals. This study evaluates the transformation decarbonization levels of resource-based cities from 2006 to 2021 and employs a spatial Markov chain model together with fuzzy-set qualitative comparative analysis (fsQCA) to explore their spatiotemporal evolution and transition pathways. The results indicate three key findings: (1) Transformation decarbonization levels have improved steadily over time. Spatial patterns have shifted from a concentrated distribution dominated by lagging areas to a clustered structure characterized by transitional and pioneering zones. Although large overall disparities persist, these differences mainly stem from intra-regional variation and the performance of mature-type cities. (2) Transformation decarbonization types exhibit stable evolutionary trajectories, demonstrating clear “path-dependence”. Cities tend to maintain their initial states, showing prominent “club convergence”. A “Matthew effect” is evident during upward transitions, accompanied by significant spatial spillover effects across neighboring regions. (3) No single factor, technological, organizational, or environmental, constitutes a necessary condition for achieving transformation decarbonization. Instead, these elements interact to form three configurational pathways: A technology-environment synergy pathway, a technology-organization synergy pathway, and a combined technology-organization-environment pathway. Across all pathways, green technology innovation plays a central and catalytic role. (4) Resource-based cities of different developmental stages rely on distinct drivers. Growing cities primarily depend on digital technology and rising environmental awareness. Mature cities are jointly driven by technological innovation, industrial upgrading, and environmental regulation. Declining cities are more strongly influenced by environmental constraints, while regenerating cities rely on the combined momentum of technological innovation and environmental factors. Overall, this study offers empirical evidence and policy-relevant insights to support the transformation decarbonization in resource-based cities of China.
表1 资源型城市转型脱碳评价指标体系及描述性统计Tab. 1 Evaluation index system and descriptive statistics of transformation decarbonization of resource-based cities |
| 子系统 | 维度 | 指标 | 测算方法 | 指标属性 | 均值 | 标准差 | 最小值 | 最大值 |
|---|---|---|---|---|---|---|---|---|
| 转型 | 能源转型 | 煤炭消费占比 | 煤炭消费量与能源消费总量之比 | 负向 | 0.838 | 0.152 | 0.124 | 0.997 |
| 能源利用效率 | SBM-Malmquist-Luenberger指数法 | 正向 | 0.287 | 0.111 | 0.098 | 1.177 | ||
| 产业转型 | 产业结构合理化 | 泰尔指数法 | 正向 | 0.296 | 0.253 | 0.001 | 3.430 | |
| 产业结构高级化 | 第三产业产值与第二产业产值之比 | 正向 | 0.878 | 0.458 | 0.094 | 3.758 | ||
| 技术转型 | 绿色技术创新/件 | 绿色专利申请量 | 正向 | 119.000 | 216.000 | 0.000 | 2647.000 | |
| 数字技术创新/件 | 数字专利申请量 | 正向 | 268.000 | 544.000 | 0.000 | 6106.000 | ||
| 脱碳 | 碳排放 | 碳排放总量/104 t | 直接排放与间接排放之和 | 负向 | 2877.348 | 1016.082 | 537.160 | 4920.000 |
| 碳排放强度/t·(104元)-1 | 碳排放总量与GDP之比 | 负向 | 4.381 | 4.323 | 0.169 | 31.153 | ||
| 脱碳率 | 碳排放强度的变化率 | 正向 | 0.030 | 0.133 | -0.592 | 0.633 |
注:本文选取2006—2021年中国111个资源型城市进行研究,城市样本总数为1776。 |
表2 2006—2021年空间马尔科夫转移概率矩阵Tab. 2 Spatial Markov transfer probability matrix from 2006 to 2021 |
| 空间滞后类型 | 滞后 | 起步 | 跨越 | 先行 | |
|---|---|---|---|---|---|
| 传统无滞后 | 滞后 | 0.846 | 0.140 | 0.007 | 0.007 |
| 起步 | 0.100 | 0.694 | 0.199 | 0.007 | |
| 跨越 | 0.024 | 0.118 | 0.698 | 0.160 | |
| 先行 | 0.003 | 0.008 | 0.091 | 0.899 | |
| 滞后 | 滞后 | 0.914 | 0.086 | 0.000 | 0.000 |
| 起步 | 0.117 | 0.777 | 0.107 | 0.000 | |
| 跨越 | 0.074 | 0.222 | 0.593 | 0.111 | |
| 先行 | 0.000 | 0.111 | 0.111 | 0.778 | |
| 起步 | 滞后 | 0.849 | 0.130 | 0.007 | 0.014 |
| 起步 | 0.082 | 0.738 | 0.180 | 0.000 | |
| 跨越 | 0.022 | 0.089 | 0.711 | 0.178 | |
| 先行 | 0.014 | 0.000 | 0.069 | 0.917 | |
| 跨越 | 滞后 | 0.644 | 0.322 | 0.034 | 0.000 |
| 起步 | 0.123 | 0.651 | 0.212 | 0.014 | |
| 跨越 | 0.027 | 0.137 | 0.703 | 0.132 | |
| 先行 | 0.000 | 0.008 | 0.102 | 0.891 | |
| 先行 | 滞后 | 0.500 | 0.333 | 0.000 | 0.167 |
| 起步 | 0.020 | 0.551 | 0.408 | 0.020 | |
| 跨越 | 0.008 | 0.088 | 0.704 | 0.200 | |
| 先行 | 0.000 | 0.005 | 0.090 | 0.904 | |
表3 必要条件分析(NCA)结果Tab. 3 Necessary condition analysis results |
| 条件变量 | 方法 | 精确度/% | 上限区域 | 范围 | 效应量(d) | P值 |
|---|---|---|---|---|---|---|
| 绿色技术创新 | 上限回归分析 | 90.4 | 0.122 | 0.970 | 0.026 | 0.000 |
| 上限包络分析 | 100.0 | 0.057 | 0.970 | 0.058 | 0.000 | |
| 数字技术创新 | 上限回归分析 | 88.6 | 0.154 | 0.970 | 0.059 | 0.000 |
| 上限包络分析 | 100.0 | 0.058 | 0.970 | 0.060 | 0.000 | |
| 能源效率 | 上限回归分析 | 99.1 | 0.008 | 0.990 | 0.008 | 0.647 |
| 上限包络分析 | 100.0 | 0.011 | 0.990 | 0.011 | 0.558 | |
| 产业结构升级 | 上限回归分析 | 92.1 | 0.042 | 1.000 | 0.042 | 0.160 |
| 上限包络分析 | 100.0 | 0.019 | 1.000 | 0.019 | 0.172 | |
| 环境规制 | 上限回归分析 | 93.9 | 0.055 | 1.000 | 0.055 | 0.057 |
| 上限包络分析 | 100.0 | 0.040 | 1.000 | 0.040 | 0.013 | |
| 公众环境关注 | 上限回归分析 | 95.6 | 0.052 | 0.990 | 0.052 | 0.049 |
| 上限包络分析 | 100.0 | 0.027 | 0.990 | 0.027 | 0.027 |
注:条件变量采用校准后的数值;当0≤d<0.1时表示低水平,0.1≤d<0.3时表示中水平,0.3≤d<0.5时表示中高水平,d≥0.5时表示高水平;P值为NCA分析中置换检验(重复抽样次数=10000)。 |
表4 实现高转型脱碳水平的组态路径Tab. 4 Grouping pathways to achieve high transformation decarbonization levels |
| 条件组态 | 高转型脱碳水平的解 | |||
|---|---|---|---|---|
| 组态1 | 组态2 | 组态3 | 组态4 | |
| 绿色技术创新 | $\bullet$ | $\bullet$ | $\bullet$ | $\bullet$ |
| 数字技术创新 | $\bullet$ | $\bullet$ | $\bullet$ | |
| 能源效率 | $\bullet$ | $\otimes$ | $\bigotimes$ | |
| 产业结构升级 | $\bullet$ | $\cdot$ | ||
| 环境规制 | $\bullet$ | $\bigotimes$ | $\bullet$ | |
| 公众环境关注 | $\bullet$ | $\bullet$ | ||
| 原始覆盖度 | 0.634 | 0.411 | 0.232 | 0.224 |
| 唯一覆盖度 | 0.178 | 0.010 | 0.020 | 0.007 |
| 一致性 | 0.842 | 0.876 | 0.868 | 0.918 |
| 总体覆盖度 | 0.677 | |||
| 总体一致性 | 0.829 | |||
注:$\bullet$表示核心条件存在;$\cdot$表示边缘条件存在;$\bigotimes$表示核心条件缺失;$\otimes$表示边缘条件缺失;空白表示条件可存在也可不存在。下同。 |
表5 转型脱碳实现路径的异质性分析Tab. 5 Heterogeneity analysis of transformation decarbonization realization pathways |
| 条件组态 | 成长型 组态1 | 成熟型 | 衰退型 组态3 | 再生型 | |||
|---|---|---|---|---|---|---|---|
| 组态2a | 组态2b | 组态2c | 组态4a | 组态4b | |||
| 绿色技术创新 | $\bigotimes$ | $\bullet$ | $\cdot$ | $\bullet$ | $\cdot$ | $\cdot$ | $\bullet$ |
| 数字技术创新 | $\bullet$ | $\bullet$ | $\bullet$ | $\cdot$ | $\cdot$ | $\bullet$ | $\cdot$ |
| 能源效率 | $\bullet$ | $\bullet$ | $\bigotimes$ | $\cdot$ | |||
| 产业结构升级 | $\otimes$ | $\bullet$ | $\bullet$ | $\otimes$ | $\otimes$ | ||
| 环境规制 | $\bigotimes$ | $\bullet$ | $\otimes$ | $\bullet$ | $\cdot$ | ||
| 公众环境关注 | $\bullet$ | $\bullet$ | $\bullet$ | $\bigotimes$ | $\bullet$ | $\cdot$ | $\bullet$ |
| 原始覆盖度 | 0.309 | 0.516 | 0.328 | 0.235 | 0.376 | 0.749 | 0.430 |
| 唯一覆盖度 | 0.309 | 0.236 | 0.028 | 0.047 | 0.376 | 0.351 | 0.032 |
| 一致性 | 0.888 | 0.864 | 0.914 | 0.926 | 0.835 | 0.927 | 0.965 |
| 总体覆盖度 | 0.309 | 0.618 | 0.376 | 0.781 | |||
| 总体一致性 | 0.888 | 0.880 | 0.835 | 0.930 | |||
| [1] |
|
| [2] |
|
| [3] |
|
| [4] |
|
| [5] |
|
| [6] |
|
| [7] |
|
| [8] |
|
| [9] |
|
| [10] |
吴茜, 陈强强. 甘肃省行业碳排放影响因素及脱钩努力研究[J]. 干旱区地理, 2023, 46(2): 274-283.
[
|
| [11] |
|
| [12] |
黄鲁成, 郭鑫, 苗红, 等. 面向碳中和的脱碳成本控制: 优化创新与政策[J]. 科学学研究, 2022, 40(12): 2187-2193.
[
|
| [13] |
魏一鸣, 韩融, 余碧莹, 等. 全球能源系统转型趋势与低碳转型路径——来自于IPCC第六次评估报告的证据[J]. 北京理工大学学报(社会科学版), 2022, 24(4): 163-188.
[
|
| [14] |
江深哲, 杜浩锋, 徐铭梽. “双碳”目标下能源与产业双重结构转型[J]. 数量经济技术经济研究, 2024, 41(2): 109-130.
[
|
| [15] |
薛飞, 周民良, 刘家旗. 产业转型升级能否降低碳排放?——来自国家产业转型升级示范区的证据[J]. 产业经济研究, 2023(2): 1-13.
[
|
| [16] |
|
| [17] |
徐维祥, 郑金辉, 周建平, 等. 资源型城市转型绩效特征及其碳减排效应[J]. 自然资源学报, 2023, 38(1): 39-57.
[
|
| [18] |
张文忠, 余建辉. 中国资源型城市转型发展的政策演变与效果分析[J]. 自然资源学报, 2023, 38(1): 22-38.
[
|
| [19] |
刘小玲, 唐卓伟, 孙晓华, 等. 要素错配:解开资源型城市转型困境之谜[J]. 中国人口·资源与环境, 2022, 32(10): 88-102.
[
|
| [20] |
席振鑫, 马丽, 金凤君, 等. 黄河流域典型资源型城市工业转型的时空特征、类型与路径[J]. 资源科学, 2023, 45(10): 1977-1991.
[
|
| [21] |
徐英启, 程钰, 王晶晶. 中国资源型城市碳排放效率时空演变与绿色技术创新影响[J]. 地理研究, 2023, 42(3): 878-894.
[
|
| [22] |
穆佳音, 王金满, 刘彪, 等. 资源型城市碳排放演变及影响因素研究进展[J]. 煤炭学报, 2024, 49(增刊2): 1130-1142.
[
|
| [23] |
刘晓燕, 孙慧. 资源型产业碳排放驱动因素演化与低碳发展路径选择[J]. 统计与决策, 2019, 35(2): 53-57.
[
|
| [24] |
张希良, 黄晓丹, 张达, 等. 碳中和目标下的能源经济转型路径与政策研究[J]. 管理世界, 2022, 38(1): 35-66.
[
|
| [25] |
方文君, 邓峰, 张战仁, 等. 环境目标约束对能源结构低碳转型的影响[J]. 中国人口·资源与环境, 2024, 34(1): 84-96.
[
|
| [26] |
高瑜, 李响, 李俊青. 金融科技与技术创新路径——基于绿色转型的视角[J]. 中国工业经济, 2024(2): 80-98.
[
|
| [27] |
|
| [28] |
史丹, 李少林. 排污权交易制度与能源利用效率——对地级及以上城市的测度与实证[J]. 中国工业经济, 2020(9): 5-23.
[
|
| [29] |
干春晖, 郑若谷, 余典范. 中国产业结构变迁对经济增长和波动的影响[J]. 经济研究, 2011, 46(5): 4-16, 31.
[
|
| [30] |
丛建辉, 刘学敏, 赵雪如. 城市碳排放核算的边界界定及其测度方法[J]. 中国人口·资源与环境, 2014, 24(4): 19-26.
[
|
| [31] |
|
| [32] |
周小亮, 吴武林. 中国包容性绿色增长的测度及分析[J]. 数量经济技术经济研究, 2018, 35(8): 3-20.
[
|
| [33] |
|
| [34] |
杜运周, 刘秋辰, 陈凯薇, 等. 营商环境生态、全要素生产率与城市高质量发展的多元模式——基于复杂系统观的组态分析[J]. 管理世界, 2022, 38(9): 127-145.
[
|
| [35] |
陶克涛, 张术丹, 赵云辉. 什么决定了政府公共卫生治理绩效?——基于QCA方法的联动效应研究[J]. 管理世界, 2021, 37(5): 128-138, 156, 10.
[
|
| [36] |
夏文浩, 霍瑜, 逯渊, 等. 新疆农业碳排放的时空差异与空间溢出效应分析[J]. 干旱区地理, 2024, 47(6): 1084-1096.
[
|
/
| 〈 |
|
〉 |