
|
田小波(1989-),男,博士,讲师,主要从事旅游与区域发展研究. E-mail: txbct3@126.com |
收稿日期: 2024-02-21
修回日期: 2024-05-27
网络出版日期: 2026-03-11
基金资助
兰州文理学院博士科研启动经费资助项目(2023QDJ08)
甘肃省高校教师创新基金项目(2024A-197)
甘肃省自然科学基金青年项目(24JRRA955)
Measurement and spatial pattern characteristics of tourism high-quality development level of urbans in the Yellow River Basin
Received date: 2024-02-21
Revised date: 2024-05-27
Online published: 2026-03-11
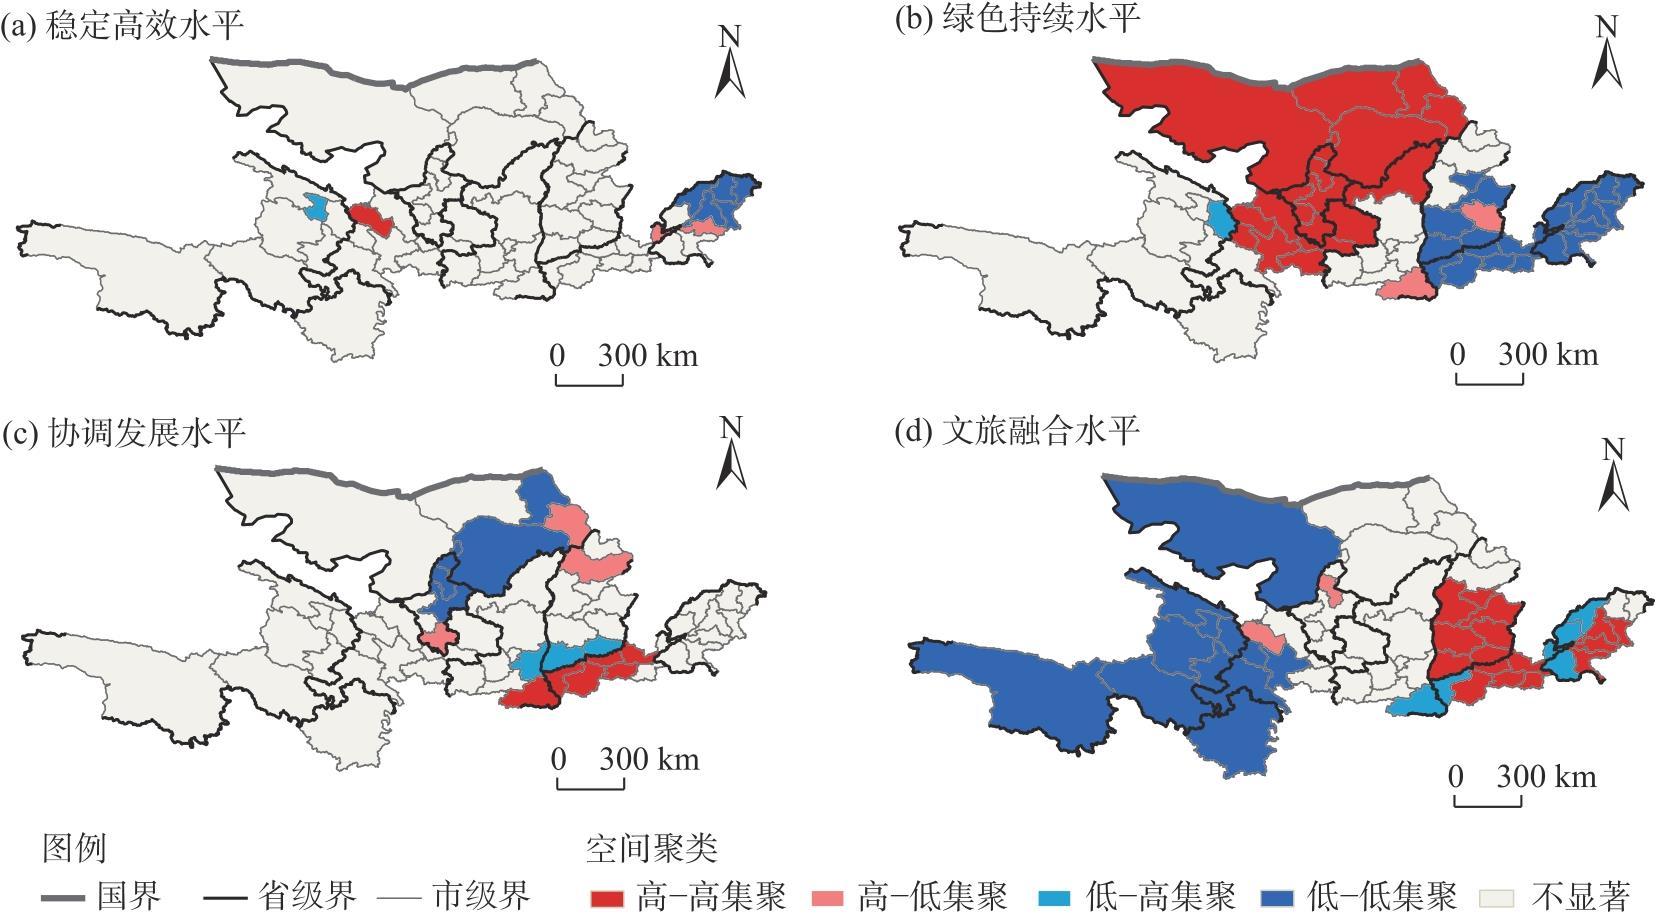
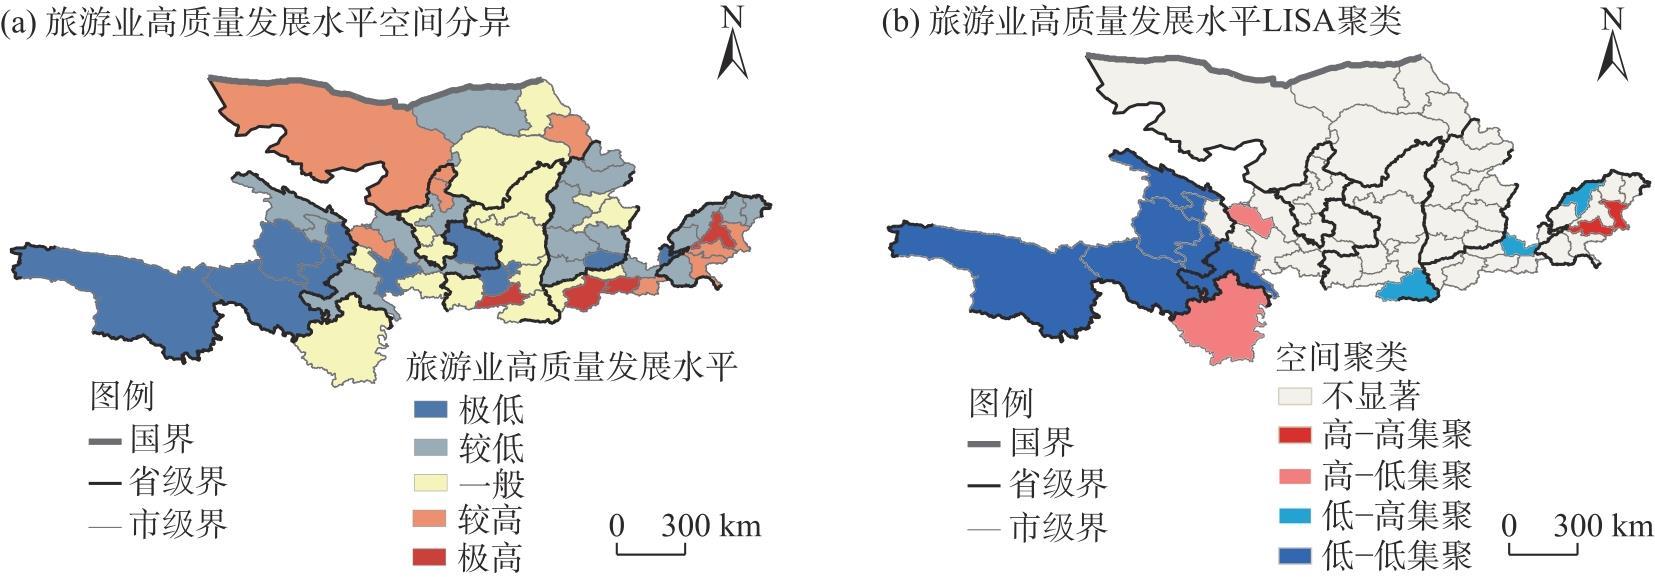
旅游业高质量发展是当前和今后更长时期我国旅游业发展的核心主题,准确把握旅游业高质量发展的内涵特征,科学测度旅游业高质量发展水平,是探寻其发展路径的基础。基于旅游基本属性和新发展理念构建了旅游业高质量发展水平评价指标体系,运用熵值法、探索性空间分析等方法测度并探讨了2019年黄河流域旅游业高质量发展水平及空间格局特征。 结果表明:(1) 分维度上,黄河流域旅游业高质量发展水平整体偏低,高值区占比在11%~40%之间,低值区占比在30%~72%之间,平稳高效、公平共享及创新驱动等分维度高值区占比低于10%;综合维度上,黄河流域各城市旅游业高质量发展水平整体偏低,中低水平占比71.67%,高值区占比28.33%。(2) 分维度和综合维度均存在显著的空间分异特征,综合维度上旅游业高质量发展水平整体由下游向上游梯级递减;分维度上稳定高效水平呈现西高、中低、东居中的特点,绿色持续水平呈现上中游高、下游低的特点,其余各维度的分异趋势与综合维度相同。(3) 稳定高效、绿色持续、协调发展、文旅融合等评价维度和综合维度存在显著的空间依赖效应,分维度、综合维度的空间集聚特征各不相同,但均呈现出高值、低值分异集聚的“空间极化”特征。
田小波 . 黄河流域城市旅游业高质量发展水平测度与空间格局特征[J]. 干旱区地理, 2025 , 48(9) : 1660 -1671 . DOI: 10.12118/j.issn.1000-6060.2024.103
The high-quality development of tourism is the core theme of China’s tourism development during the current period and the longer-term future. Thus, an accurate grasp of the connotation and characteristics of high-quality development of tourism and scientific measurement of the high-quality development level of tourism must form the basis for the exploration of its development path. Drawing on the essential attributes of tourism and the new development concept, this paper constructs an evaluation index system for the high-quality development of tourism and uses the entropy value method and exploratory spatial analysis to measure the high-quality development of tourism and the characteristics of spatial patterns in the Yellow River Basin that were prevailing in 2019. The study shows the following results: (1) In terms of subdimensions, the overall level of high-quality development of the tourism industry in the Yellow River Basin is low, with the proportion of high-value zones ranging from 11% to 40%, the proportion of low-value zones ranging from 30% to 72%, and the proportion of high-value zones in the subdimensions of smoothness-efficient, fairness-shared, and innovation-driven being less than 10%. In terms of comprehensiveness, the high-quality level of development of the tourism industry in the cities of the Yellow River Basin is relatively low, with a low to medium level accounting for 71.67% and a high-value area of 28.33%. (2) There are significant features of spatial differentiation in both the subdimension and the composite dimension. In the composite dimension, the high-quality development level of the tourism industry as a whole decreases from the downstream to the upstream gradient; in the subdimension, the stable and efficient levels are high in the west, low in the middle, and medium in the east; the levels of green and sustainable are high upstream, medium in the middle, and low downstream and, finally, the trend of the differentiation across the remaining dimensions is the same as those of the composite dimension. (3) There is a significant spatial dependence effect in the dimensions stable and efficient, green and sustainable, coordinated development, culture and tourism integration, and comprehensive. The spatial agglomeration characteristics of the subdimension and the comprehensive dimension differ. However, all characteristics exhibit spatial polarization featuring high- and low-value differentiated agglomeration.
表1 旅游业高质量发展评价指标体系Tab. 1 Evaluation index system of tourism high-quality development |
| 评价维度 | 准则层 | 指标层(代码) | 指标属性 | 指标计算 |
|---|---|---|---|---|
| 稳定高效 | 稳定性 | 近5 a旅游收入增长波动(X1) | 负向 | 旅游总收入增长率变动的绝对值 |
| 效率水平 | 旅游业全员劳动生产率(X2) | 正向 | 旅游业总收入与旅游业从业人员的比值 | |
| 公平共享 | 公平发展 | 居民旅游收入弹性(X3) | 正向 | 当地居民收入增长率与当地旅游收入增长率的比值 |
| 社会效益 | 免费开放的博物馆数量(X4) | 正向 | 直接获取 | |
| 建成区公园绿地面积(X5) | 正向 | 直接获取 | ||
| 绿色持续 | 资源消耗 | 单位旅游收入能耗(X6) | 负向 | 能源消费总量与地区旅游综合收入的比值 |
| 环境治理 | 空气优良天数(X7) | 正向 | 直接获取 | |
| 生态保护 | 建成区绿化覆盖率(X8) | 正向 | 直接获取 | |
| 创新驱动 | 创新投入 | 旅游业研发经费投入(X9) | 正向 | 全社会研发经费数额乘以旅游业产值占经济生产总值的比值 |
| 旅游业研发人员数量(X10) | 正向 | 全社会研发人员数乘以旅游业从业人员占地区就业总 人数的比值 | ||
| 创新产出 | 旅游业科技专利发明数量(X11) | 正向 | 通过Innojoy专利搜索引擎检索整理 | |
| 旅游学术论文发表(X12) | 正向 | 在CNKI以“旅游”为主题,“地区”为作者机构检索获取 | ||
| 协调发展 | 产业结构协调度 | 旅游产业结构合理化(X13) | 正向 | K=(eij/ej)/(Ei/E) |
| 文旅融合 | 文旅产业融合发展水平 | 文旅产业耦合协调度(X14) | 正向 | 耦合协调度模型 |
注:K为旅游产业结构合理化水平;eij为第j个城市旅游总收入;ej为第j个城市生产总值;Ei为甘肃省旅游总收入;E为甘肃省生产总值。 |
表2 黄河流域城市旅游业高质量发展水平测度结果Tab. 2 Measurement results of tourism high-quality development level of urbans in the Yellow River Basin |
| 市(州/盟) | 稳定高效水平 | 公平共享水平 | 绿色持续水平 | 创新驱动水平 | 协调发展水平 | 文旅融合水平 | 旅游业高质量发展水平 |
|---|---|---|---|---|---|---|---|
| 西宁市 | 4.70 | 7.44 | 21.12 | 1.42 | 4.38 | 5.65 | 44.71 |
| 海东市 | 6.37 | 2.46 | 17.59 | 0.37 | 1.93 | 3.40 | 32.13 |
| 海北州 | 17.74 | 2.68 | 14.61 | 0.11 | 7.76 | 1.87 | 44.77 |
| 黄南州 | 8.40 | 5.39 | 15.58 | 0.03 | 3.49 | 0.85 | 33.74 |
| 海南州 | 16.76 | 0.16 | 17.35 | 0.08 | 3.18 | 1.53 | 39.06 |
| 果洛州 | 5.08 | 6.08 | 18.35 | 0.02 | 0.29 | 0.16 | 29.98 |
| 玉树州 | 6.45 | 3.46 | 25.91 | 0.04 | 2.08 | 0.70 | 38.64 |
| 阿坝州 | 5.62 | 2.39 | 25.33 | 0.83 | 13.08 | 5.43 | 52.67 |
| 兰州市 | 9.41 | 7.51 | 19.49 | 17.84 | 2.25 | 8.56 | 65.06 |
| 白银市 | 13.46 | 3.50 | 24.04 | 0.76 | 1.68 | 3.78 | 47.23 |
| 天水市 | 10.61 | 5.57 | 25.46 | 2.63 | 4.64 | 6.16 | 55.07 |
| 平凉市 | 11.01 | 3.04 | 25.11 | 0.40 | 3.51 | 4.82 | 47.89 |
| 庆阳市 | 7.77 | 2.99 | 22.63 | 0.36 | 0.27 | 4.51 | 38.53 |
| 定西市 | 10.09 | 2.75 | 21.86 | 0.23 | 0.56 | 4.53 | 40.03 |
| 临夏州 | 16.04 | 1.83 | 22.24 | 0.33 | 4.18 | 5.09 | 49.70 |
| 甘南州 | 8.66 | 6.70 | 25.24 | 0.23 | 3.05 | 4.96 | 48.83 |
| 银川市 | 4.99 | 10.61 | 29.49 | 2.58 | 2.39 | 8.99 | 59.05 |
| 石嘴山市 | 2.70 | 15.25 | 37.23 | 0.62 | 0.63 | 3.83 | 60.25 |
| 吴忠市 | 8.99 | 3.67 | 26.70 | 0.52 | 2.84 | 4.58 | 47.30 |
| 固原市 | 12.36 | 8.45 | 25.80 | 0.57 | 4.57 | 4.47 | 56.23 |
| 中卫市 | 9.69 | 8.74 | 29.42 | 0.56 | 3.86 | 4.29 | 56.56 |
| 呼和浩特市 | 9.04 | 13.01 | 21.61 | 3.56 | 4.01 | 8.61 | 59.83 |
| 包头市 | 9.48 | 6.45 | 25.83 | 1.01 | 2.14 | 6.27 | 51.16 |
| 乌海市 | 11.09 | 4.76 | 24.31 | 0.12 | 1.08 | 3.12 | 44.49 |
| 鄂尔多斯市 | 9.79 | 5.16 | 26.32 | 0.69 | 0.99 | 8.67 | 51.61 |
| 巴彦淖尔市 | 9.52 | 7.27 | 22.06 | 0.17 | 0.33 | 4.47 | 43.83 |
| 阿拉善盟 | 20.87 | 4.19 | 22.87 | 0.35 | 8.43 | 4.01 | 60.72 |
| 太原市 | 6.32 | 13.37 | 16.91 | 6.93 | 1.34 | 10.03 | 54.90 |
| 长治市 | 7.91 | 8.03 | 19.56 | 1.56 | 2.30 | 7.75 | 47.10 |
| 晋城市 | 8.67 | 6.59 | 15.10 | 0.94 | 2.84 | 6.31 | 40.46 |
| 朔州市 | 9.16 | 5.77 | 20.05 | 0.37 | 1.39 | 4.88 | 41.62 |
| 晋中市 | 10.16 | 9.42 | 14.82 | 1.91 | 5.29 | 8.22 | 49.81 |
| 运城市 | 10.22 | 9.06 | 13.62 | 2.33 | 3.15 | 7.79 | 46.17 |
| 忻州市 | 9.15 | 6.05 | 18.06 | 1.35 | 3.78 | 6.65 | 45.05 |
| 临汾市 | 10.75 | 7.24 | 11.70 | 1.22 | 3.12 | 7.64 | 41.67 |
| 吕梁市 | 10.20 | 6.35 | 20.84 | 0.74 | 2.12 | 6.61 | 46.84 |
| 西安市 | 12.44 | 29.84 | 15.59 | 30.76 | 3.41 | 14.48 | 106.52 |
| 铜川市 | 7.00 | 5.04 | 18.87 | 1.22 | 4.94 | 3.74 | 40.81 |
| 宝鸡市 | 10.26 | 8.99 | 19.98 | 3.76 | 4.46 | 7.67 | 55.11 |
| 咸阳市 | 4.56 | 7.45 | 11.43 | 2.62 | 1.88 | 6.51 | 34.45 |
| 渭南市 | 6.17 | 17.22 | 13.93 | 4.73 | 3.40 | 5.20 | 50.66 |
| 延安市 | 9.76 | 6.73 | 24.04 | 3.49 | 2.90 | 6.91 | 53.84 |
| 榆林市 | 8.45 | 17.11 | 21.83 | 1.61 | 0.12 | 6.02 | 55.14 |
| 商洛市 | 7.97 | 8.35 | 22.68 | 3.06 | 4.88 | 4.78 | 51.72 |
| 郑州市 | 4.39 | 25.85 | 14.13 | 33.84 | 6.16 | 13.29 | 97.66 |
| 开封市 | 14.59 | 11.03 | 15.51 | 5.66 | 14.48 | 7.95 | 69.22 |
| 洛阳市 | 9.11 | 21.12 | 11.85 | 19.07 | 12.48 | 11.97 | 85.61 |
| 新乡市 | 7.61 | 6.79 | 14.34 | 5.48 | 5.50 | 7.02 | 46.75 |
| 焦作市 | 8.50 | 13.14 | 12.73 | 5.18 | 7.99 | 6.48 | 54.01 |
| 濮阳市 | 12.98 | 4.08 | 16.34 | 0.71 | 0.43 | 5.29 | 39.83 |
| 三门峡市 | 11.00 | 7.43 | 15.39 | 4.14 | 14.38 | 5.87 | 58.20 |
| 济南市 | 5.01 | 24.61 | 15.23 | 46.08 | 2.23 | 11.21 | 104.38 |
| 淄博市 | 6.15 | 20.82 | 15.07 | 13.73 | 3.98 | 9.05 | 68.79 |
| 东营市 | 4.66 | 12.27 | 16.52 | 4.37 | 0.75 | 5.73 | 44.30 |
| 济宁市 | 6.74 | 19.04 | 13.35 | 10.02 | 3.67 | 9.48 | 62.30 |
| 泰安市 | 9.12 | 16.77 | 15.08 | 13.33 | 6.74 | 8.20 | 69.24 |
| 德州市 | 4.23 | 12.53 | 14.25 | 5.56 | 0.85 | 6.08 | 43.49 |
| 聊城市 | 6.27 | 11.93 | 13.89 | 4.82 | 1.57 | 5.65 | 44.13 |
| 滨州市 | 5.60 | 12.20 | 18.01 | 4.37 | 0.96 | 6.04 | 47.17 |
| 菏泽市 | 6.97 | 14.11 | 14.28 | 2.14 | 0.62 | 6.07 | 44.18 |
注:海北州、黄南州、海南州、果洛州、玉树州、阿坝州、临夏州、甘南州分别是海北藏族自治州、黄南藏族自治州、海南藏族自治州、果洛藏族自治州、玉树藏族自治州、阿坝藏族羌族自治州、临夏回族自治州、甘南藏族自治州的简称。 |
图2 分维度旅游业高质量发展水平空间格局Fig. 2 Spatial pattern of sub-dimensional tourism high-quality development level |
表3 不同维度下旅游业高质量发展的全局莫兰指数(Moran’s I)得分Tab. 3 Global Moran’s I scores for tourism high-quality development in different dimensions |
| 评价维度 | 全局Moran’s I | P值 | Z值 | 分布状态 | |
|---|---|---|---|---|---|
| 分维度 | 稳定高效 | 0.0922 | 0.0005 | 3.4602 | 集聚 |
| 公平共享 | 0.0330 | 0.1227 | 1.5432 | 随机 | |
| 绿色持续 | 0.4595 | 0.0000 | 13.7576 | 集聚 | |
| 创新驱动 | -0.0157 | 0.9625 | 0.0470 | 随机 | |
| 协调发展 | 0.0844 | 0.0042 | 2.8591 | 集聚 | |
| 文旅融合 | 0.1872 | 0.0000 | 5.4028 | 集聚 | |
| 综合维度 | 0.1096 | 0.0006 | 3.3976 | 集聚 | |
注:P值表示在零假设(空间随机分布)下,出现当前Moran’s I的概率;Z值表示Moran’s I偏离零假设的程度,以标准差为单位。 |
| [1] |
杨永春, 穆焱杰, 张薇. 黄河流域高质量发展的基本条件与核心策略[J]. 资源科学, 2020, 42(3): 409-423.
[
|
| [2] |
方创琳. 黄河流域城市群形成发育的空间组织格局与高质量发展[J]. 经济地理, 2020, 40(6): 1-8.
[
|
| [3] |
马海涛, 徐楦钫. 黄河流域城市群高质量发展评估与空间格局分异[J]. 经济地理, 2020, 40(4): 11-18.
[
|
| [4] |
陆大道, 孙东琪. 黄河流域的综合治理与可持续发展[J]. 地理学报, 2019, 74(12): 2431-2436.
[
|
| [5] |
李小建, 文玉钊, 李元征, 等. 黄河流域高质量发展:人地协调与空间协调[J]. 经济地理, 2020, 40(4): 1-10.
[
|
| [6] |
李达, 林龙圳, 林震, 等. 黄河流域生态保护和高质量发展的EKC检验[J]. 生态学报, 2021, 41(10): 3965-3974.
[
|
| [7] |
石培华, 翟燕霞. 文旅融合视野下文物保护利用与创新路径研究——以黄河流域为例[J]. 广西师范大学学报(哲学社会科学版), 2021, 57(4): 114-128.
[
|
| [8] |
樊杰, 王亚飞, 王怡轩. 基于地理单元的区域高质量发展研究——兼论黄河流域同长江流域发展的条件差异及重点[J]. 经济地理, 2020, 40(1): 1-11.
[
|
| [9] |
张朝枝, 杨继荣. 基于可持续发展理论的旅游高质量发展分析框架[J]. 华中师范大学学报(自然科学版), 2022, 56(1): 43-50.
[
|
| [10] |
于法稳, 黄鑫, 岳会. 乡村旅游高质量发展:内涵特征、关键问题及对策建议[J]. 中国农村经济, 2020(8): 27-39.
[
|
| [11] |
何建民. 新时代我国旅游业高质量发展系统与战略研究[J]. 旅游学刊, 2018, 33(10): 9-11.
[
|
| [12] |
阎友兵, 胡欢欢. 中国旅游业高质量发展水平的测度及时空演化分析[J]. 湖南财政经济学院学报, 2021, 37(1): 5-18.
[
|
| [13] |
马慧强, 燕明琪, 李岚, 等. 我国旅游公共服务质量时空演化及形成机理分析[J]. 经济地理, 2018, 38(3): 190-199.
[
|
| [14] |
刘雨婧, 唐健雄. 长江经济带旅游业发展质量评价及其时空演变[J]. 经济地理, 2022, 42(4): 209-219.
[
|
| [15] |
田小波, 胡静, 贾垚焱, 等. 高质量发展阶段旅游业发展水平空间分异成因探测——基于因素分解的黄河流域实证[J]. 干旱区地理, 2023, 46(3): 460-470.
[
|
| [16] |
时朋飞, 曹钰晗, 龙荟冰, 等. 我国旅游业高质量发展水平测度、空间分异及障碍因子诊断[J]. 经济地理, 2023, 43(2): 201-210.
[
|
| [17] |
张洪昌. 新时代旅游业高质量发展的治理逻辑与制度创新[J]. 当代经济管理, 2019, 41(9): 60-66.
[
|
| [18] |
唐任伍, 徐道明. 新时代高质量旅游业发展的动力和路径[J]. 旅游学刊, 2018, 33(10): 11-13.
[
|
| [19] |
王雄青, 胡长生. 文旅融合背景下红色文化旅游高质量发展路径研究——基于江西的视角[J]. 企业经济, 2020, 39(11): 100-107.
[
|
| [20] |
宋子千. 科技引领“十四五”旅游业高质量发展[J]. 旅游学刊, 2020, 35(6): 10-12.
[
|
| [21] |
张新成, 梁学成, 宋晓, 等. 黄河流域旅游产业高质量发展的失配度时空格局及成因分析[J]. 干旱区资源与环境, 2020, 34(12): 201-208.
[
|
| [22] |
李冬花, 张晓瑶, 陆林, 等. 黄河流域高级别旅游景区空间分布特征及影响因素[J]. 经济地理, 2020, 40(5): 70-80.
[
|
| [23] |
王胜鹏, 乔花芳, 冯娟, 等. 黄河流域旅游生态效率时空演化及其与旅游经济互动响应[J]. 经济地理, 2020, 40(5): 81-89.
[
|
| [24] |
李丽, 徐佳. 中国文旅产业融合发展水平测度及其驱动因素分析[J]. 统计与决策, 2020, 36(20): 49-52.
[
|
| [25] |
殷为华, 刘楠楠, 鲁飞宇. 长江经济带文旅产业融合发展水平测度及空间演化研究[J]. 世界地理研究, 2022, 31(5): 1009-1020.
[
|
| [26] |
曹诗图, 郑宇飞, 黄其新. 基于旅游属性与本质的中国旅游起源探析[J]. 地理与地理信息科学, 2013, 29(6): 95-99.
[
|
| [27] |
李天元. 旅游学概论[M]. 第七版. 天津: 南开大学出版社, 2014.
[
|
| [28] |
马慧强, 廉倩文, 论宇超, 等. 基于BP神经网络的旅游经济系统脆弱性省际空间分异[J]. 资源科学, 2019, 41(12): 2248-2261.
[
|
| [29] |
胡静, 贾垚焱, 谢鸿璟. 旅游业高质量发展的核心要义与推进方向[J]. 华中师范大学学报(自然科学版), 2019, 9(4): 1-11.
[
|
| [30] |
宋志伟, 刘鲁, 郭秋琪, 等. 中国旅游高质量发展与社会福祉——2020《旅游学刊》中国旅游研究年会会议综述[J]. 旅游学刊, 2020, 35(12): 136-141.
[
|
| [31] |
石燕, 詹国辉. 文旅融合高质量发展的指数建构、影响因素与提升策略——以江苏为例[J]. 南京社会科学, 2021(7): 165-172.
[
|
| [32] |
任保平, 文丰安. 新时代中国高质量发展的判断标准、决定因素与实现途径[J]. 改革, 2018(4): 5-16.
[
|
| [33] |
刘晓静, 梁留科. 旅游社会公平及其评价指标体系研究[J]. 武汉科技大学学报(社会科学版), 2015, 17(4): 438-443.
[
|
/
| 〈 |
|
〉 |