
|
韩宇晨(2000-),女,硕士研究生,主要从事干旱区绿洲动态监测研究. E-mail: 12222038@stu.lzjtu.edu.cn |
收稿日期: 2024-12-08
修回日期: 2025-02-16
网络出版日期: 2026-03-11
基金资助
国家自然科学基金面上项目(42271214)
甘肃省科技计划(23ZDKA0004)
甘肃省青年科技基金(25JRRA209)
兰州市科技计划项目(2024-3-93)
Spatial synergistic evolution of oasis and oasis cities in arid zones in the process of urbanization and analysis of their patterns
Received date: 2024-12-08
Revised date: 2025-02-16
Online published: 2026-03-11
韩宇晨 , 孙钦珂 , 周亮 , 李宇昂 . 城镇化过程中干旱区绿洲与绿洲城市空间协同演变及其模式分析[J]. 干旱区地理, 2025 , 48(8) : 1469 -1479 . DOI: 10.12118/j.issn.1000-6060.2024.746
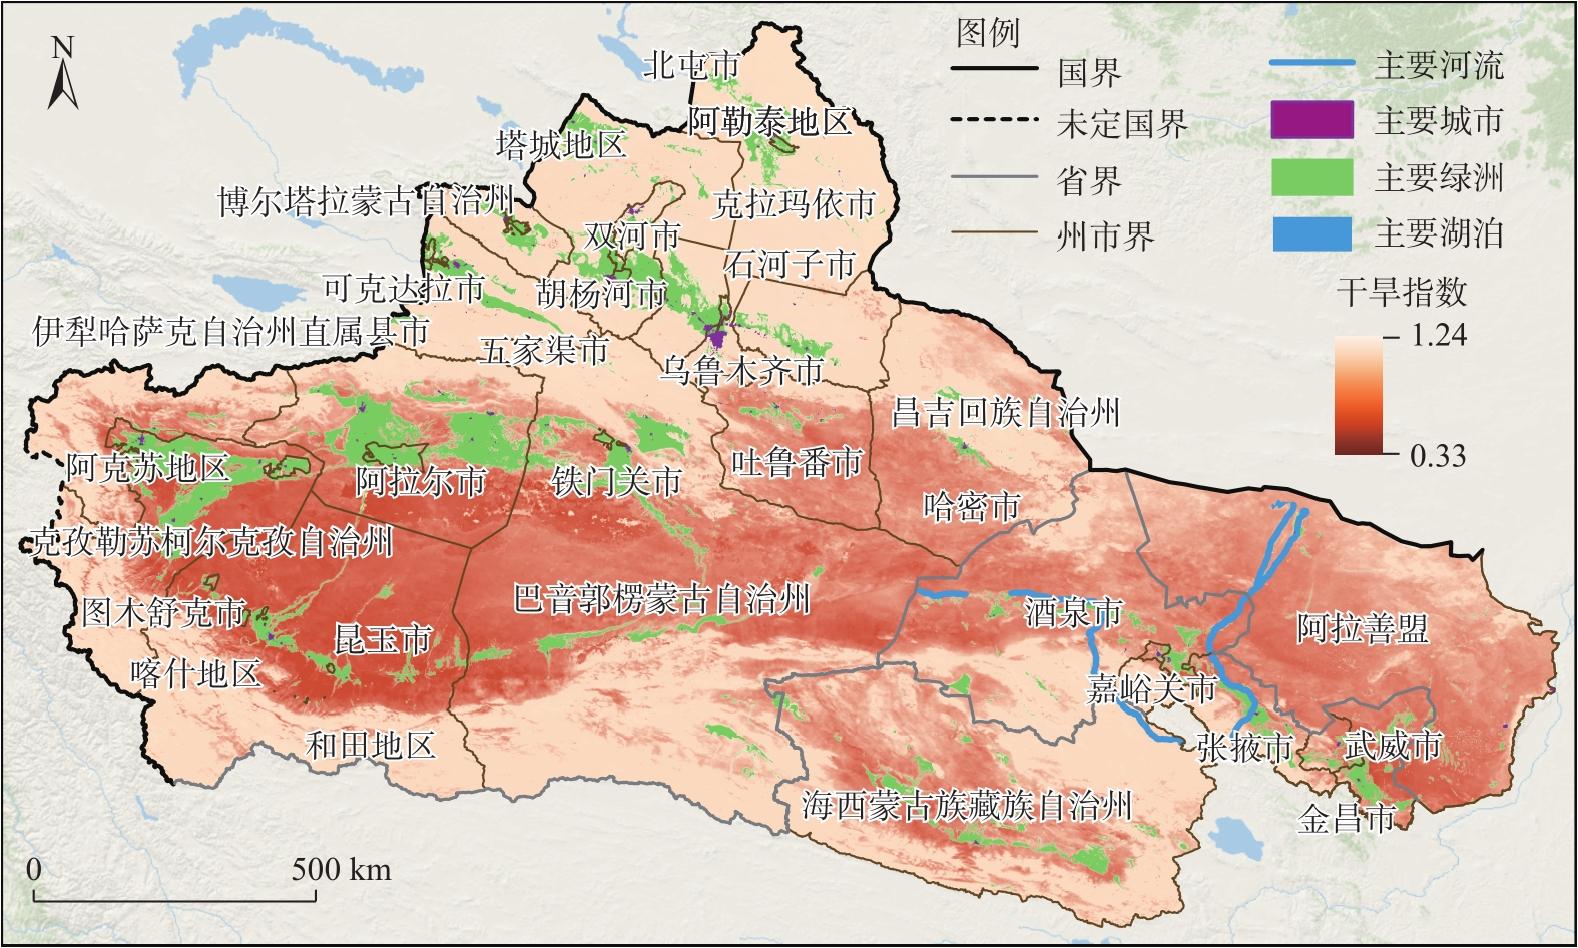
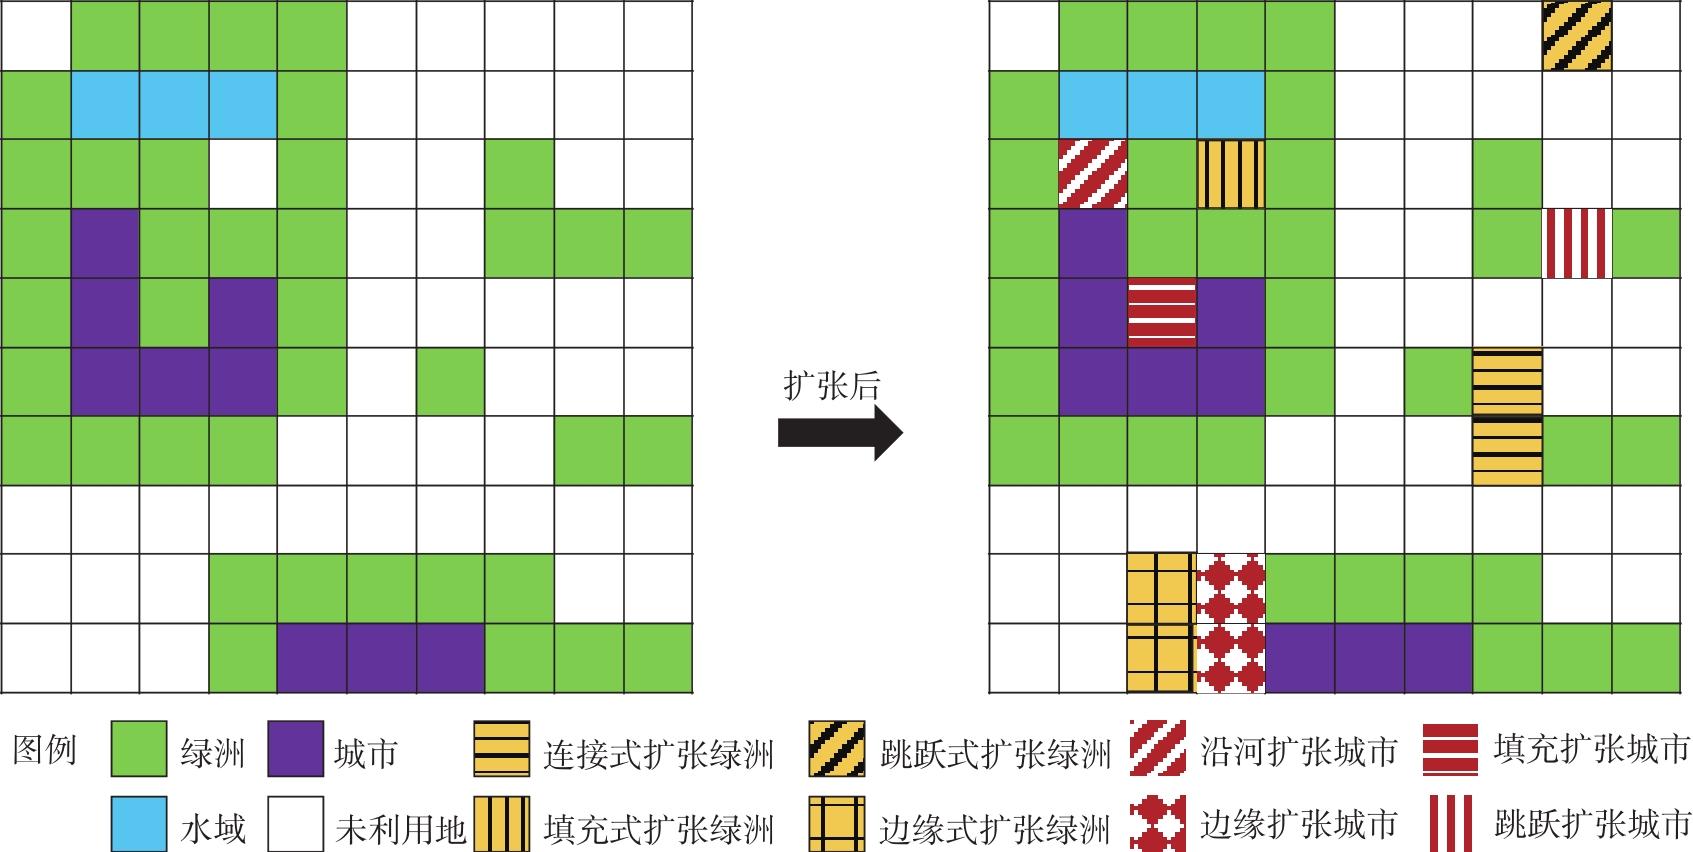
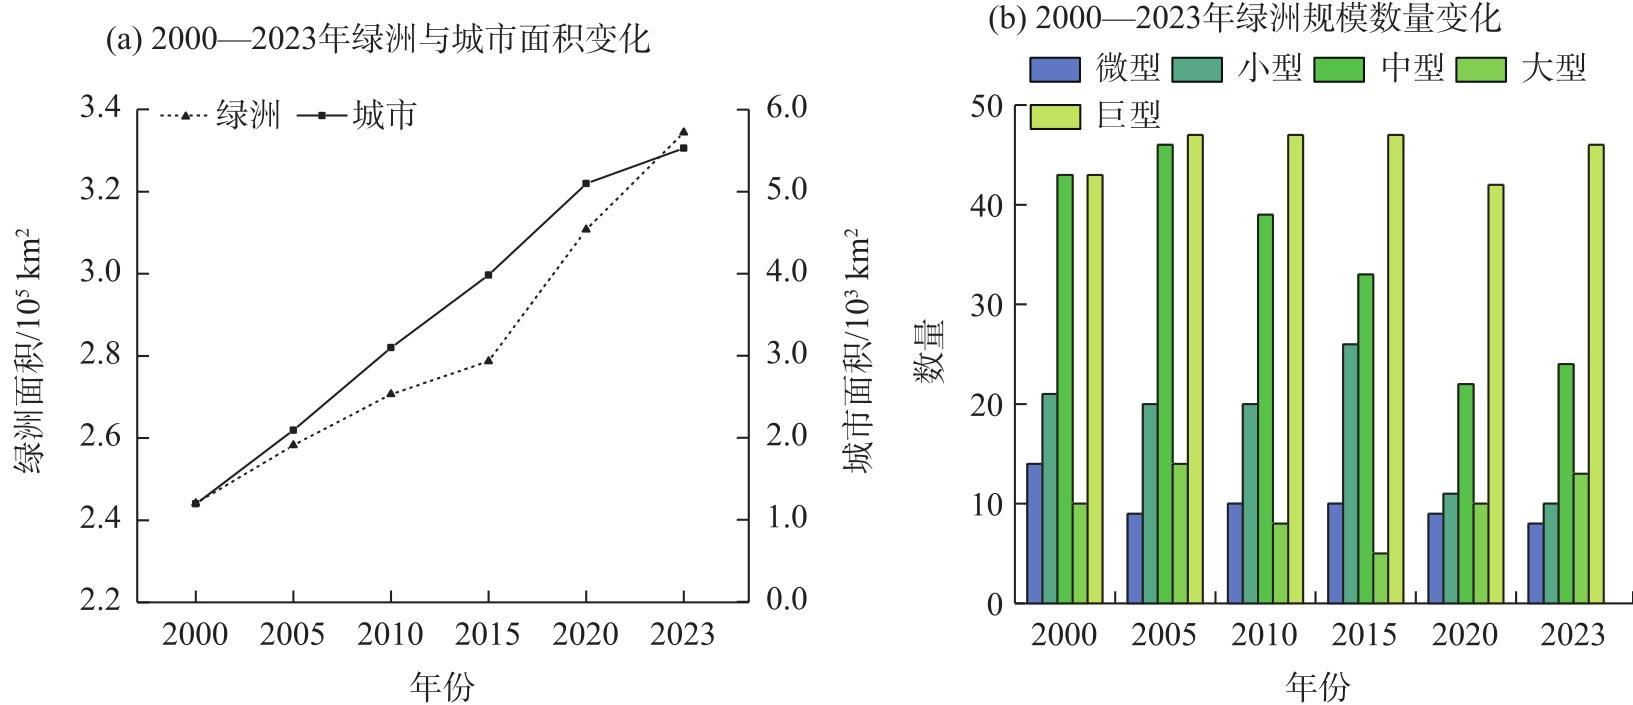
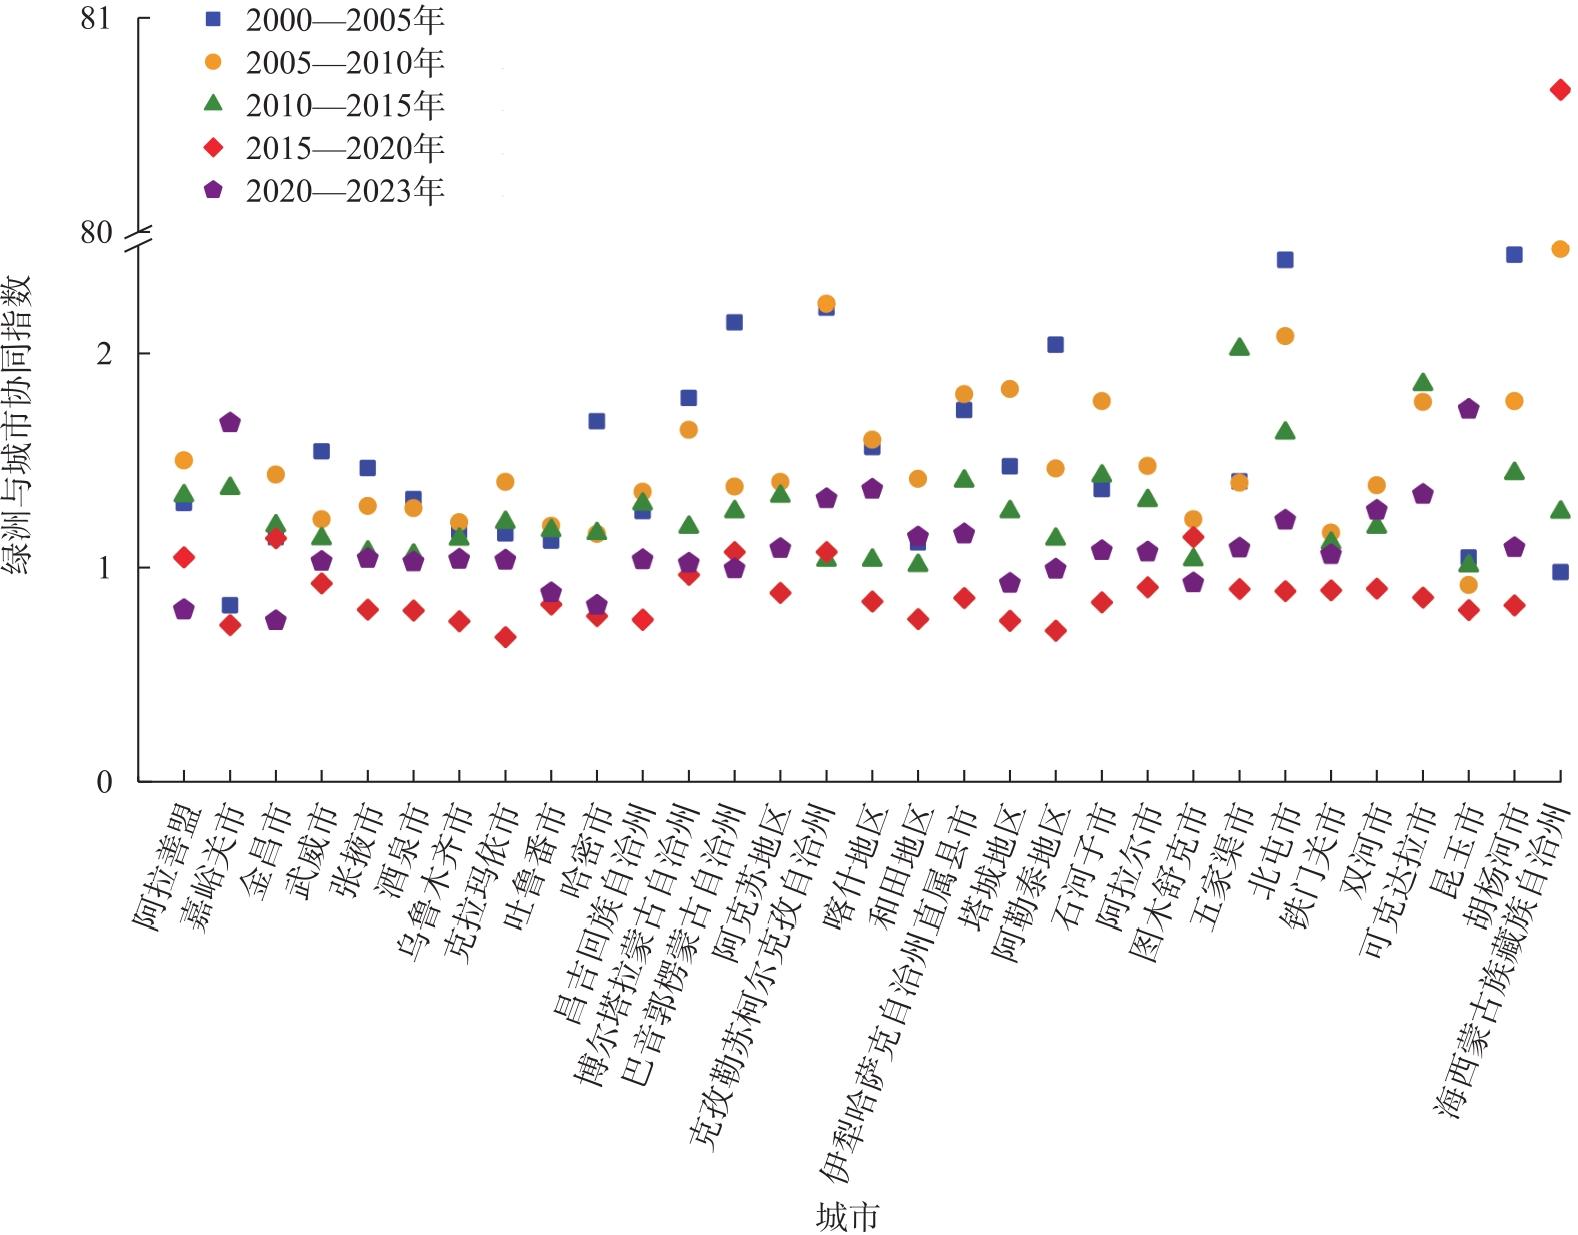
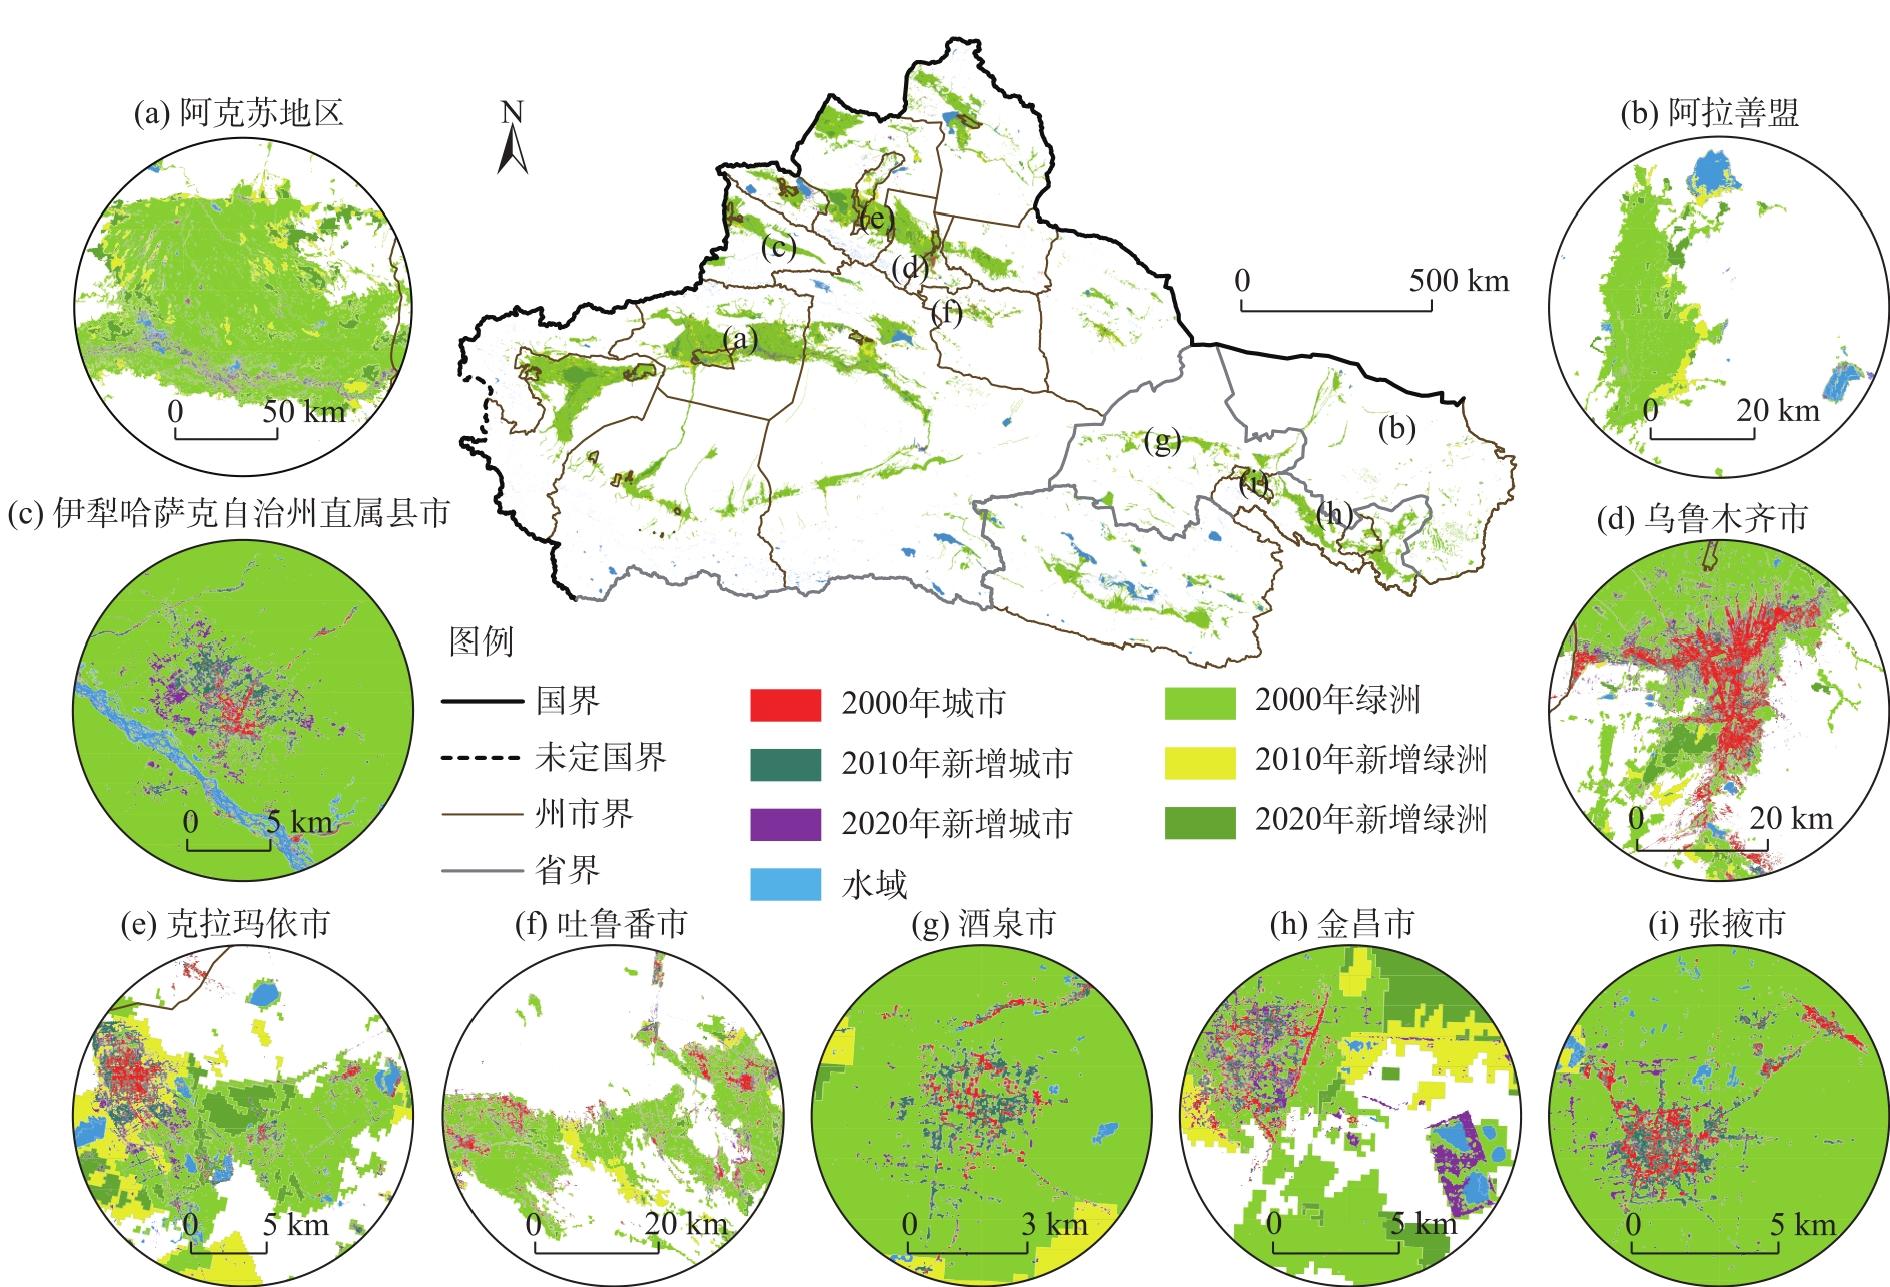
As the core spatial units of oasis systems—hosting concentrated population functions, economic activities, and public services—the expansion of oasis cities is constrained by ecological patterns while simultaneously driving oasis evolution. Systematically identifying the spatial-temporal evolution of oasis and oasis cities is fundamental for coordinating ecological protection and spatial development in arid zones. This study delineates the spatial distribution of oasis in northwest China from 2000 to 2023 using evapotranspiration and the normalized difference vegetation index, while urban expansion data are extracted from the annual China land cover dataset. A synergy assessment is conducted by constructing an oasis and city synergy index (OCSI) to quantify the coordination between oasis and urban expansion across 31 typical oasis cities. Further, the impacts of various urban expansion patterns on oasis landscape structures are classified. The findings reveal that: (1) From 2000 to 2023, oasis areas increased by 0.90×10⁵ km2, representing a 36.89% expansion. Concurrently, the number of oasis patches declined from 135 to 101, indicating a trend toward larger and more consolidated oasis, mainly through edge expansion and infilling. Urban areas expanded by 4.34×10³ km2—a 361.60% increase—outpacing oasis growth. Urban spatial expansion was categorized into four patterns: Infilling, edge expansion, leapfrogging, and river-dependent expansion. (2) OCSI analysis indicates that the urban and oasis expansion rates were similar in 8 cities, while critical disparities existed in the remaining 23. Terrain complexity and resource limitations contributed to mismatches, whereas economically developed or well-managed cities exhibited higher synergy levels. (3) Cities dominated by edge or infilling expansion modes displayed higher OCSI values, reflecting stronger spatial synergy with oasis expansion. By contrast, cities characterized by leapfrogging or river-dependent expansion showed low and fluctuating synergy owing to their dispersed spatial patterns or linear development along water bodies. This study elucidates the complex spatial interaction between urban development and oasis evolution in the northwest arid zone. Although these processes are dynamically coupled, coordinated development does not spontaneously occur. Achieving sustainable long-term balance necessitates region-specific strategies to optimize urban and oasis spatial configurations, thereby fostering synergistic evolution and ensuring ecological security and sustainable development in arid regions.
Key words: oasis; oasis city; synergy index; expansion model; arid zone of northwest China
表1 精度验证结果Tab. 1 Accuracy verification results |
| 年份 | 绿洲 | 无绿洲 | 总体精度 | 卡帕系数 | |||
|---|---|---|---|---|---|---|---|
| 生产者精度 | 使用者精度 | 生产者精度 | 使用者精度 | ||||
| 2000 | 83.17 | 80.36 | 98.32 | 98.61 | 97.17 | 0.80 | |
| 2005 | 92.52 | 83.13 | 96.60 | 98.62 | 95.97 | 0.85 | |
| 2010 | 81.88 | 84.45 | 98.61 | 98.33 | 97.19 | 0.82 | |
| 2015 | 87.17 | 92.97 | 97.93 | 96.04 | 95.36 | 0.87 | |
| 2020 | 81.15 | 99.75 | 99.79 | 84.11 | 90.47 | 0.81 | |
表2 不同扩张模式典型城市空间协同特征分级表Tab. 2 Grading table of urban spatial synergy characteristics of typical cities with different expansion patterns |
| 扩张模式 | 典型城市 | 协同趋势类型 | OCSI均值 | 协同度等级 | ΔOCSI | 稳定性等级 | 综合协同度 |
|---|---|---|---|---|---|---|---|
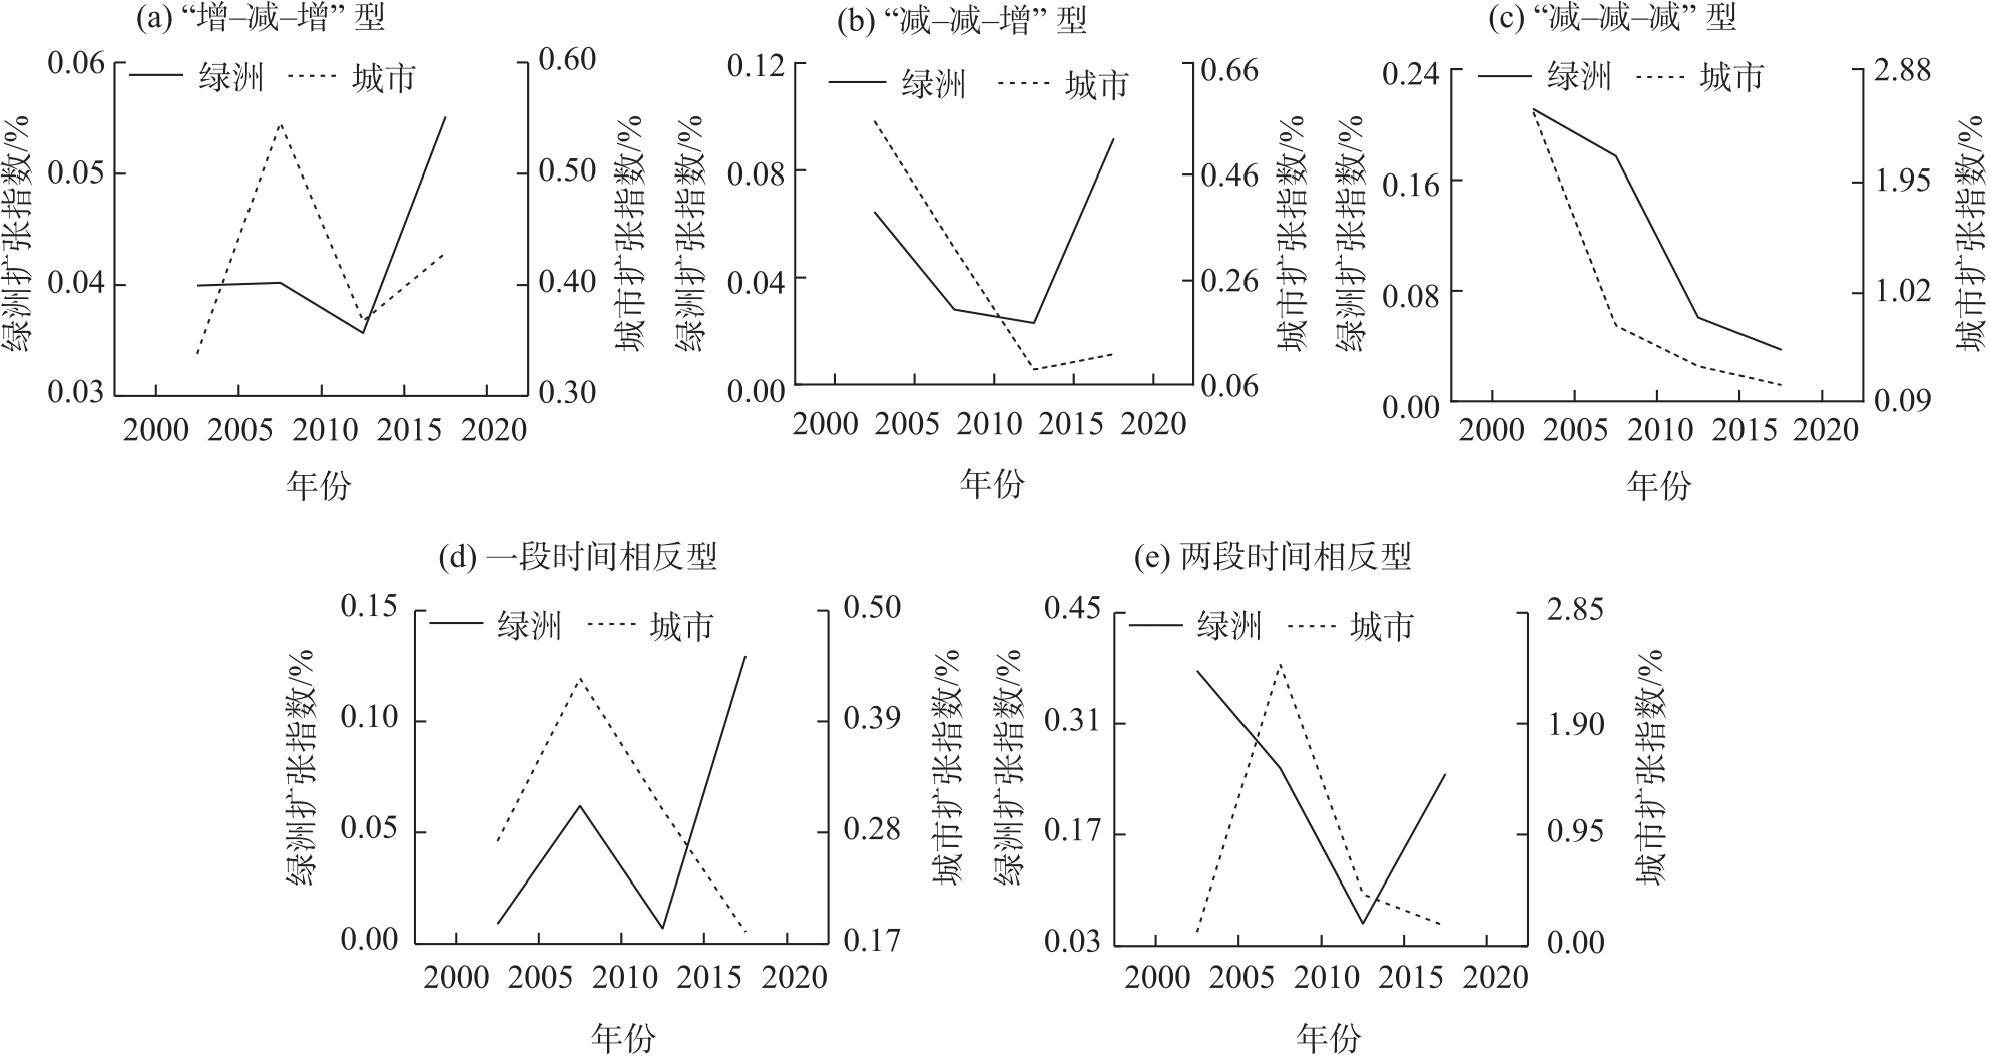
| 沿河扩张 | 伊犁州直 | 趋势相反型 | 1.39 | 低 | 0.96 | 中 | 低协同 |
| 金昌市 | 趋势相反型 | 1.10 | 中 | 0.69 | 中 | ||
| 阿克苏地区 | 趋势相反型 | 1.58 | 低 | 1.67 | 低 | ||
| 填充扩张 | 张掖市 | 趋势相似型 | 1.13 | 中 | 0.66 | 中 | 高协同 |
| 酒泉市 | 趋势相似型 | 1.09 | 高 | 0.52 | 高 | ||
| 吐鲁番市 | 趋势相反型 | 1.03 | 高 | 0.37 | 高 | ||
| 边缘扩张 | 乌鲁木齐市 | 趋势相反型 | 1.05 | 高 | 0.46 | 高 | 高协同 |
| 克拉玛依市 | 趋势相反型 | .09 | 高 | 0.73 | 中 | ||
| 跳跃扩张 | 阿拉善盟 | 趋势相似型 | 1.17 | 中 | 0.70 | 中 | 中协同 |
注:OCSI为绿洲城市协同指数;ΔOCSI为OCSI极差值;伊犁州直为伊犁哈萨克自治州直属县市的简称。 |
| [1] |
|
| [2] |
|
| [3] |
UNFCCC. UN climate change 2023 highlights[R]. Bonn: United Nations Framework Convention on Climate Change Secretariat, 2024.
|
| [4] |
|
| [5] |
|
| [6] |
|
| [7] |
|
| [8] |
|
| [9] |
|
| [10] |
|
| [11] |
刘园园, 马彩虹, 马丽娅. 黄河流域典型绿洲城市扩张模拟及其生态韧性响应研究[J]. 干旱区地理, 2025, 48(3): 506-516.
[
|
| [12] |
桂东伟, 林敬梧, 刘闯. 中国绿洲高精度数据集视频展示[J]. 全球变化数据学报(中英文), 2024, 8(4): 455-460, 583-588.
[
|
| [13] |
冯益明, 卢琦, 姚斌, 等. 河西走廊-塔克拉玛干沙漠边缘阻击战核心区现状、区划及任务[J]. 中国沙漠, 2024, 44(4): 91-101.
[
|
| [14] |
周亮, 朱彦儒, 孙东琪. 河西走廊城乡居民点空间分异特征及绿洲孕育度分析[J]. 干旱区地理, 2020, 43(1): 227-236.
[
|
| [15] |
雷越, 张学斌, 罗君, 等. 基于不同样带的干旱区城市景观格局时空演变特征——以张掖市为例[J]. 生态学报, 2023, 43(5): 2034-2048.
[
|
| [16] |
龚享林, 白永平, 张春悦, 等. 典型“山地-绿洲-荒漠”系统的生态系统服务簇空间分布及其成因分析——以石羊河流域为例[J]. 地理研究, 2025, 44(1): 292-304.
[
|
| [17] |
郭泽呈, 魏伟, 石培基, 等. 中国西北干旱区土地沙漠化敏感性时空格局[J]. 地理学报, 2020, 75(9): 1948-1965.
[
|
| [18] |
马晨, 王宏卫, 谈波, 等. 新疆典型绿洲城乡聚落规模体系特征及空间重构——以渭干河-库车河三角洲绿洲为例[J]. 地理学报, 2022, 77(4): 852-868.
[
|
| [19] |
林金萍, 雷军, 吴世新, 等. 新疆绿洲乡村聚落空间分布特征及其影响因素[J]. 地理研究, 2020, 39(5): 1182-1199.
[
|
| [20] |
侯文兵, 李开明, 黄卓. 近20 a河西地区绿洲效应时空变化特征及归因分析[J]. 干旱区研究, 2023, 40(12): 2031-2042.
[
|
| [21] |
|
| [22] |
|
| [23] |
|
| [24] |
王敏, 胡守庚, 张绪冰, 等. 干旱区绿洲城镇景观生态风险时空变化分析——以张掖绿洲乡镇为例[J]. 生态学报, 2022, 42(14): 5812-5824.
[
|
| [25] |
孙钦珂, 周亮, 唐相龙, 等. 干旱区绿洲城镇扩张对耕地空间影响及预测——以河西走廊区域为例[J]. 自然资源学报, 2021, 36(4): 1008-1020.
[
|
| [26] |
王正伟, 王宏卫, 杨胜天, 等. 基于生态系统服务功能的新疆绿洲生态安全格局识别及优化策略——以拜城县为例[J]. 生态学报, 2022, 42(1): 91-104.
[
|
| [27] |
庄庆威, 吴世新, 罗格平, 等. 新疆绿洲变化与资源配置协调性分析[J]. 干旱区地理, 2020, 43(5): 1298-1306.
[
|
| [28] |
康紫薇, 张正勇, 位宏, 等. 基于土地利用变化的玛纳斯河流域景观生态风险评价[J]. 生态学报, 2020, 40(18): 6472-6485.
[
|
| [29] |
尹慧慧, 毋兆鹏. 干旱区绿洲城市建设用地扩张时空格局变化特征研究[J]. 生态科学, 2023, 42(5): 231-240.
[
|
| [30] |
|
| [31] |
王蓓, 鄢春华, 王月, 等. 中国西北干旱区过度灌溉绿洲的水分收支特征研究[J]. 北京大学学报(自然科学版), 2020, 56(6): 1122-1128.
[
|
| [32] |
|
| [33] |
|
| [34] |
|
| [35] |
何志斌, 李森, 张志山. 中国干旱区绿洲时空分布数据集(2000—2019年)[DB/OL]. [2024-04-21]. http://www.ncdc.ac.cn.
[
|
| [36] |
杜军. 2020s中国西北干旱区绿洲分布数据集[DB/OL]. [2024-04-21]. http://www.ncdc.ac.cn.
[
|
| [37] |
颉耀文, 姜海兰, 林兴周, 等. 1963—2013a间临泽绿洲时空变化过程研究[J]. 干旱区资源与环境, 2014, 28(8): 55-60.
[
|
| [38] |
|
| [39] |
|
/
| 〈 |
|
〉 |