
|
王嘉伟(2000-),男,硕士,主要从事生态系统服务研究. E-mail: 202232909@stumail.nwu.edu.cn |
收稿日期: 2024-11-18
修回日期: 2025-01-26
网络出版日期: 2026-03-11
基金资助
黑河下游额济纳绿洲适宜生态格局研究(AMKJ2023-07)
国家社会科学基金(23&ZD104)
Spatiotemporal evolution characteristics and driving forces of ecosystem services in the Heihe River Basin under the context of ecological water conveyance
Received date: 2024-11-18
Revised date: 2025-01-26
Online published: 2026-03-11
关键词: 生态系统服务; InVEST-PLUS耦合模型; 驱动力研究; 黑河流域
王嘉伟 , 董国涛 , 蒋晓辉 , 聂桐 , 李跃红 . 生态输水背景下黑河流域生态系统服务的时空演变特征及驱动力研究[J]. 干旱区地理, 2025 , 48(8) : 1406 -1420 . DOI: 10.12118/j.issn.1000-6060.2024.590
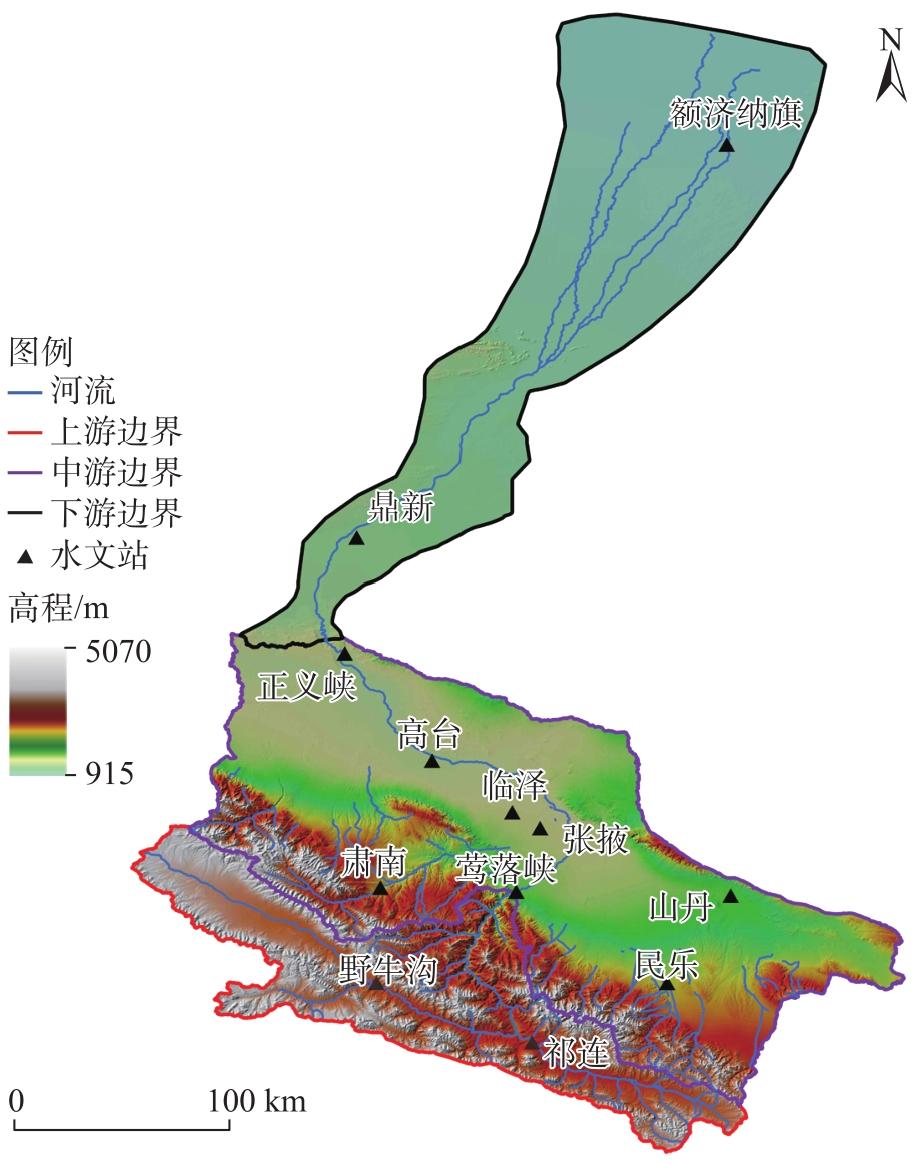
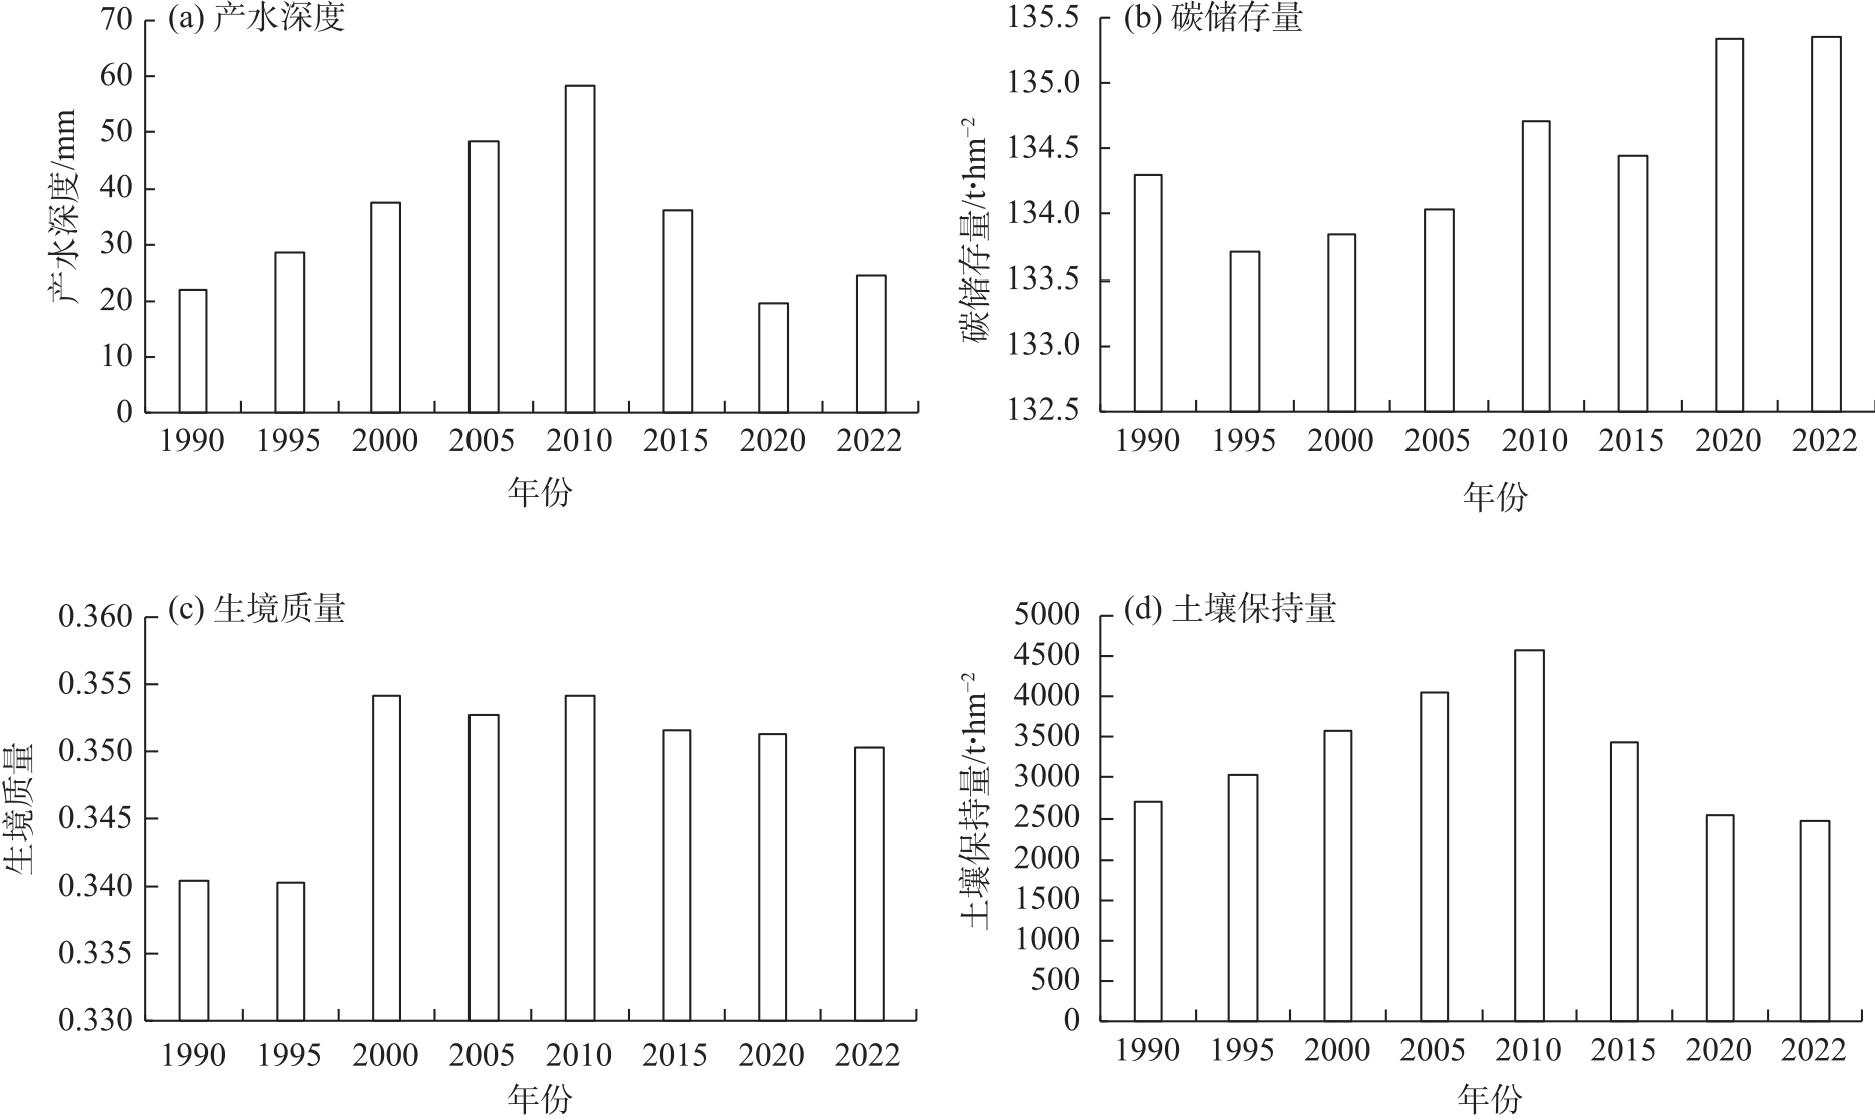
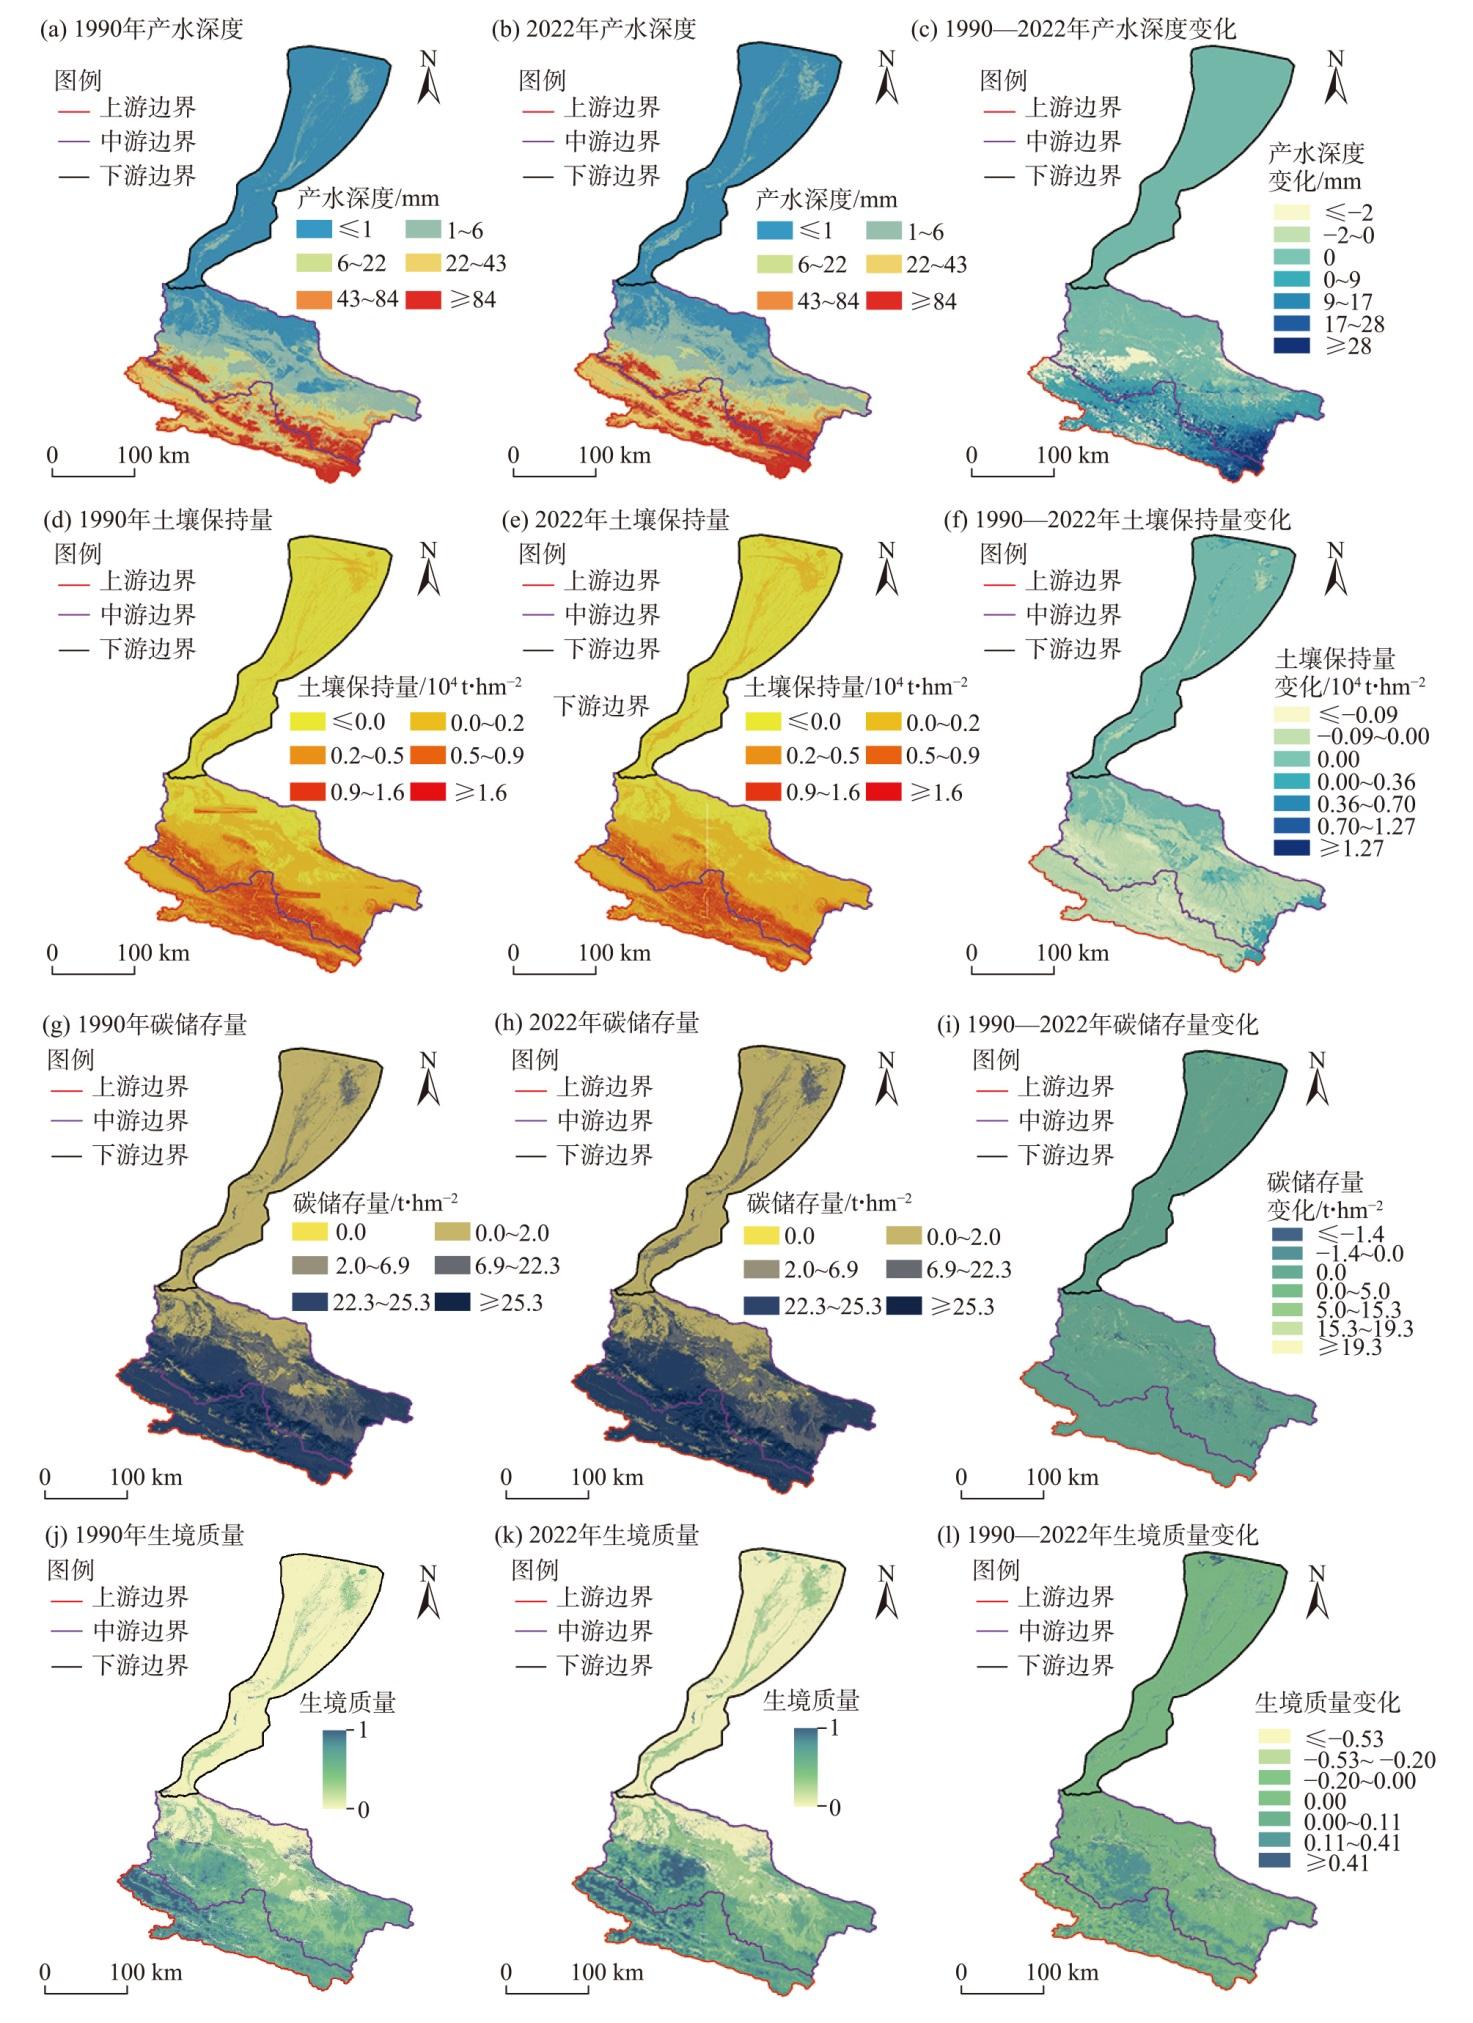
The implementation of ecological water diversion policies in the Heihe River Basin, northwest China has significantly mitigated ecological degradation, leading to marked improvements in environmental quality. However, previous studies examining the spatiotemporal evolution of ecosystem services in this basin have been limited by short timeframes and narrow regional focus. Moreover, most have lacked integrated qualitative and quantitative assessments of the effects of environmental governance policies and other driving forces. This study investigates the spatiotemporal dynamics of water yield depth, habitat quality, carbon storage, and soil conservation from 1990 to 2022 across the Heihe River Basin. The impact of ecological water conveyance on downstream ecosystem services is evaluated by coupling the InVEST-PLUS model, and a geographic detector is employed to identify key driving factors. The findings reveal that: (1) Post-2000, carbon storage and habitat quality showed an overall increasing trend, while water yield depth and soil conservation initially increased and then declined. Spatially, ecosystem services exhibited a stepwise pattern of “higher in the south, lower in the north”, with high values concentrated in the Qilian Mountains and low values in the barren middle and lower reaches. (2) Downstream carbon storage and habitat quality were significantly positively correlated (P<0.05) with annual runoff at Zhengyi Gorge. Under actual scenarios, ecological water conveyance promoted consistent upward trends compared to natural development scenarios. (3) According to the geographic detector, digital elevation model, temperature, precipitation, and potential evapotranspiration were the dominant driving factors. The interactive explanatory power of combined factors surpassed that of individual factors. These results provide a scientific basis for ecological governance and water resource allocation in the Heihe River Basin.
表1 数据分辨率及来源Tab. 1 Data resolution and source |
| 数据类型 | 分辨率 | 数据来源 |
|---|---|---|
| 月均降水量 | 1 km×1 km | 国家青藏高原中心(https://data.tpdc.ac.cn) |
| 月均潜在蒸散发 | 1 km×1 km | 国家青藏高原中心(https://data.tpdc.ac.cn) |
| 月均气温 | 1 km×1 km | 国家青藏高原中心(https://data.tpdc.ac.cn) |
| 土地利用类型 | 30 m×30 m | 地球大数据科学工程数据共享平台(https://data.casearth.cn/) |
| 土壤数据 | 1 km×1 km | 联合国粮农组织(https://www.fao.org/home/en/) |
| 数字高程 | 90 m×90 m | 地理空间数据云(https://www.gscloud.cn/) |
| 根系深度 | 1 km×1 km | Scientific Data-Nature(https://www.nature.com/sdata/) |
| 植被归一化指数 | 30 m×30 m | 科学数据银行(https://www.scidb.cn/en) |
| 人口密度 | 1 km×1 km | 北京树谷信息科技有限公司(https://www.bjsgxxkj.com/) |
| 国内生产总值 | 1 km×1 km | 北京树谷信息科技有限公司(https://www.bjsgxxkj.com/) |
表2 1990—2022年黑河流域生态系统服务Tab. 2 Ecosystem services in the Heihe River Basin from 1990 to 2022 |
| 年份 | 产水深度/mm | 土壤保持量/t·hm-2 | 碳储存量/t·hm-2 | 生境质量 | |||||||||||
|---|---|---|---|---|---|---|---|---|---|---|---|---|---|---|---|
| 上游 | 中游 | 下游 | 上游 | 中游 | 下游 | 上游 | 中游 | 下游 | 上游 | 中游 | 下游 | ||||
| 1990 | 65.57 | 20.02 | 15.53×10⁻⁵ | 7429.93 | 2687.58 | 1.42 | 242.29 | 161.29 | 33.52 | 0.6851 | 0.4088 | 0.0445 | |||
| 1995 | 84.67 | 26.23 | 32.24×10⁻⁵ | 8329.02 | 3025.15 | 1.56 | 242.09 | 160.31 | 33.26 | 0.6892 | 0.4105 | 0.0392 | |||
| 2000 | 112.96 | 33.22 | 6.70×10⁻⁵ | 9934.19 | 3516.55 | 1.27 | 242.46 | 160.25 | 33.55 | 0.6983 | 0.4307 | 0.0468 | |||
| 2005 | 149.34 | 41.58 | 6.40×10⁻⁵ | 11519.35 | 3875.54 | 1.25 | 242.39 | 160.23 | 34.15 | 0.6970 | 0.4271 | 0.0484 | |||
| 2010 | 172.02 | 53.29 | 21.31×10⁻⁵ | 12759.41 | 4484.87 | 1.44 | 242.61 | 161.00 | 34.94 | 0.6959 | 0.4282 | 0.0515 | |||
| 2015 | 109.78 | 31.43 | 5.10×10⁻⁵ | 9655.20 | 3361.11 | 1.26 | 242.01 | 160.78 | 34.82 | 0.6881 | 0.4262 | 0.0512 | |||
| 2020 | 61.88 | 16.85 | 0.88×10⁻⁵ | 7294.06 | 2421.13 | 1.06 | 242.04 | 162.30 | 35.33 | 0.6853 | 0.4254 | 0.0531 | |||
| 2022 | 71.82 | 22.41 | 0.73×10⁻⁵ | 6833.22 | 2451.68 | 1.01 | 242.78 | 162.16 | 35.16 | 0.6854 | 0.4235 | 0.0532 | |||
表3 1990—2022年生态系统服务全局Moran’s I指数Tab. 3 Global Moran’s I index of ecosystem services from 1990 to 2022 |
| 年份 | 产水深度 | 土壤保持量 | 碳储存量 | 生境质量 | |||||||
|---|---|---|---|---|---|---|---|---|---|---|---|
| Iglobal | P值 | Iglobal | P值 | Iglobal | P值 | Iglobal | P值 | ||||
| 1990 | 0.9387 | 0.0000 | 0.9020 | 0.0000 | 0.9648 | 0.0000 | 0.9570 | 0.0000 | |||
| 2022 | 0.9530 | 0.0000 | 0.9058 | 0.0000 | 0.9645 | 0.0000 | 0.9589 | 0.0000 | |||
注:Iglobal为全局莫兰指数;P值为显著性水平,P值小于0.05为显著,P值小于0.01为非常显著。 |
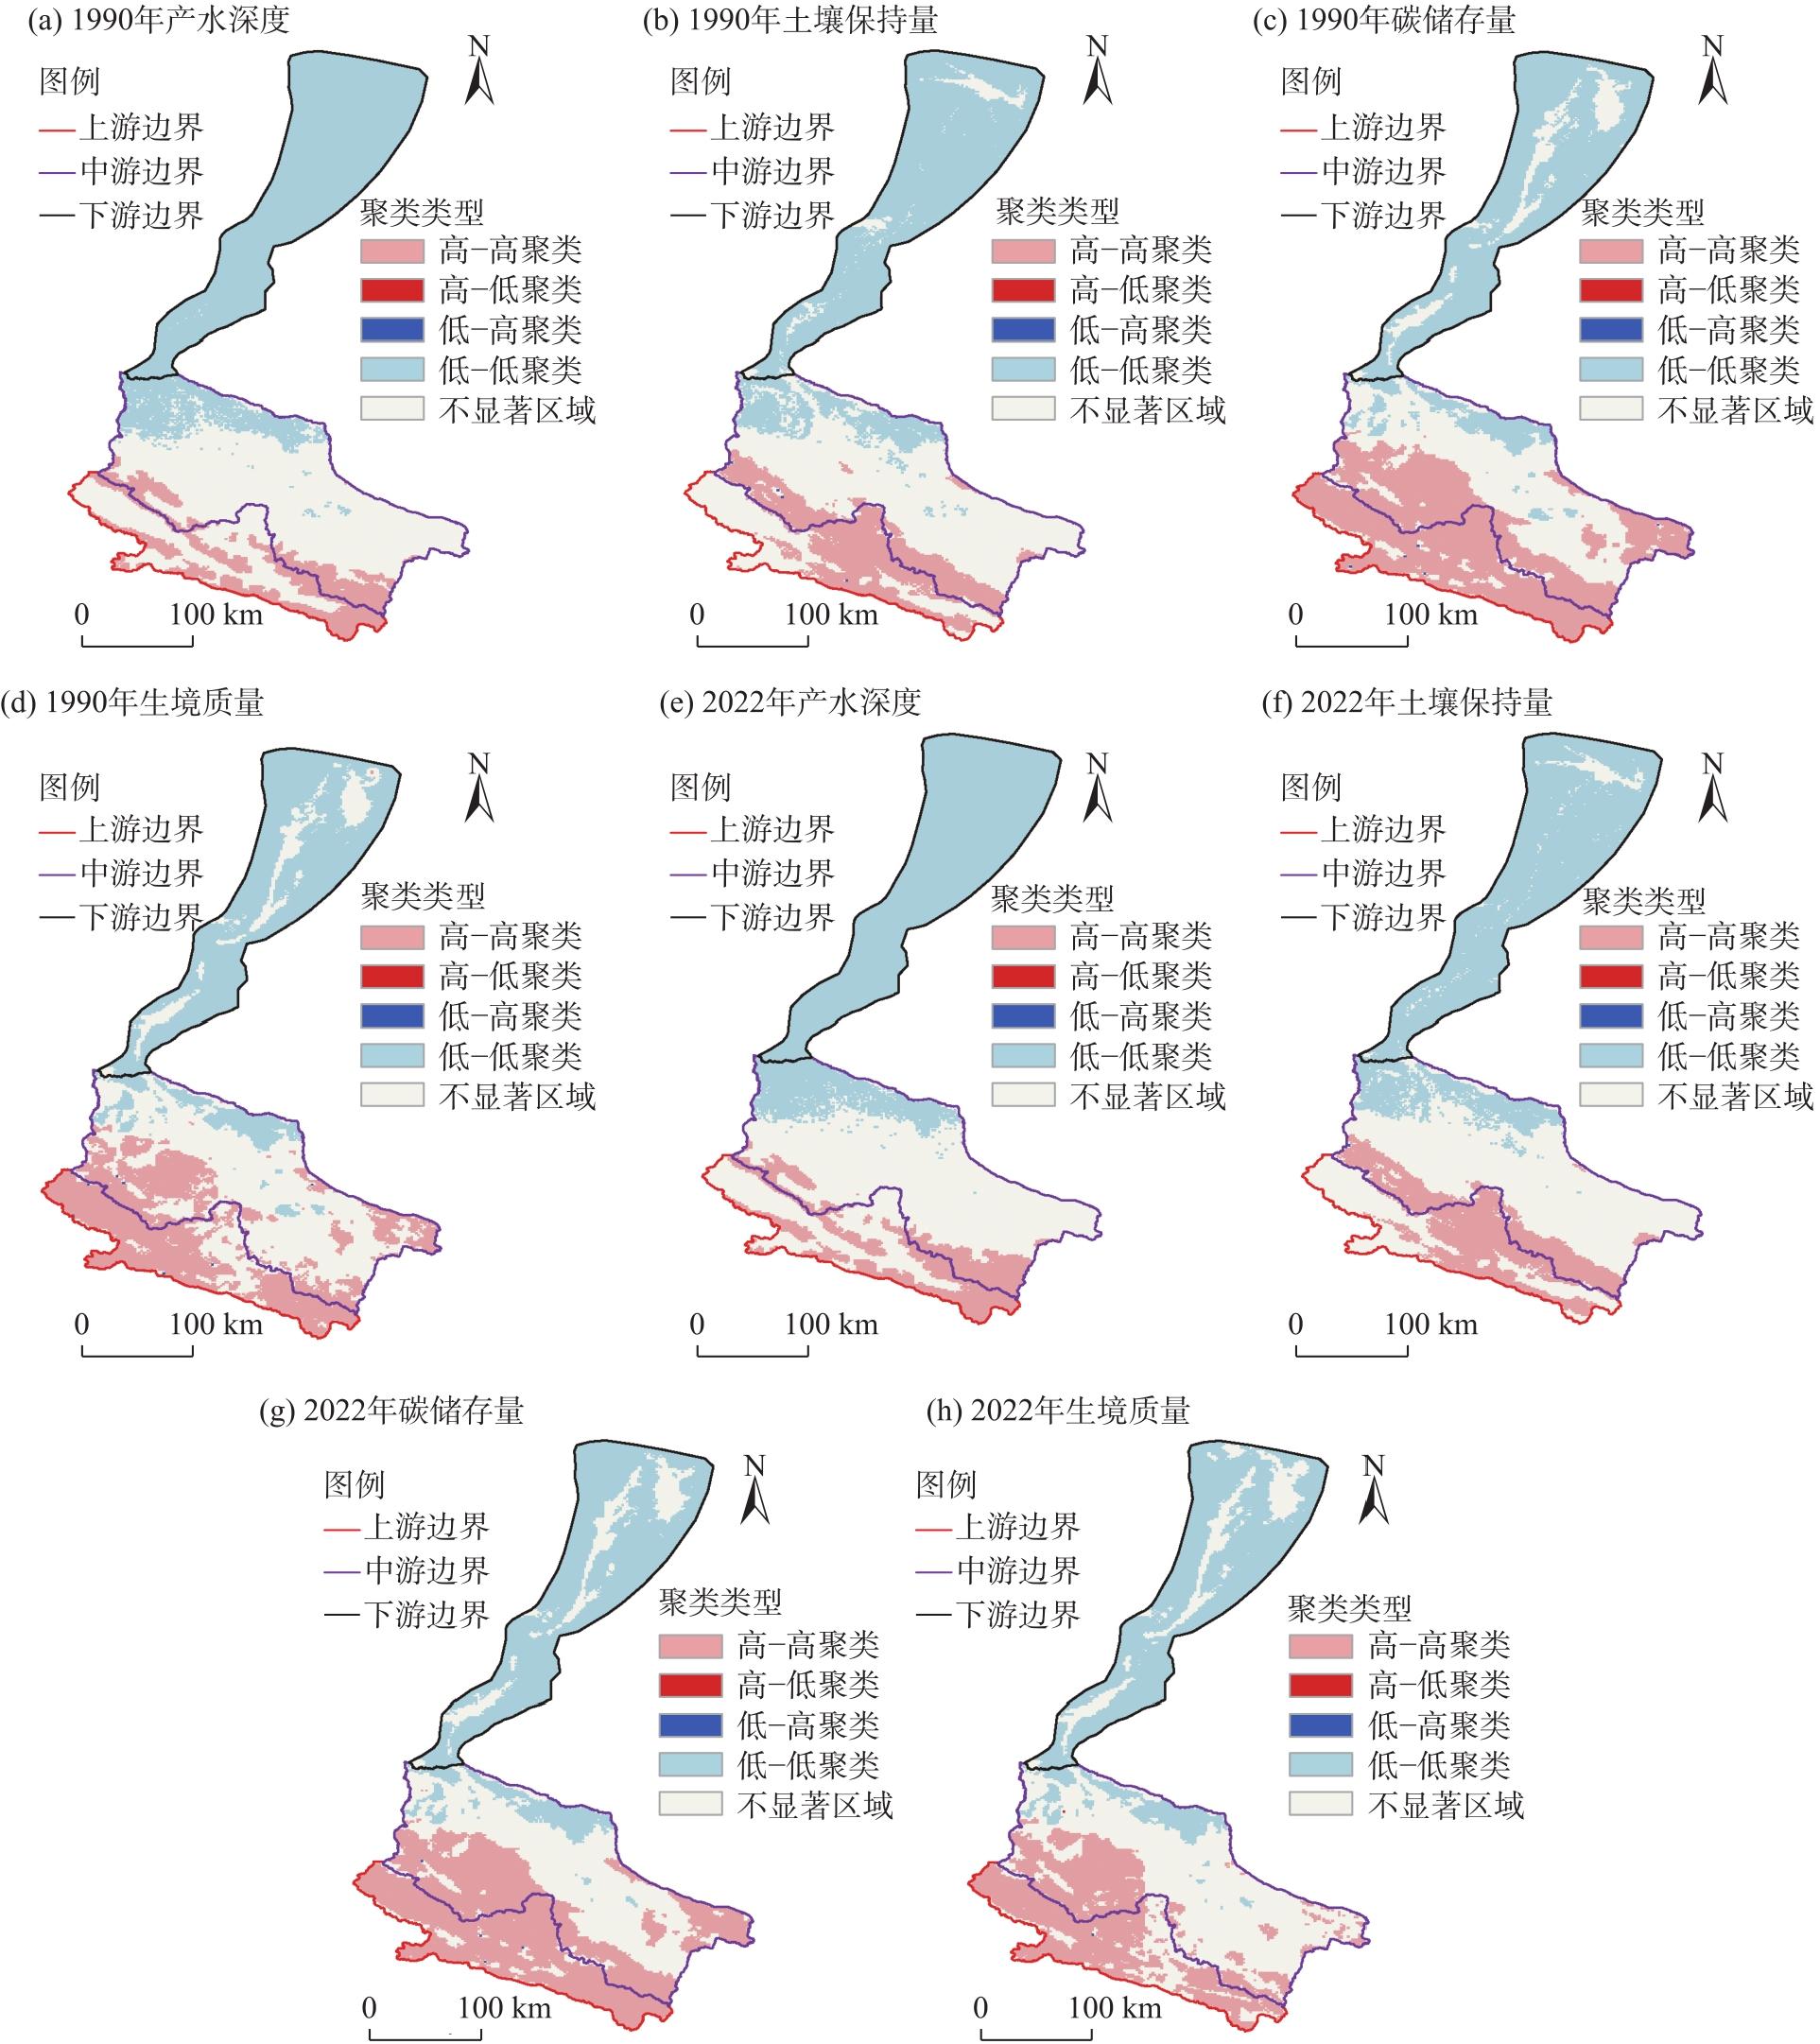
表4 1990—2022年生态系统服务空间聚类占比Tab. 4 Spatial cluster proportion of ecosystem services from 1990 to 2022 /% |
| 聚类类型 | 产水深度 | 土壤保持量 | 碳储存量 | 生境质量 | |||||||
|---|---|---|---|---|---|---|---|---|---|---|---|
| 1990年 | 2022年 | 1990年 | 2022年 | 1990年 | 2022年 | 1990年 | 2022年 | ||||
| 高-高聚类 | 12.69 | 12.94 | 16.27 | 16.09 | 32.66 | 32.63 | 25.34 | 23.62 | |||
| 高-低聚类 | 0.00 | 0.00 | 0.00 | 0.00 | 0.00 | 0.00 | 0.00 | 0.01 | |||
| 不显著区域 | 44.74 | 44.41 | 44.86 | 44.13 | 33.72 | 34.53 | 41.04 | 44.48 | |||
| 低-低聚类 | 42.57 | 42.65 | 38.84 | 39.76 | 33.59 | 32.82 | 33.58 | 31.88 | |||
| 低-高聚类 | 0.00 | 0.00 | 0.03 | 0.02 | 0.02 | 0.02 | 0.04 | 0.01 | |||
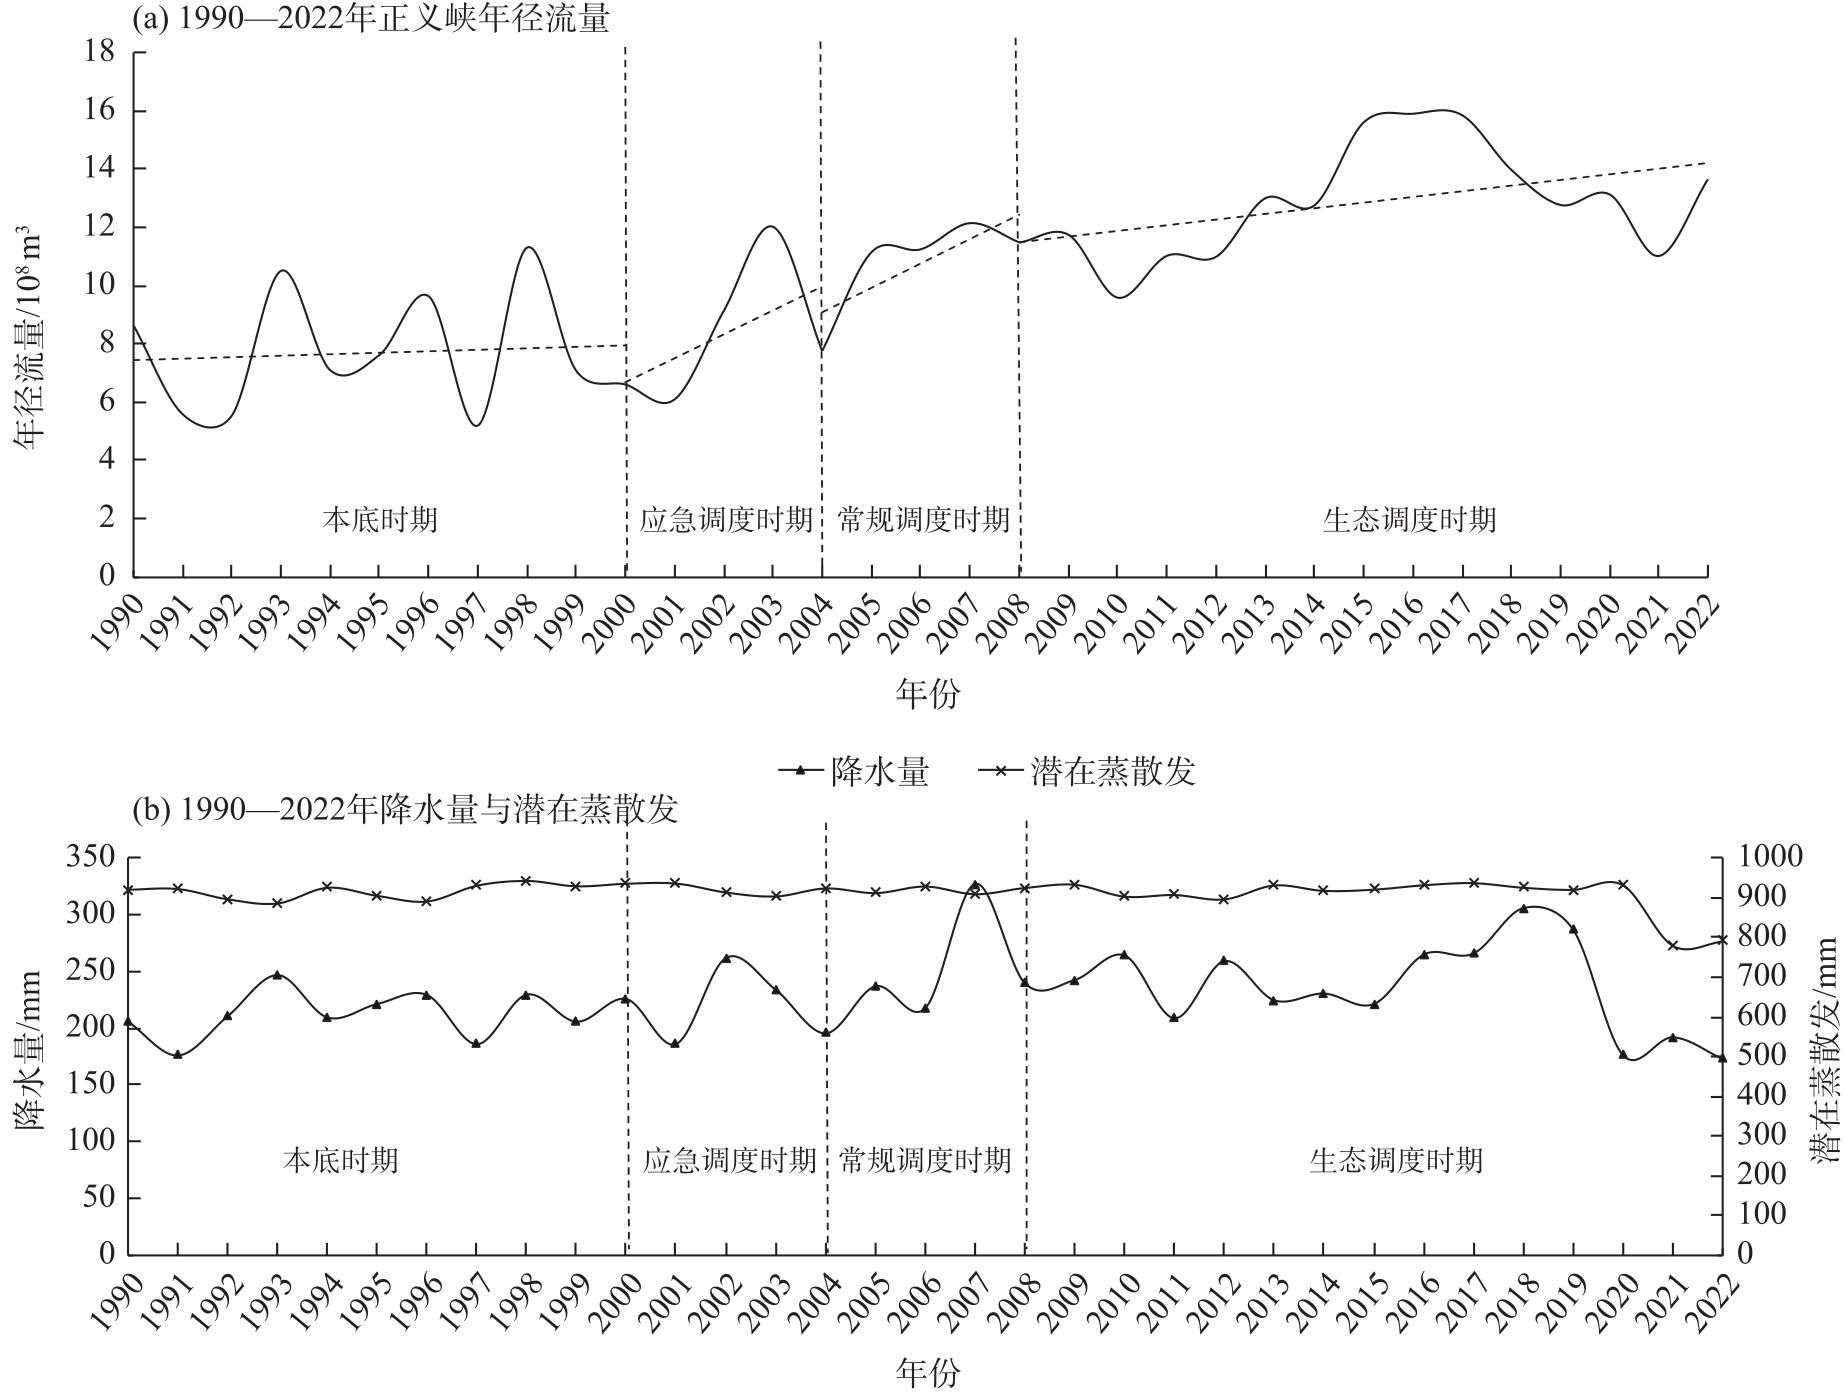
表5 1990—2022年正义峡年均径流量与下游生态系统服务Tab. 5 Average annual runoff of Zhengyi Gorge and ecosystem services in the downstream from 1990 to 2022 |
| 年份 | 年均径流量/108 m3 | 产水深度/10-5 mm | 土壤保持量/t·hm-2 | 碳储存量/t·hm-2 | 生境质量 |
|---|---|---|---|---|---|
| 1990 | 8.62 | 15.53 | 1.42 | 33.52 | 0.0445 |
| 1995 | 7.26 | 32.24 | 1.56 | 33.26 | 0.0392 |
| 2000 | 7.96 | 6.70 | 1.27 | 33.55 | 0.0468 |
| 2005 | 9.22 | 6.40 | 1.25 | 34.15 | 0.0484 |
| 2010 | 11.26 | 21.31 | 1.44 | 34.94 | 0.0515 |
| 2015 | 12.70 | 5.10 | 1.26 | 34.82 | 0.0512 |
| 2020 | 14.35 | 0.88 | 1.06 | 35.33 | 0.0532 |
| 2022 | 12.36 | 0.73 | 1.01 | 35.16 | 0.0532 |
表6 正义峡年均径流量与下游生态系统服务间的相关系数Tab. 6 Correlation coefficient between average annual runoff and downstream ecosystem services |
| 相关系数 | 产水深度 | 土壤保持量 | 碳储存量 | 生境质量 |
|---|---|---|---|---|
| Pearson | -0.6058 | -0.6571 | 0.8891(P<0.01) | 0.8299(P<0.05) |
| Spearman | -0.7143(P<0.05) | -0.6190 | 0.8571(P<0.01) | 0.8383(P<0.01) |
表7 1990—2022年下游碳储存量及生境质量模拟结果与实际对比Tab. 7 Comparison of downstream carbon storage and habitat quality simulation results from 1990 to 2022 |
| 年份 | 碳储存量/t·hm-2 | 生境质量 | |||
|---|---|---|---|---|---|
| 实际 | 模拟 | 实际 | 模拟 | ||
| 1990 | 33.52 | - | 0.0445 | - | |
| 1995 | 33.26 | - | 0.0392 | - | |
| 2000 | 33.55 | 32.21 | 0.0468 | 0.0370 | |
| 2005 | 34.15 | 31.72 | 0.0484 | 0.0348 | |
| 2010 | 34.94 | 31.42 | 0.0515 | 0.0337 | |
| 2015 | 34.82 | 31.06 | 0.0513 | 0.0323 | |
| 2020 | 35.33 | 30.83 | 0.0532 | 0.0311 | |
| 2022 | 35.16 | 30.39 | 0.0532 | 0.0301 | |
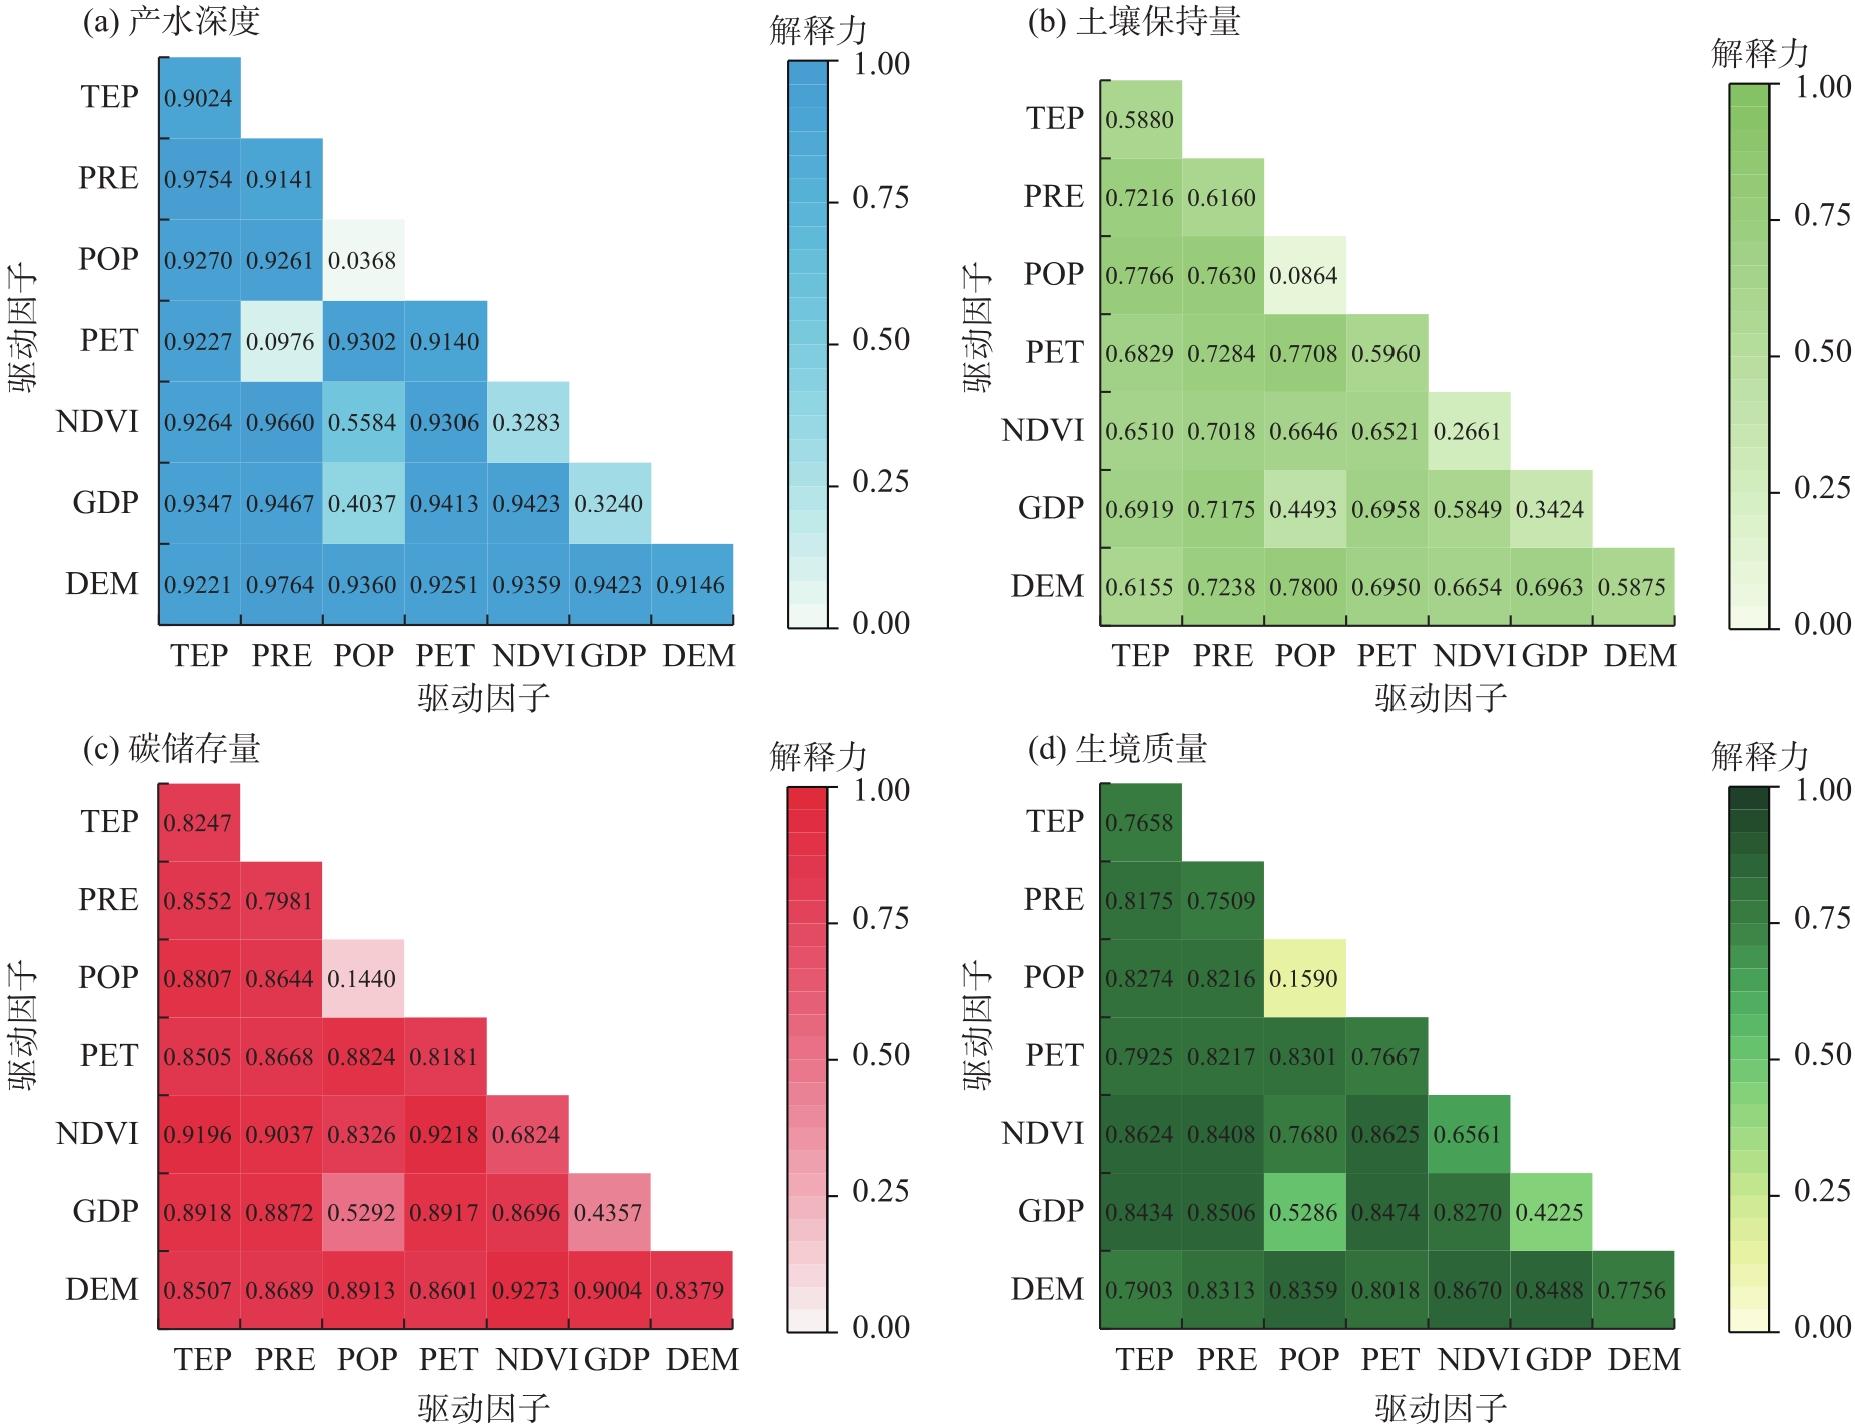
表8 地理探测器中驱动因子q值及排名Tab. 8 The q values and ranking of driving factors by Geodetector |
| 驱动因子 | 解释力(q值)(排名) | |||
|---|---|---|---|---|
| 产水深度 | 土壤保持量 | 碳储存量 | 生境质量 | |
| 降水量(PRE) | 0.9141(2) | 0.6160(1) | 0.7981(4) | 0.7509(4) |
| 潜在蒸散发(PET) | 0.9140(3) | 0.5960(2) | 0.8181(3) | 0.7667(2) |
| 气温(TEP) | 0.9024(4) | 0.5880(3) | 0.8247(2) | 0.7658(3) |
| 人口分布(POP) | 0.0368(7) | 0.0864(7) | 0.1440(7) | 0.1590(7) |
| 地区生产总值(GDP) | 0.3240(6) | 0.3424(5) | 0.4357(6) | 0.4225(6) |
| 归一化植被指数(NDVI) | 0.3283(5) | 0.2661(6) | 0.6824(5) | 0.6561(5) |
| 数字高程(DEM) | 0.9146(1) | 0.5875(4) | 0.8379(1) | 0.7756(1) |
| [1] |
康婷婷, 李增, 高彦春. 西北干旱区山地-绿洲-荒漠系统生态恢复综合效益评估[J]. 生态学报, 2019, 39(20): 7418-7431.
[
|
| [2] |
赵军, 马小平, 魏伟. 近50年黑河流域潜在植被的演替及生态环境变化研究[J]. 草业学报, 2014, 23(5): 61-68.
[
|
| [3] |
|
| [4] |
蒋晓辉, 夏军, 黄强, 等. 黑河“97”分水方案适应性分析[J]. 地理学报, 2019, 74(1): 103-116.
[
|
| [5] |
|
| [6] |
|
| [7] |
|
| [8] |
曹祺文, 卫晓梅, 吴健生. 生态系统服务权衡与协同研究进展[J]. 生态学杂志, 2016, 35(11): 3102-3111.
[
|
| [9] |
张静静, 朱文博, 朱连奇, 等. 伏牛山地区森林生态系统服务权衡/协同效应多尺度分析[J]. 地理学报, 2020, 75(5): 975-988.
[
|
| [10] |
张福平, 李肖娟, 冯起, 等. 基于InVEST模型的黑河流域上游水源涵养量[J]. 中国沙漠, 2018, 38(6): 1321-1329.
[
|
| [11] |
李芳, 张金龙, 杨环. 基于InVEST模型的黑河流域上游1990—2018年产水量模拟[J]. 高原气象, 2022, 41(3): 698-707.
[
|
| [12] |
王蓓, 赵军, 胡秀芳. 基于InVEST模型的黑河流域生态系统服务空间格局分析[J]. 生态学杂志, 2016, 35(10): 2783-2792.
[
|
| [13] |
朱春霞, 钟绍卓, 龙宇, 等. 黄河流域生态系统服务的时空演变及其驱动力[J]. 生态学杂志, 2023, 42(10): 2502-2513.
[
|
| [14] |
韩武宏. 基于InVEST模型的祁连山国家公园生态系统服务功能评估及其驱动力研究[D]. 兰州: 西北师范大学, 2022.
[
|
| [15] |
包玉斌, 李婷, 柳辉, 等. 基于InVEST模型的陕北黄土高原水源涵养功能时空变化[J]. 地理研究, 2016, 35(4): 664-676.
[
|
| [16] |
李成, 赵洁, 庄智程, 等. 长三角城市群生态系统服务权衡强度时空演变及影响因素[J]. 生态学报, 2022, 42(14): 5708-5720.
[
|
| [17] |
何佳瑛, 蒋晓辉, 雷宇昕. 黄土高原生态工程对关键生态系统服务时空变化的影响——以延河流域为例[J]. 生态学报, 2023, 43(12): 4823-4834.
[
|
| [18] |
|
| [19] |
陈童尧, 贾燕锋, 王佳楠, 等. 基于InVEST模型的祁连山国家级自然保护区土壤保持现状与功能[J]. 干旱区研究, 2020, 37(1): 150-159.
[
|
| [20] |
胡秀芳, 赵军, 王蓓, 等. 黑河流域生态系统服务空间协同与权衡变化[J]. 生态学杂志, 2022, 41(3): 580-588.
[
|
| [21] |
王耕, 冯妍. 辽宁太子河流域生态系统服务权衡/协同关系时空变化与情景预测[J]. 生态学报, 2024, 44(1): 96-106.
[
|
| [22] |
刘颂, 张浩鹏, 裴新生, 等. 长时间序列生态系统服务权衡与协同驱动因素——以芜湖市生态系统服务功能极重要区为例[J]. 生态学报, 2024, 44(5): 1780-1790.
[
|
| [23] |
许宝荣, 刘一川, 董莹, 等. 基于InVEST模型的兰州地区生境质量评价[J]. 中国沙漠, 2021, 41(5): 120-129.
[
|
| [24] |
张华, 韩武宏, 宋金岳, 等. 祁连山国家公园生境质量时空演变[J]. 生态学杂志, 2021, 40(5): 1419-1430.
[
|
| [25] |
|
| [26] |
孟斌, 王劲峰, 张文忠, 等. 基于空间分析方法的中国区域差异研究[J]. 地理科学, 2005, 25(4): 393-400.
[
|
| [27] |
|
| [28] |
蒋小芳, 段翰晨, 廖杰, 等. 基于PLUS-SD耦合模型的黑河流域中游甘临高地区土地利用研究[J]. 干旱区研究, 2022, 39(4): 1246-1258.
[
|
| [29] |
秦正, 高宇潇, 萨木哈·单山白. 基于PLUS-InVEST的济南多情景土地利用变化模拟与碳储量评估[J]. 人民黄河, 2024, 46(5): 117-122.
[
|
| [30] |
任胤铭, 刘小平, 许晓聪, 等. 基于FLUS-InVEST模型的京津冀多情景土地利用变化模拟及其对生态系统服务功能的影响[J]. 生态学报, 2023, 43(11): 4473-4487.
[
|
| [31] |
胡丰, 张艳, 郭宇, 等. 基于PLUS和InVEST模型的渭河流域土地利用与生境质量时空变化及预测[J]. 干旱区地理, 2022, 45(4): 1125-1136.
[
|
| [32] |
方匡南, 吴见彬, 朱建平, 等. 随机森林方法研究综述[J]. 统计与信息论坛, 2011, 26(3): 7.
[
|
| [33] |
|
| [34] |
王劲峰, 徐成东. 地理探测器: 原理与展望[J]. 地理学报, 2017, 72(1): 116-134.
[
|
| [35] |
李传哲, 于福亮, 刘佳, 等. 近20年来黑河干流中游地区土地利用/覆被变化及驱动力定量研究[J]. 自然资源学报, 2011, 26(3): 353-363.
[
|
| [36] |
薛晓玉, 王晓云, 段含明, 等. 基于土地利用变化的祁连山地区生境质量时空演变分析[J]. 水土保持通报, 2020, 40(2): 278-284, 325.
[
|
| [37] |
王雅, 蒙吉军. 黑河中游土地利用变化对生态系统服务的影响[J]. 干旱区研究, 2017, 34(1): 200-207.
[
|
| [38] |
|
| [39] |
|
| [40] |
张一驰, 于静洁, 乔茂云, 等. 黑河流域生态输水对下游植被变化影响研究[J]. 水利学报, 2011, 42(7): 757-765.
[
|
| [41] |
石莹, 别强, 苏晓杰, 等. 基于InVEST模型的水源涵养功能评价的时空变化——以兰州市为例[J]. 干旱区地理, 2024, 47(9): 1518-1529.
[
|
| [42] |
黄学煜, 修丽娜, 陆志翔. 陇东黄土高原生态系统服务权衡效应及其驱动因素[J]. 干旱区地理, 2025, 48(3): 480-493.
[
|
/
| 〈 |
|
〉 |