
|
张毅明(1996-),男,硕士,工程师,主要从事资源与环境遥感、矿产勘查与成矿预测等方面的研究. E-mail: zhngyiming@mail.cgs.gov.cn |
收稿日期: 2024-09-03
修回日期: 2024-11-19
网络出版日期: 2026-03-11
基金资助
中国地质调查局项目(DD20230519)
Predicting and analysing glaciers in the Qinghai-Xizang Plateau: A random forest model
Received date: 2024-09-03
Revised date: 2024-11-19
Online published: 2026-03-11
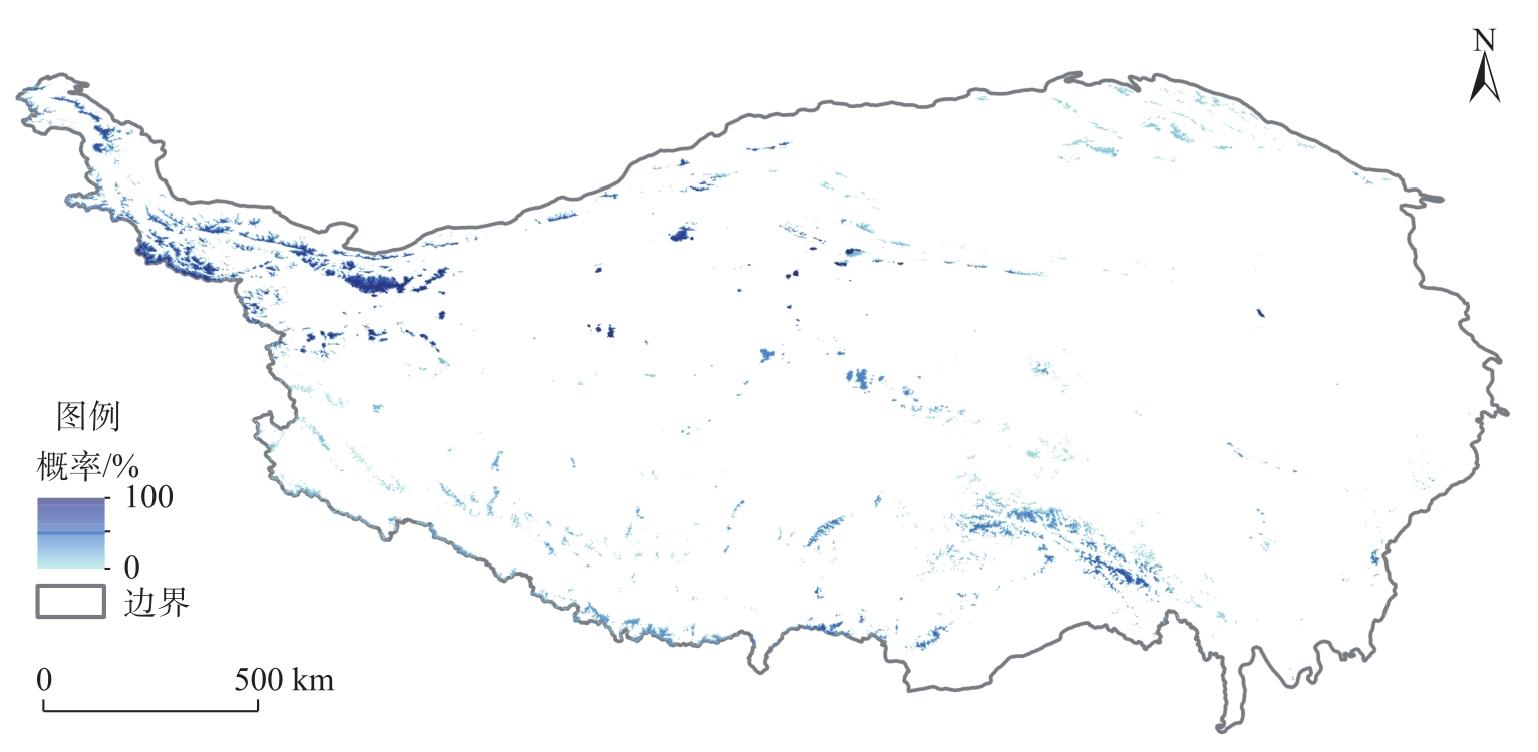
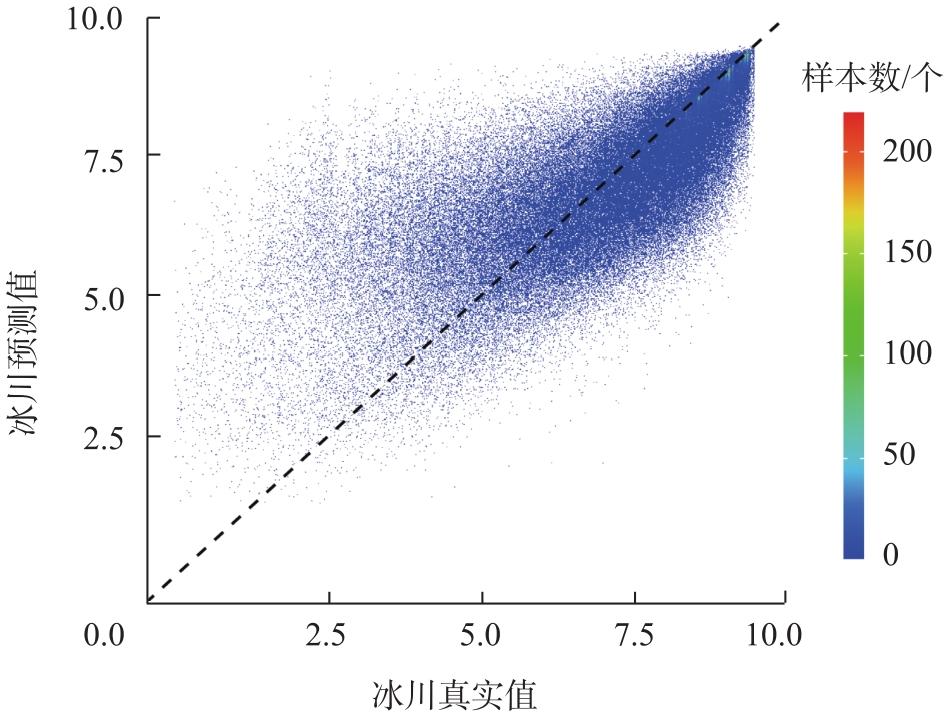
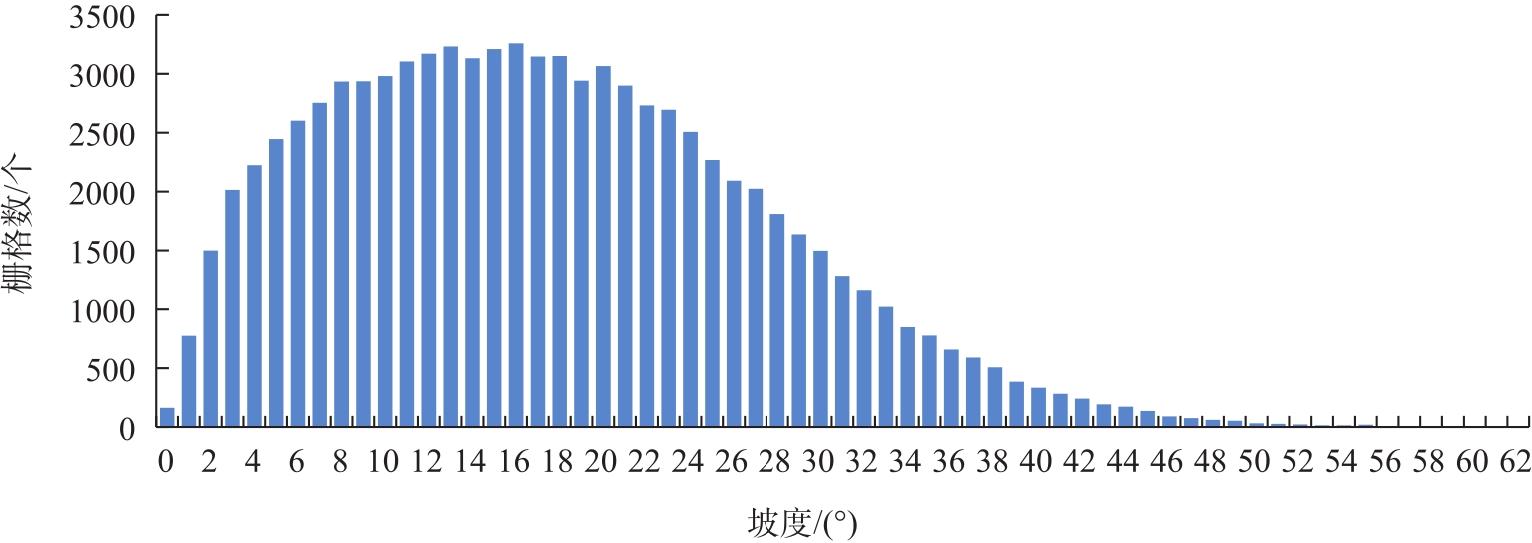
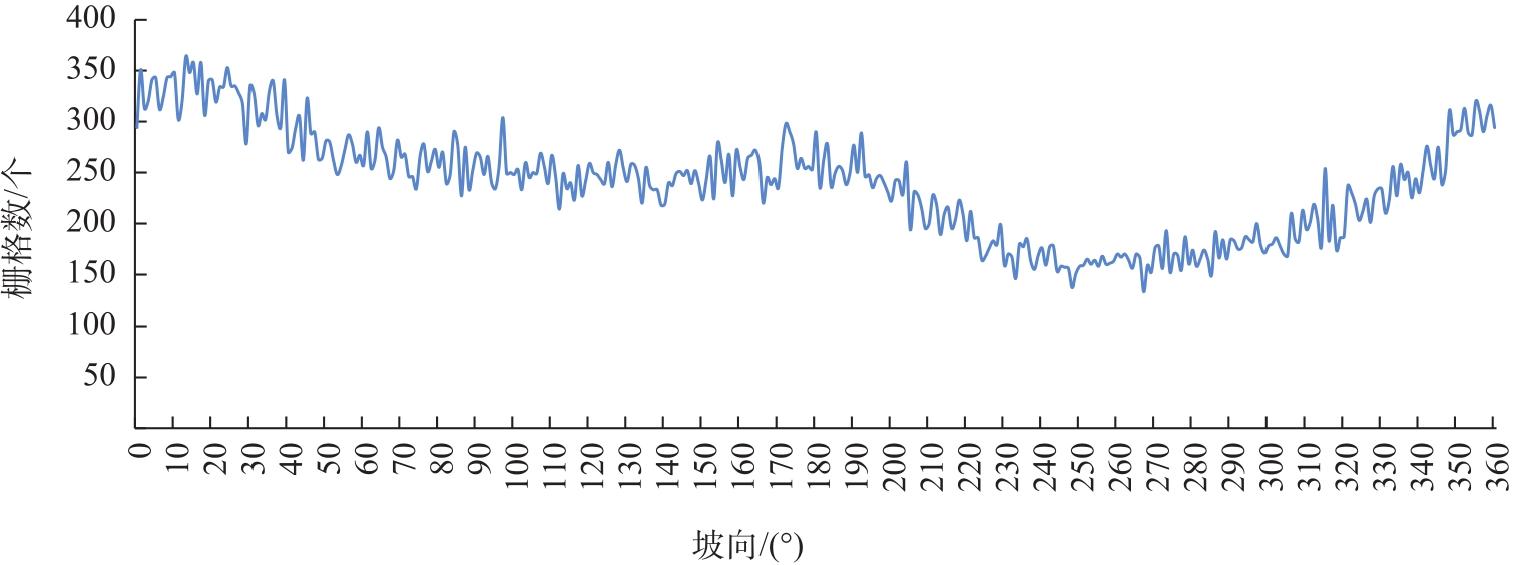
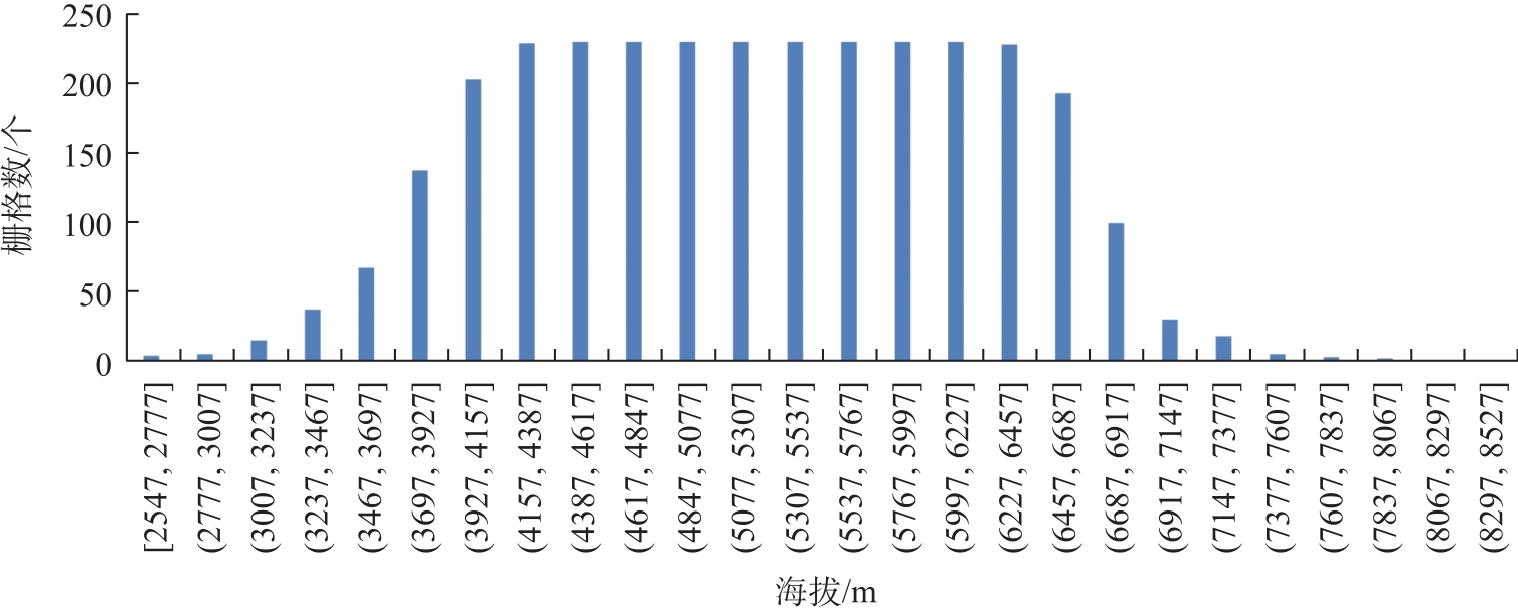
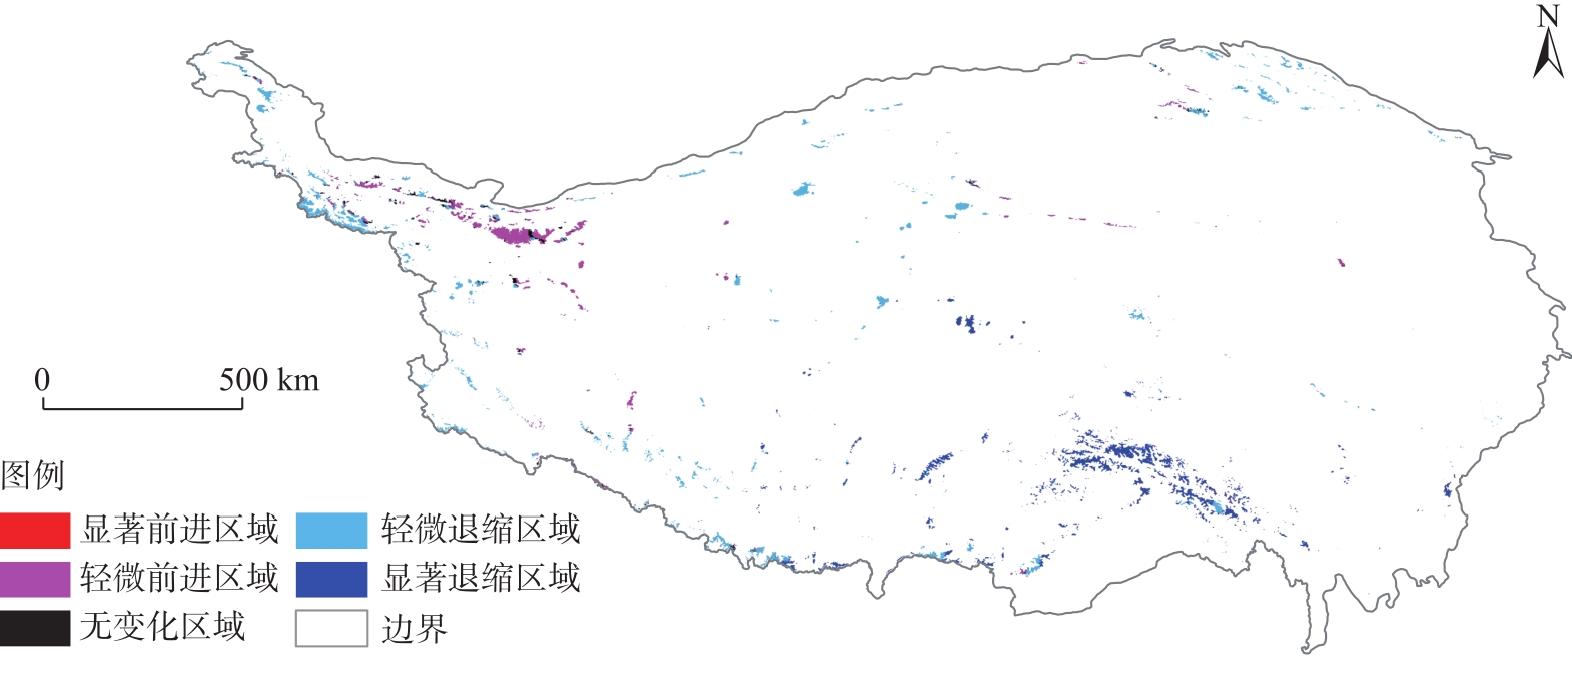
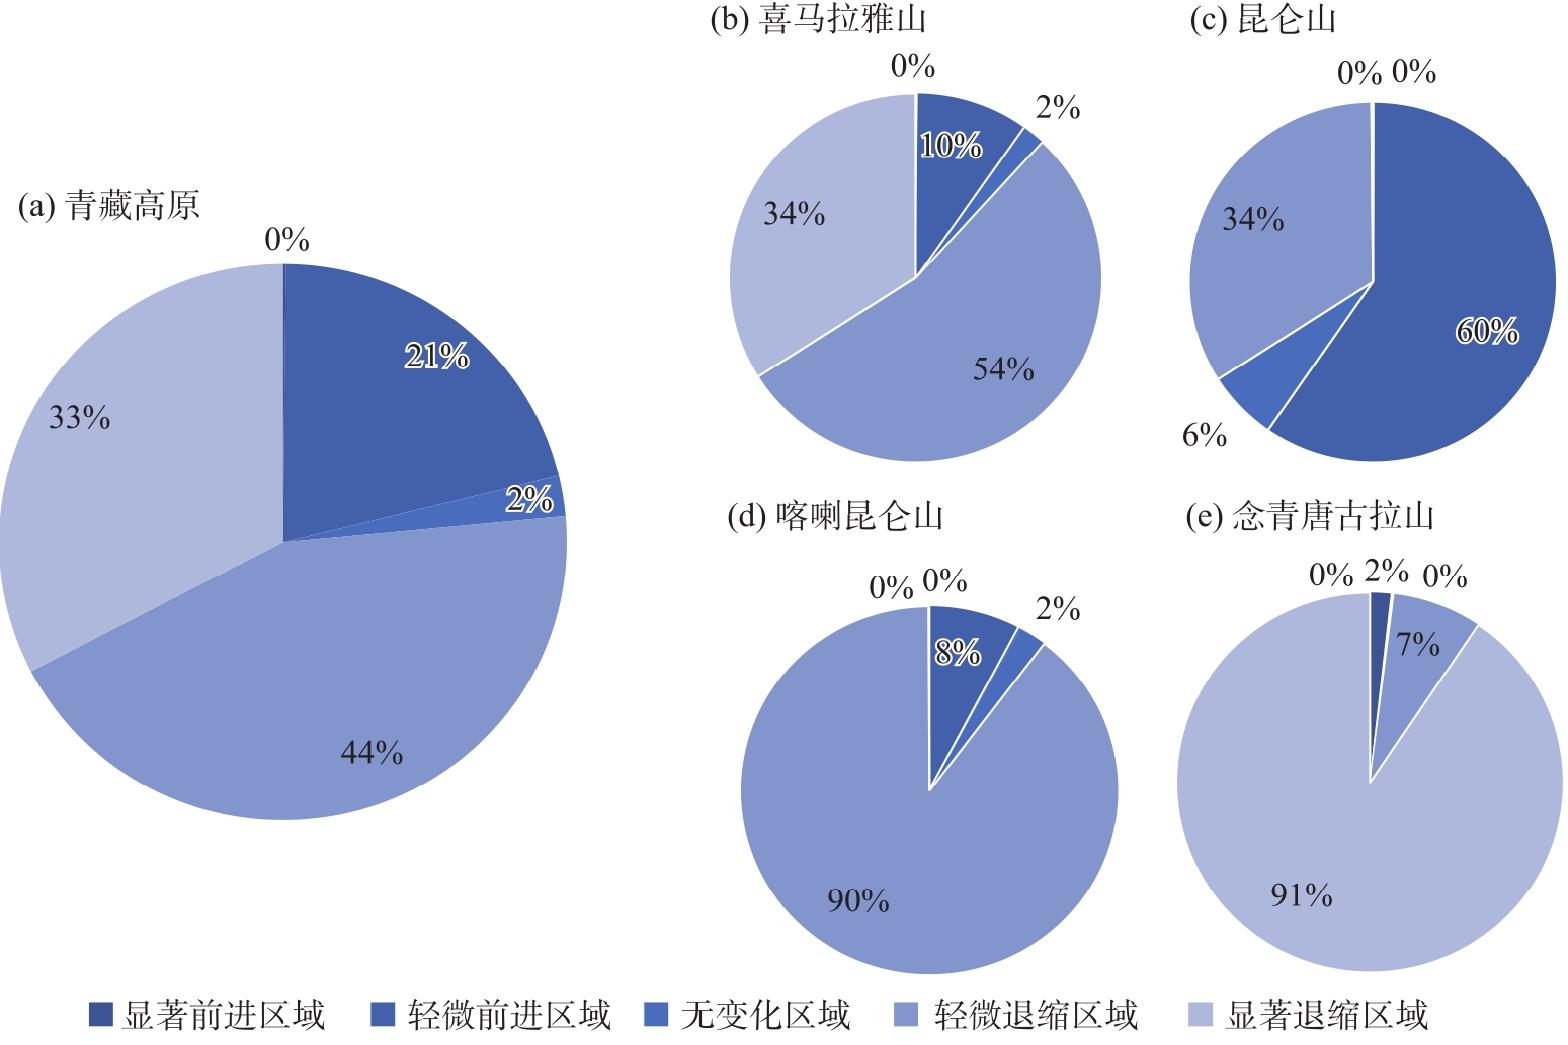
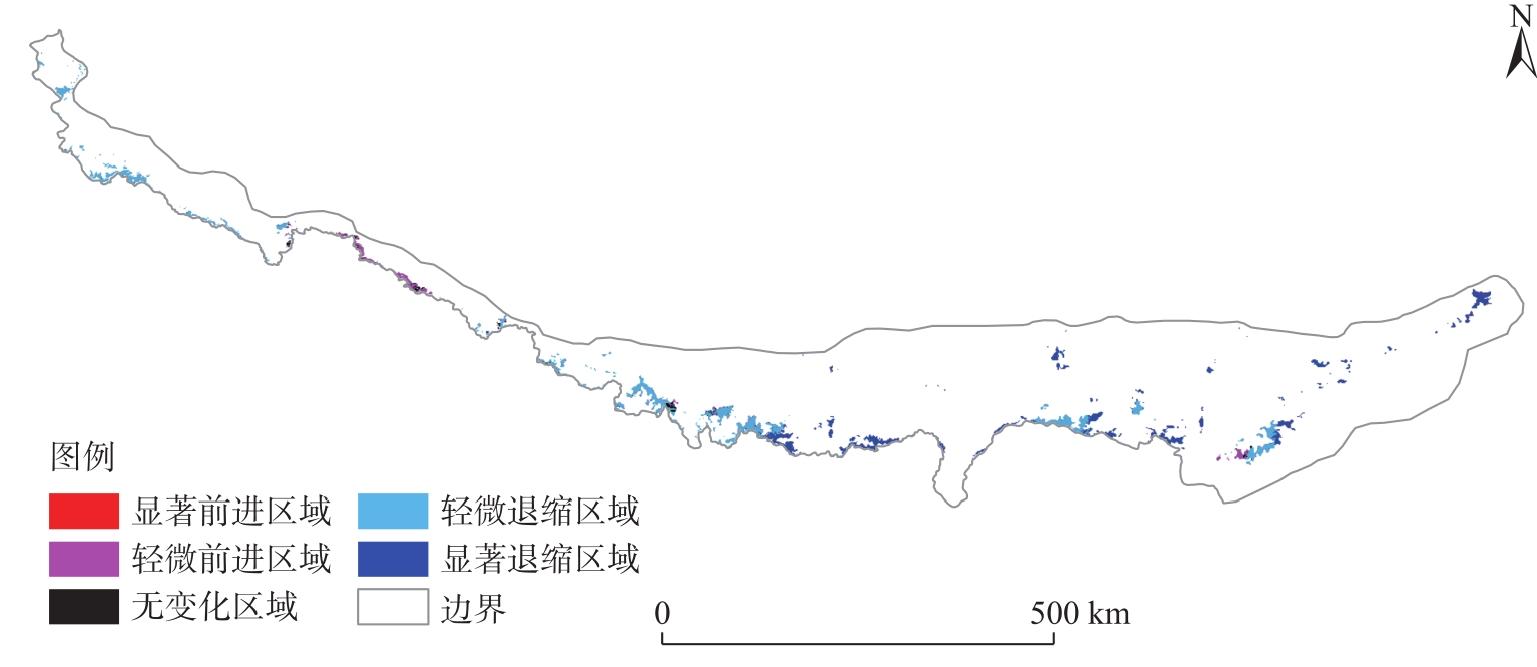
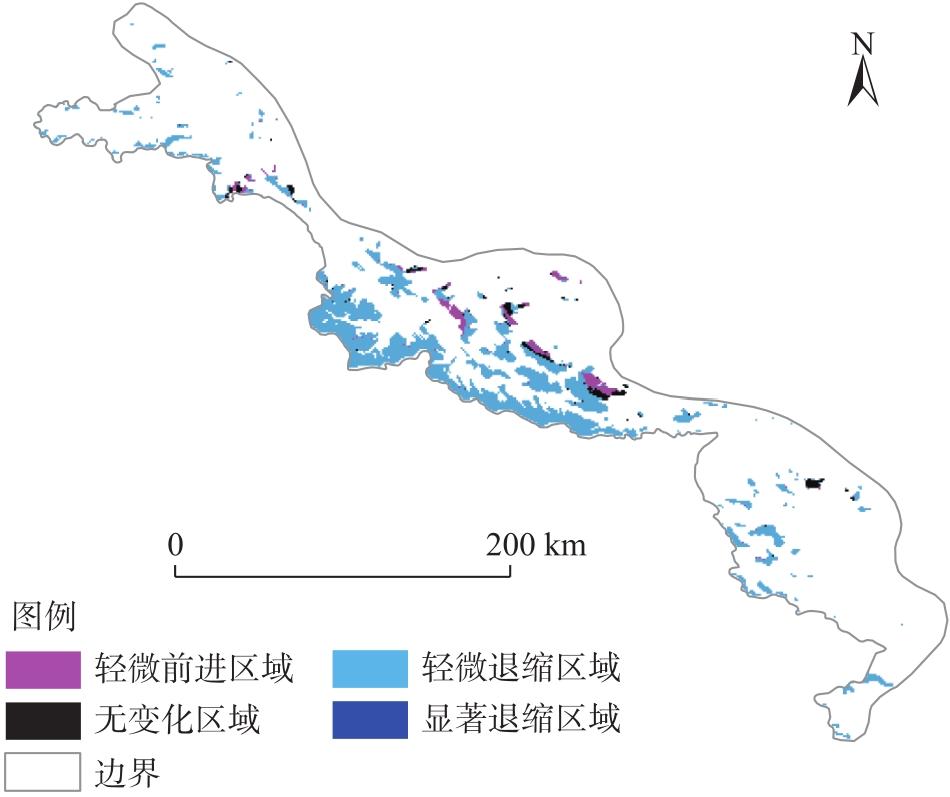
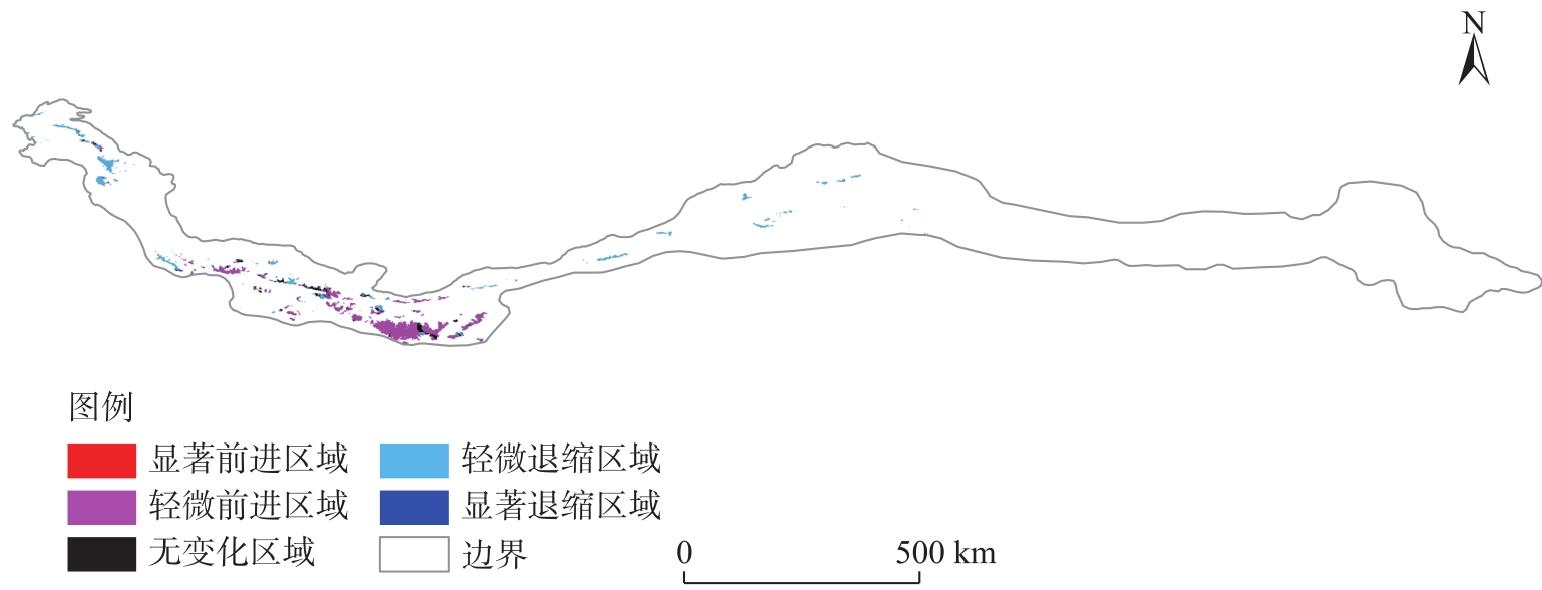
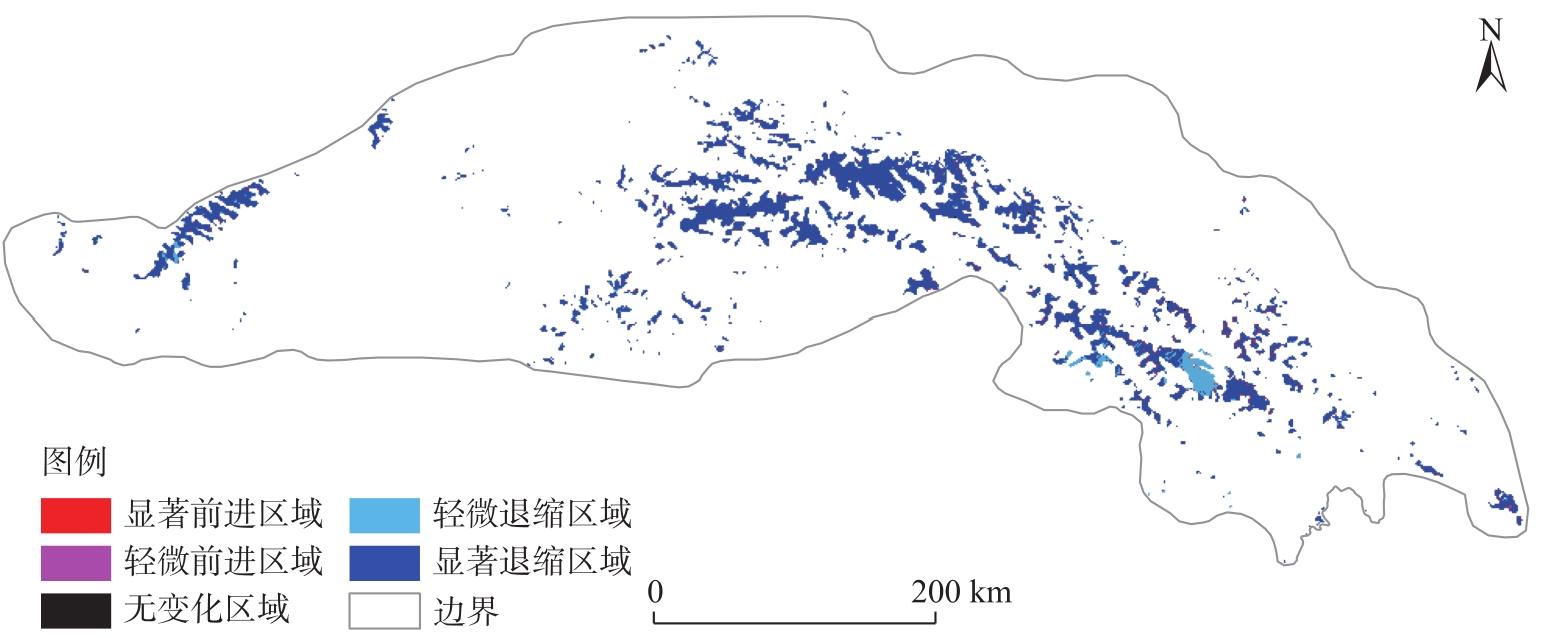
冰川是青藏高原自然资源调查监测的重点对象之一,冰川的调查监测与研究对青藏高原气候变化具有重要意义。以青藏高原冰川为研究对象,融合多源数据构建了一个随机森林模型(决定系数=0.72),获得了2000—2020年青藏高原逐年1 km尺度冰川预测数据集,分析了2000—2020年青藏高原冰川的空间分布特征和时空变化特征。研究表明:(1)青藏高原冰川空间分布特征为:主要分布于0°~40°坡度范围内,占比达97.92%;主要分布于4000~7000 m海拔范围内,占比达99.38%;总体呈现北坡多于南坡、西坡多于东坡的特点。(2)青藏高原冰川时空变化特征为:时间上,2000—2020年青藏高原冰川总体呈现显著退缩趋势。空间上,青藏高原边缘地区冰川存在显著变化趋势,从边缘向腹地显著变化趋势减弱,腹地以轻微变化趋势为主。(3)喜马拉雅山和念青唐古拉山冰川主要呈显著退缩趋势,喀喇昆仑山冰川主要呈轻微退缩趋势,昆仑山冰川呈轻微前进趋势与轻微退缩趋势并存的特点。
张毅明 , 汤宇磊 , 冯俊波 . 基于随机森林模型的青藏高原冰川预测及分析[J]. 干旱区地理, 2025 , 48(8) : 1342 -1352 . DOI: 10.12118/j.issn.1000-6060.2024.528
Glaciers on the Qinghai-Xizang Plateau, China serve as critical indicators for natural resource monitoring and regional climate change analysis. This study investigates glacier dynamics across the plateau by integrating multi-source datasets and developing a robust random forest model (R2=0.72) to generate a 1 km-resolution annual glacier prediction dataset spanning from 2000 to 2020. Key findings include as follows: (1) Spatial distribution patterns: 97.92% of glaciers are located on slopes of 0°-40°, and 99.38% are distributed at elevations of 4000-7000 m. Glacier density is higher on northern slopes than on southern slopes, and western slopes exhibit greater coverage than eastern slopes. (2) Spatiotemporal changes: From 2000 to 2020, glaciers exhibited a clear retreat trend. Spatially, stronger variation signals were observed along the plateau margins, while interior regions showed relatively minor changes. (3) Regional trends: Glaciers in the Himalaya Mountains and Nyainqentanglha Mountains showed significant retreat, while those in the Karakoram Mountains experienced only slight retreat. The Kunlun Mountains exhibited a mixed pattern of slight advancement and retreat.
表1 数据来源Tab. 1 Data sources |
| 数据 | 来源 | 分辨率 |
|---|---|---|
| 冰川分布数据 | 国家青藏高原科学数据中心 | 1 km |
| NDVI数据 | MODIS传感器 | 1 km |
| SRTM高程数据 | 美国太空总署、美国国防部国家测绘局 | 30 m |
| 产水模数数据 | 中国科学院资源环境科学数据中心 | 1 km |
| 气温格点数据 | 国家气象信息中心 | 0.5° |
| 降水格点数据 | 国家气象信息中心 | 0.5° |
| 土地利用数据 | 国家基础地理信息中心 | 30 m |
| 欧洲航天局 | 300 m | |
| GDP数据 | 中国科学院地理科学与资源研究所 | 1 km |
| 人口密度数据 | 社会经济数据和应用中心 | 1 km |
注:NDVI为归一化植被指数;SRTM为航天飞机雷达地形测绘任务。 |
表2 2017、2020年不同坡度、坡向和海拔分级内冰川面积占比统计Tab. 2 Statistical of glacier area proportions in different slope, aspect and elevation grades in 2017, 2020 |
| 坡度/(°) | 占比/% | 坡向/(°) | 占比/% | 海拔/m | 占比/% | |||
|---|---|---|---|---|---|---|---|---|
| 2017年 | 2020年 | 2017年 | 2020年 | 2017年 | 2020年 | |||
| 0~10 | 23.68 | 23.68 | 0.0~22.5 | 8.90 | 8.90 | 0~1000 | 0.00 | 0.00 |
| 10~20 | 36.46 | 36.46 | 22.5~67.5 | 15.28 | 15.27 | 1000~2000 | 0.00 | 0.00 |
| 20~30 | 27.61 | 27.61 | 67.5~112.5 | 13.38 | 13.38 | 2000~3000 | 0.11 | 0.01 |
| 30~40 | 10.17 | 10.17 | 112.5~157.5 | 12.79 | 12.82 | 3000~4000 | 3.33 | 0.56 |
| 40~50 | 1.92 | 1.92 | 157.5~202.5 | 13.29 | 13.29 | 4000~5000 | 26.39 | 18.29 |
| 50~60 | 0.16 | 0.16 | 202.5~247.5 | 9.84 | 9.85 | 5000~6000 | 49.79 | 69.99 |
| 60~70 | 0.00 | 0.00 | 247.5~292.5 | 8.70 | 8.66 | 6000~7000 | 19.79 | 11.10 |
| 70~80 | 0.00 | 0.00 | 292.5~337.5 | 10.78 | 10.73 | 7000~8000 | 0.56 | 0.05 |
| 80~90 | 0.00 | 0.00 | 337.5~360.0 | 7.04 | 7.10 | 8000~9000 | 0.03 | 0.00 |
表3 Mann-Kendall检验结果统计表Tab. 3 Statistical table of Mann-Kendall test result |
| M-K检验数据 | Z值 | P值 |
|---|---|---|
| 青藏高原全区冰川数据 | -3.3519 | <0.01 |
| 喜马拉雅山冰川数据 | -2.3252 | <0.05 |
| 喀喇昆仑山冰川数据 | -1.1777 | >0.05 |
| 昆仑山冰川数据 | -0.0906 | >0.05 |
| 念青唐古拉山冰川数据 | -2.9291 | <0.01 |
注:Z值为统计量;P值为检验所得概率。 |
| [1] |
周玉杉. 基于多源遥感数据的青藏高原及其周边区域冰川物质平衡变化研究[J]. 地理与地理信息科学, 2019, 35(4): 142.
[
|
| [2] |
顾云杨. 利用影像大地测量技术监测2000—2020年长江源冰川物质平衡变化[D]. 长沙: 中南大学, 2023.
[
|
| [3] |
王宁练, 姚檀栋, 徐柏青, 等. 全球变暖背景下青藏高原及周边地区冰川变化的时空格局与趋势及影响[J]. 中国科学院院刊, 2019, 34(11): 1220-1232.
[
|
| [4] |
汪赢政, 李佳, 吴立新, 等. 1987—2018年祁连山冰川变化遥感监测及影响因子分析[J]. 冰川冻土, 2020, 42(2): 344-356.
[
|
| [5] |
冀琴, 张翠兰, 丁悦凯, 等. 基于多源遥感数据的珠峰自然保护区冰川监测研究[J]. 干旱区地理, 2023, 46(10): 1591-1601.
[
|
| [6] |
张裕. 1980—2020年唐古拉山冰川变化及其对气候波动的响应[D]. 大连: 辽宁师范大学, 2023.
[
|
| [7] |
田梦祺, 段克勤, 石培宏. 基于Google Earth Engine平台的青藏高原冰川变化研究——以普若岗日冰原为例[J]. 地理科学, 2023, 43(6): 943-951.
[
|
| [8] |
张萌. 基于Landsat影像构建新指数提取冰川面积信息的方法研究[D]. 西安: 西北大学, 2020.
[
|
| [9] |
彦立利, 王建. 基于遥感的冰川信息提取方法研究进展[J]. 冰川冻土, 2013, 35(1): 110-118.
[
|
| [10] |
张镱锂. 青藏高原边界数据总集[EB/OL]. [2019-06-11]. https://portal.casearth.cn/dataDetail/64b8866cd6067c9150a4a7ad.
[
|
| [11] |
张镱锂, 李炳元, 郑度. 《论青藏高原范围与面积》一文数据的发表——青藏高原范围界线与面积地理信息系统数据[J]. 地理学报, 2014, 69(增刊1): 65-68.
[
|
| [12] |
刘时银, 丁永建, 李晶, 等. 中国西部冰川对近期气候变暖的响应[J]. 第四纪研究, 2006, 26(5): 762-771.
[
|
| [13] |
叶庆华, 吴玉伟. 青藏高原2001年冰川数据-TPG2001(V1.0)[EB/OL]. [2018]. https://data.tpdc.ac.cn/zh-hans/data/4fc1e6b1-da41-46ad-a8b5-5f3adc4fde19.
[
|
| [14] |
叶庆华. 青藏高原2013年冰川数据-TPG2013(V1.0)[EB/OL]. [2018]. https://data.tpdc.ac.cn/zh-hans/data/38d741e0-ec7c-4aa5-8d10-d732a01b8063.
[
|
| [15] |
叶庆华. 青藏高原2017年冰川数据-TPG2017(V1.0)[EB/OL]. [2019]. https://data.tpdc.ac.cn/zh-hans/data/9777a877-a787-4e43-bf4c-8bee492c75a4.
[
|
| [16] |
|
| [17] |
|
| [18] |
周继华, 来利明, 陈巧娥, 等. 基于机器学习和经验知识的青藏高原多时段植被制图[J]. 科学通报, 2025, 70(1): 134-144.
[
|
| [19] |
|
| [20] |
丁悦凯, 刘睿, 张翠兰, 等. 喜马拉雅地区叶如藏布流域冰川和冰湖变化遥感监测研究[J]. 干旱区地理, 2022, 45(6): 1870-1880.
[
|
| [21] |
刘时银, 姚晓军, 郭万钦, 等. 基于第二次冰川编目的中国冰川现状[J]. 地理学报, 2015, 70(1): 3-16.
[
|
| [22] |
廖美玉, 方秀琴, 蒋心远, 等. 黄河流域近40年土地利用/覆被时空变化特征[J]. 水土保持学报, 2024, 38(2): 165-177.
[
|
| [23] |
叶庆华, 程维明, 赵永利, 等. 青藏高原冰川变化遥感监测研究综述[J]. 地球信息科学学报, 2016, 18(7): 920-930.
[
|
/
| 〈 |
|
〉 |