
|
谢宇(2000-),女,硕士研究生,主要从事区域经济等方面的研究. E-mail: XieLYu0501@163.com |
收稿日期: 2024-07-04
修回日期: 2024-08-10
网络出版日期: 2026-03-11
基金资助
河南省科技厅软科学项目(242400410431)
河南省社科规划项目(2024BJJ00437)
Digital economy empowers green development welfare: Empirical evidence based on resource-based cities in the Yellow River Basin
Received date: 2024-07-04
Revised date: 2024-08-10
Online published: 2026-03-11
谢宇 , 薛选登 . 数字经济赋能绿色发展福利——基于黄河流域资源型城市的经验证据[J]. 干旱区地理, 2025 , 48(6) : 1127 -1139 . DOI: 10.12118/j.issn.1000-6060.2024.406
The primary goal of green development is to improve the overall welfare associated with sustainable practices. The digital economy has a dual effect on regional green development. This study systematically analyzes the theoretical mechanisms through which the digital economy influences green development welfare. An empirical assessment was conducted using panel data from 36 resource cities in the Yellow River Basin for the years 2013 to 2022, employing both the double-fixed effect model and spatial Durbin model. The findings indicate that: (1) Regarding spatial and temporal evolution, the overall level of green development welfare is relatively low, showing a gradual upward trend over time, with a spatial distribution pattern characterized by medium and low levels, supplemented by a few high-level points. (2) The digital economy significantly enhances the level of regional green development welfare among resource cities in the Yellow River Basin, and this effect remains robust under testing. (3) Regarding heterogeneous effects, the digital economy plays a particularly important role in promoting welfare in growing resource cities. (4) Analysis of spatial spillover reveals that the digital economy has a positive spatial spillover effect on green development welfare, with both direct and total effects being significantly positive, although the indirect effect is significantly negative. These results can assist the region in synergizing the digital economy with green development welfare, thereby promoting a form of Chinese-style modernization that fosters harmonious coexistence between human beings and nature.
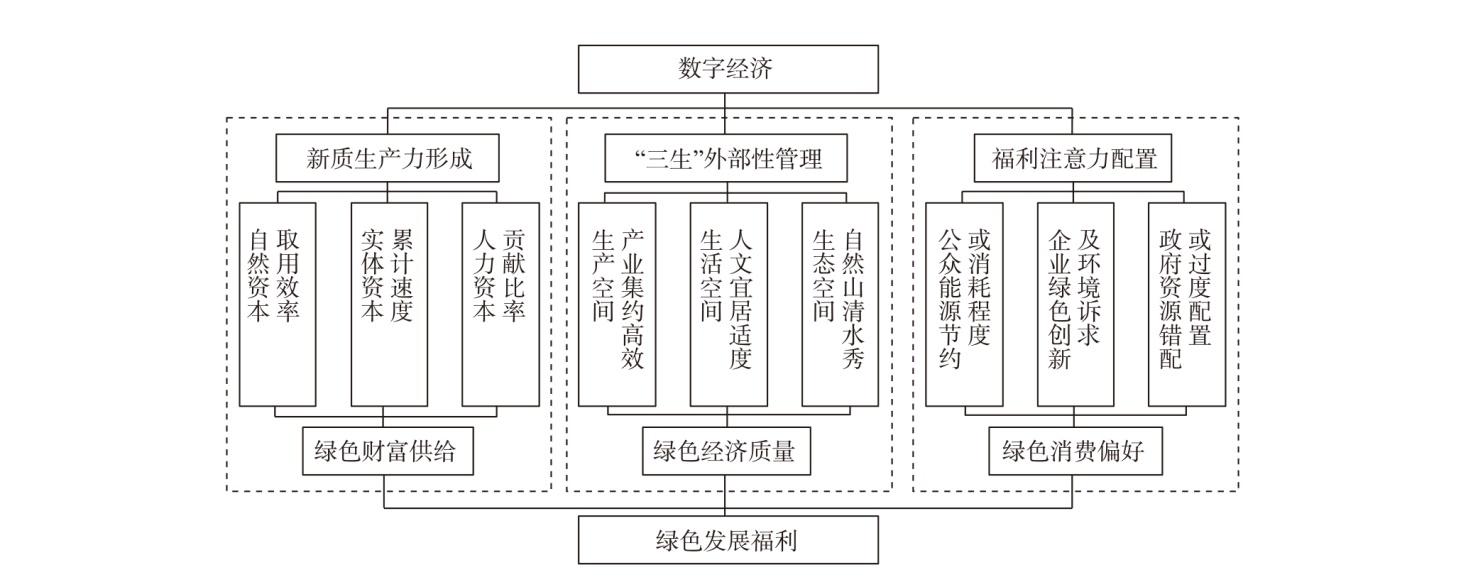
表1 黄河流域资源型城市绿色发展福利产出指标评价体系Tab. 1 Evaluation system of green development welfare output index of resource-based cities in the Yellow River Basin |
| 维度层 | 准则层 | 指标层 | 单位 | 属性 | 权重 |
|---|---|---|---|---|---|
| 绿色财富供给 | 自然资本取用 | 人均建设用地面积 | % | + | 0.0159 |
| 人均实有城市道路面积 | m3 | + | 0.0487 | ||
| 人均公园绿地面积 | m3 | + | 0.0587 | ||
| 实物资本累计 | 人均公交车拥有量 | 辆 | + | 0.0024 | |
| 人均医生数拥有量 | 人 | + | 0.0233 | ||
| 人均公共图书馆藏书量 | 本 | + | 0.1357 | ||
| 人力资本贡献 | 平均高等学校在校生人数 | 人 | + | 0.0026 | |
| 城镇登记失业率 | % | - | 0.0065 | ||
| 平均受教育年限 | 年 | + | 0.0148 | ||
| 绿色经济质量 | 生产空间产业 | 人均财政收入 | 元 | + | 0.0187 |
| 城镇居民人均可支配收入 | 元 | + | 0.0083 | ||
| 农村居民人均可支配收入 | 元 | + | 0.0364 | ||
| 生活空间人文 | 污水集中处理率 | % | + | 0.0034 | |
| 生活垃圾无害化处理率 | % | + | 0.0075 | ||
| 建成区绿化覆盖率 | % | + | 0.0079 | ||
| 生态空间自然 | 可吸入细颗粒物年平均质量浓度 | μg·m-3 | - | 0.0116 | |
| 工业固体废物综合利用率 | % | + | 0.0328 | ||
| 废气排放量(人均SO2、氮氧化物、颗粒物排放量) | t | - | 0.0008 | ||
| 绿色消费偏好 | 公众能源消耗 | 人均日生活用水量 | m3 | - | 0.0049 |
| 人均城镇居民生活用电量 | kW·h | - | 0.0019 | ||
| 人均能源消费量 | tce | - | 0.0011 | ||
| 企业绿色创新 | 区域创新能力指数 | 分 | + | 0.0114 | |
| 绿色发明专利申请数量 | 个 | + | 0.1394 | ||
| 绿色发明专利授权数量 | 个 | + | 0.1552 | ||
| 政府注意配置 | 环境基础设施建设投资额占比 | % | + | 0.2260 | |
| 政府工作报告环保词频占比 | % | + | 0.0155 | ||
| 比上年政府工作报告环保词频增长率 | % | + | 0.0086 |
注:+、-分别表示正向指标、负向指标。 |
表2 描述性统计Tab. 2 Descriptive statistics |
| 类型 | 变量名称 | 变量符号 | 平均值 | 标准差 | 最小值 | 最大值 | 观测值 |
|---|---|---|---|---|---|---|---|
| 因变量 | 绿色发展福利 | lnGDB | -1.2684 | 0.3286 | -2.0104 | -0.4343 | 360 |
| 自变量 | 数字经济发展水平 | lnDE | -1.4678 | 0.5596 | -2.9978 | -0.2626 | 360 |
| 控制变量 | 经济发展水平 | lnGdp | 10.8954 | 0.5559 | 9.5957 | 12.4565 | 360 |
| 金融发展水平 | lnFinance | 1.2833 | 1.0528 | 0.1199 | 3.7154 | 360 | |
| 城市化水平 | lnUrban | 8.2178 | 0.7182 | 5.8972 | 9.3966 | 360 | |
| 对外开放程度 | lnFdi | -6.6600 | 1.9020 | -14.8008 | -1.5709 | 360 | |
| 产业结构 | lnIs | 0.0381 | 0.5593 | -1.5102 | 1.2363 | 360 |
表3 黄河流域资源型城市绿色发展福利的标准差椭圆参数Tab. 3 Standard deviation ellipse parameters of green development benefits of resource-based cities in the Yellow River Basin |
| 年份 | 方位角/(°) | 长半轴/km | 短半轴/km | 面积/104 km2 | 形状指数 |
|---|---|---|---|---|---|
| 2013 | 70.4103 | 10.3718 | 5.3966 | 175.7546 | 0.4797 |
| 2014 | 98.5615 | 6.3725 | 2.9659 | 59.3463 | 0.5346 |
| 2015 | 98.2388 | 6.2751 | 2.9313 | 57.7569 | 0.5329 |
| 2016 | 97.7060 | 6.4474 | 2.6742 | 54.1382 | 0.5852 |
| 2017 | 97.7433 | 6.5806 | 2.6603 | 54.9710 | 0.5957 |
| 2018 | 97.8611 | 6.3798 | 2.6781 | 53.6498 | 0.5802 |
| 2019 | 97.8049 | 6.3607 | 2.6836 | 53.5990 | 0.5781 |
| 2020 | 97.6724 | 6.3570 | 2.6476 | 52.8486 | 0.5835 |
| 2021 | 97.4576 | 6.4153 | 2.6364 | 53.1073 | 0.5890 |
| 2022 | 97.3658 | 6.3910 | 2.6429 | 53.0364 | 0.5865 |
表4 数字经济对区域绿色发展福利的影响Tab. 4 Impact of the digital economy on regional green development welfare |
| 变量 | 绿色发展福利 | |||||
|---|---|---|---|---|---|---|
| 双向固定效应 | 经济发展水平 | 金融发展水平 | 城市化水平 | 对外开放程度 | 产业结构 | |
| lnDE | 0.068*** | 0.069*** | 0.068*** | 0.066*** | 0.067*** | 0.066*** |
| (0.020) | (0.021) | (0.021) | (0.021) | (0.021) | (0.021) | |
| lnGdp | - | 0.005 | 0.012 | 0.005 | 0.007 | 0.026 |
| (0.019) | (0.019) | (0.020) | (0.020) | (0.023) | ||
| lnFinance | - | - | -0.012* | -0.011* | -0.008 | -0.010 |
| (0.007) | (0.007) | (0.008) | (0.008) | |||
| lnUrban | - | - | - | -0.030* | -0.030* | -0.030* |
| (0.017) | (0.017) | (0.016) | ||||
| lnFdi | - | - | - | - | -0.004 | -0.003 |
| (0.005) | (0.005) | |||||
| lnIs | - | - | - | - | - | 0.030 |
| (0.018) | ||||||
| 常数项 | -1.211*** | -1.264*** | -1.334*** | -1.011*** | -1.057*** | -1.263*** |
| (0.036) | (0.204) | (0.208) | (0.273) | (0.279) | (0.306) | |
| 时间固定效应 | 是 | 是 | 是 | 是 | 是 | 是 |
| 城市固定效应 | 是 | 是 | 是 | 是 | 是 | 是 |
| 观测值 | 360 | 360 | 360 | 360 | 360 | 360 |
| R2 | 0.218 | 0.216 | 0.222 | 0.228 | 0.227 | 0.231 |
注:*、**、***分别表示P<0.1、P<0.05、P<0.01;括号内数值为t统计量;R2为模型的拟合优度。下同。 |
表5 稳健性检验回归结果Tab. 5 Regression results of robustness test |
| 变量 | 绿色发展福利 | |||
|---|---|---|---|---|
| 1%缩尾处理 | 更换被解 释变量 | 更换核心 解释变量 | 更换回 归模型 | |
| lnde_zc | - | - | 0.045** | - |
| (0.020) | - | |||
| lnDE | 0.064*** | 0.050** | - | 0.045** |
| (0.021) | (0.025) | (0.020) | ||
| lnGdp | 0.024 | -0.098*** | 0.018 | 0.045** |
| (0.023) | (0.028) | (0.023) | (0.020) | |
| lnFinance | -0.009 | 0.004 | -0.009 | 0.045** |
| (0.008) | (0.009) | (0.008) | (0.020) | |
| lnUrban | -0.034** | -0.014 | -0.023 | 0.045** |
| (0.017) | (0.020) | (0.017) | (0.020) | |
| lnFdi | -0.005 | -0.007 | -0.003 | 0.045** |
| (0.005) | (0.006) | (0.005) | (0.020) | |
| lnIs | 0.027 | -0.045** | 0.028 | 0.045** |
| (0.018) | (0.022) | (0.018) | (0.020) | |
| 常数项 | -1.224*** | -1.037*** | -1.314*** | 0.045** |
| (0.307) | (0.374) | (0.309) | (0.020) | |
| 时间固定效应 | 是 | 是 | 是 | - |
| 城市固定效应 | 是 | 是 | 是 | - |
| 观测值 | 360 | 360 | 360 | 360 |
| R2 | 0.230 | 0.562 | 0.219 | 0.215 |
表6 异质性分析回归结果Tab. 6 Heterogeneity analysis regression results |
| 变量 | 绿色发展福利 | |||
|---|---|---|---|---|
| 成长型 | 成熟型 | 衰退型 | 再生型 | |
| lnDE | 0.099*** | 0.043 | 0.101 | 0.041 |
| (0.035) | (0.028) | (0.071) | (0.115) | |
| lnGdp | 0.145*** | -0.014 | -0.042 | 0.142 |
| (0.042) | (0.035) | (0.067) | (0.141) | |
| lnFinance | -0.033 | 0.015 | -0.012 | -0.001 |
| (0.021) | (0.011) | (0.029) | (0.038) | |
| lnUrban | -0.006 | -0.024 | 0.058 | -0.438* |
| (0.036) | (0.025) | (0.049) | (0.232) | |
| lnFdi | 0.005 | -0.007 | -0.019 | 0.033* |
| (0.017) | (0.006) | (0.017) | (0.019) | |
| lnIs | 0.096*** | 0.028 | -0.198** | -0.133 |
| (0.035) | (0.023) | (0.092) | (0.116) | |
| 常数项 | -2.699*** | -0.994** | -1.392 | 1.222 |
| (0.657) | (0.429) | (0.839) | (2.366) | |
| 时间固定效应 | 是 | 是 | 是 | 是 |
| 城市固定效应 | 是 | 是 | 是 | 是 |
| 观测值 | 70 | 190 | 60 | 40 |
| R2 | 0.380 | 0.339 | 0.288 | 0.386 |
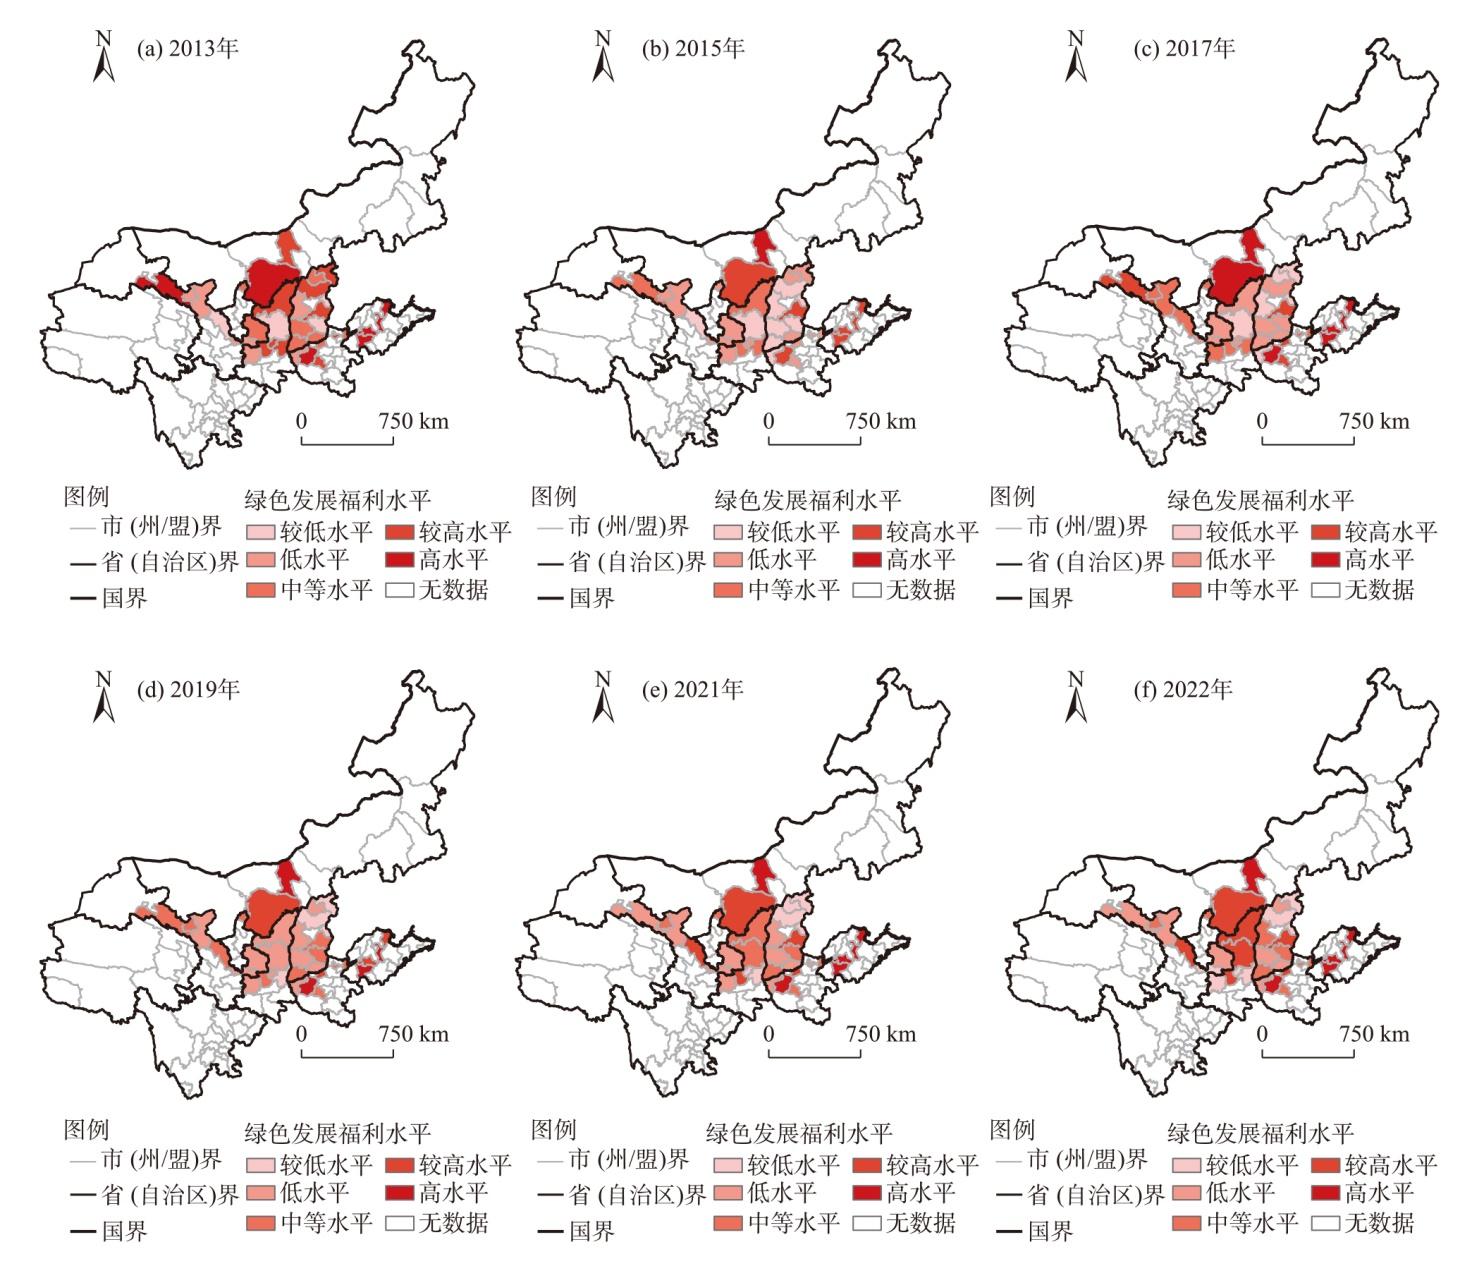
表7 黄河流域资源型城市绿色发展福利的全局Moran’s ITab. 7 Global Moran's I of green development welfare of resource-based cities in the Yellow River Basin |
| 年份 | Moran’s I | Z值 | P值 |
|---|---|---|---|
| 2013 | 0.072 | 3.702 | 0.000 |
| 2014 | 0.045 | 2.702 | 0.007 |
| 2015 | 0.056 | 3.126 | 0.002 |
| 2016 | 0.111 | 5.044 | 0.000 |
| 2017 | 0.115 | 5.210 | 0.000 |
| 2018 | 0.107 | 4.925 | 0.000 |
| 2019 | 0.102 | 4.731 | 0.000 |
| 2020 | 0.127 | 5.643 | 0.000 |
| 2021 | 0.122 | 5.440 | 0.000 |
| 2022 | 0.102 | 4.668 | 0.000 |
表8 空间效应及溢出效应回归结果Tab. 8 Regression results of spatial effect and spillover effect |
| 变量 | 绿色发展福利 | |||||
|---|---|---|---|---|---|---|
| 空间杜宾模型 | 空间误差模型 | 空间滞后模型 | 直接效应 | 间接效应 | 总效应 | |
| lnDE | 0.0650** | 0.0637*** | 0.0638*** | 0.0650*** | -0.0256* | 0.0394** |
| (3.28) | (3.31) | (3.39) | (3.35) | (-2.31) | (2.63) | |
| lnGdp | 0.0346 | 0.0300 | 0.0280 | 0.0274 | -0.0108 | 0.0166 |
| (1.59) | (1.40) | (1.33) | (1.35) | (-1.22) | (1.26) | |
| lnFinance | -0.00956 | -0.0108 | -0.0104 | -0.00968 | 0.00388 | -0.00581 |
| (-1.35) | (-1.56) | (-1.48) | (-1.43) | (1.25) | (-1.36) | |
| lnUrban | -0.0289 | -0.0306* | -0.0307* | -0.0313* | 0.0124 | -0.0188 |
| (-1.84) | (-1.99) | (-2.04) | (-2.12) | (1.74) | (-1.95) | |
| lnFdi | -0.00328 | -0.00258 | -0.00299 | -0.00322 | 0.00127 | -0.00195 |
| (-0.74) | (-0.59) | (-0.68) | (-0.78) | (0.73) | (-0.74) | |
| lnIs | 0.0335 | 0.0336* | 0.0329* | 0.0336* | -0.0134 | 0.0201 |
| (1.92) | (1.97) | (1.97) | (2.05) | (-1.67) | (1.89) | |
| 观测值 | 360 | 360 | 360 | - | - | - |
| Loglikelihood | 289.8019 | 287.3982 | 287.4594 | - | - | - |
| R2 | 0.187 | 0.137 | 0.161 | - | - | - |
注:Loglikelihood为模型的对数似然值。 |
| [1] |
张帆, 王丹. 习近平新时代生态民生观的三维论析[J]. 大连理工大学学报(社会科学版), 2023, 44(3): 10-17.
[
|
| [2] |
胡鞍钢, 黄鑫. 中国式现代化与绿色发展[J]. 北京工业大学学报(社会科学版), 2024, 24(5): 1-20.
[
|
| [3] |
陆凤芝, 叶柔光, 陶志富. 数字金融如何影响绿色发展福利: 机制与检验[J]. 郑州大学学报(哲学社会科学版), 2024, 57(2): 87-94.
[
|
| [4] |
庞瑞芝, 王宏鸣. 数字经济与城市绿色发展: 赋能还是负能?[J]. 科学学研究, 2024, 42(7): 1397-1408.
[
|
| [5] |
孙三百, 洪俊杰. 城市规模与居民福利——基于阿玛蒂亚·森的可行能力视角[J]. 统计研究, 2022, 39(7): 114-124.
[
|
| [6] |
|
| [7] |
钟水映, 冯英杰. 中国省际间绿色发展福利测量与评价[J]. 中国人口·资源与环境, 2017, 27(9): 196-204.
[
|
| [8] |
徐晔, 喻家驹, 杨聪. 长三角地区城市绿色发展福利的时空差异与驱动因素研究[J]. 江西师范大学学报(自然科学版), 2022, 46(2): 180-189.
[
|
| [9] |
袁华锡, 封亦代, 罗翔勇, 等. 制造业集聚如何影响区域绿色发展福利?[J]. 中国人口·资源与环境, 2022, 32(5): 68-83.
[
|
| [10] |
郭庆宾, 熊婉淑. 生态文明先行示范区建设如何影响绿色发展福利?[J]. 中国人口·资源与环境, 2023, 33(7): 18-29.
[
|
| [11] |
吉泽男, 付文婷, 王鹏程, 等. 干旱区数字经济与农业绿色发展耦合协调研究——以新疆为例[J]. 干旱区地理, 2024, 47(11): 1981-1990.
[
|
| [12] |
韩晶, 陈曦, 冯晓虎. 数字经济赋能绿色发展的现实挑战与路径选择[J]. 改革, 2022(9): 11-23.
[
|
| [13] |
蔡昉. 如何利用数字经济促进共同富裕?[J]. 东岳论丛, 2023, 44(3): 118-124, 192.
[
|
| [14] |
祝树金, 张谦, 李江, 等. 数字产品贸易自由化的福利效应及渠道机制研究——来自《信息技术协议》扩表的证据[J]. 管理世界, 2023, 39(12): 1-19.
[
|
| [15] |
黄险峰, 付成林, 高鑫. 数字经济的社会福利效应及其机制——来自中国城市的空间和门槛证据[J]. 经济与管理评论, 2023, 39(5): 124-137.
[
|
| [16] |
|
| [17] |
郭娜, 邢玉娜. 空间效应视角下数字经济对产业结构优化升级的影响研究[J]. 创新科技, 2024, 24(5): 51-67.
[
|
| [18] |
廖显春, 李小慧, 施训鹏. 绿色投资对绿色福利的影响机制研究[J]. 中国人口·资源与环境, 2020, 30(2): 148-157.
[
|
| [19] |
韩晶, 陈曦. 数字经济赋能绿色发展: 内在机制与经验证据[J]. 经济社会体制比较, 2022(2): 73-84.
[
|
| [20] |
胡鞍钢, 周绍杰. 绿色发展: 功能界定、机制分析与发展战略[J]. 中国人口·资源与环境, 2014, 24(1): 14-20.
[
|
| [21] |
|
| [22] |
何大安. 互联网应用扩张与微观经济学基础——基于未来“数据与数据对话”的理论解说[J]. 经济研究, 2018(8): 177-192.
[
|
| [23] |
陈美景, 王庆日, 白中科, 等. 基于双碳目标的黄河流域资源型城市国土空间利用效率时空特征及影响因素[J]. 中国土地科学, 2024, 38(4): 101-112.
[
|
| [24] |
曹卫芳, 薛天培, 崔云昊. 黄河流域资源型城市转型的时空格局演变及影响因素研究[J]. 经济问题, 2023(12): 108-114.
[
|
| [25] |
刘耀彬, 郭燕, 肖小东, 等. 韧性视角下资源型城市经济转型能力类型划分与转换规律——以30个煤炭城市为例[J]. 干旱区资源与环境, 2023, 37(11): 48-56.
[
|
| [26] |
董洁芳, 张凯莉, 屈学书, 等. 黄河流域城市生态福利绩效测算及驱动因素研究[J]. 干旱区地理, 2023, 46(5): 834-845.
[
|
| [27] |
杨耀武, 张平. 中国经济高质量发展的逻辑、测度与治理[J]. 经济研究, 2021, 56(1): 26-42.
[
|
| [28] |
杨爱婷, 宋德勇. 中国社会福利水平的测度及对低福利增长的分析——基于功能与能力的视角[J]. 数量经济技术经济研究, 2012, 29(11): 3-17, 148.
[
|
| [29] |
邹伟勇, 许玲丽. 中国共同富裕的测度、区域差异及动态演化[J]. 地理科学, 2024, 44(1): 71-81.
[
|
| [30] |
林艳丽, 江润泽, 刘嘉卿. 东北经济高质量发展水平测度、动态演进与地区差异[J]. 当代经济研究, 2024, 344(4): 116-128.
[
|
| [31] |
柳毅, 赵轩, 毛峰. 数字经济驱动共同富裕的发展动力与空间溢出效应研究——基于长三角面板数据和空间杜宾模型[J]. 中国软科学, 2023, 23(4): 98-108.
[
|
| [32] |
赵涛, 张智, 梁上坤. 数字经济、创业活跃度与高质量发展——来自中国城市的经验证据[J]. 管理世界, 2020, 36(10): 65-76.
[
|
| [33] |
阎晓, 涂建军. 黄河流域资源型城市生态效率时空演变及驱动因素[J]. 自然资源学报, 2021, 36(1): 223-239.
[
|
| [34] |
余建辉, 李佳洺, 张文忠. 中国资源型城市识别与综合类型划分[J]. 地理学报, 2018, 73(4): 677-687.
[
|
/
| 〈 |
|
〉 |