
|
薛晨浩(1988-),男,博士研究生,讲师,主要从事区域经济韧性等方面的研究. E-mail: xuechenhaovip@126.com |
收稿日期: 2024-08-24
修回日期: 2024-11-24
网络出版日期: 2026-03-11
基金资助
国家社会科学基金项目(22BMZ068)
国家自然科学基金项目(40771054)
中央高校基本科研业务费项目(31920220165)
Spatio-temporal differentiation of economic resilience in the Yellow River region based on multidimensional evaluation methods
Received date: 2024-08-24
Revised date: 2024-11-24
Online published: 2026-03-11
薛晨浩 , 白永平 , 王生鹏 . 基于多维评价方法的沿黄地区经济韧性时空分异规律[J]. 干旱区地理, 2025 , 48(6) : 1103 -1114 . DOI: 10.12118/j.issn.1000-6060.2024.512
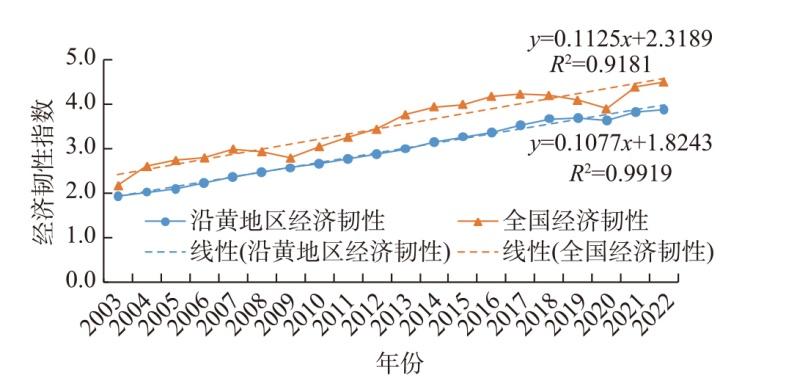
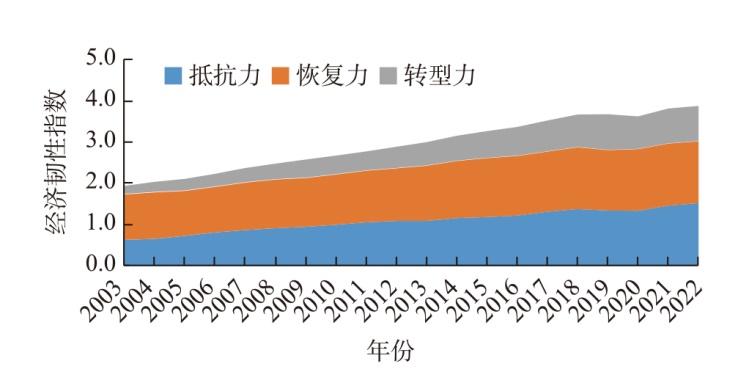
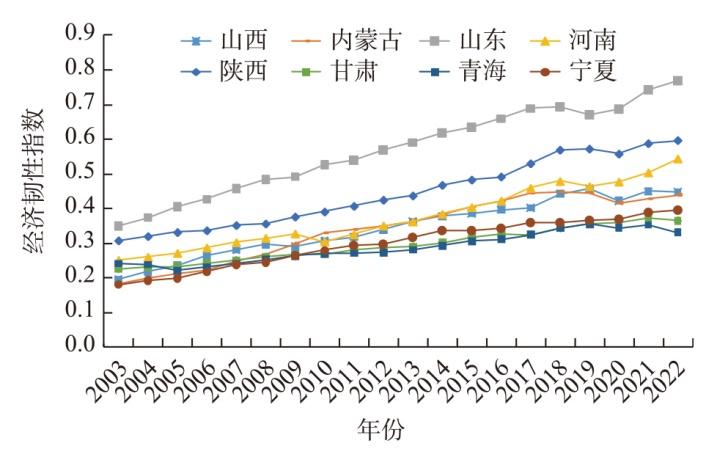
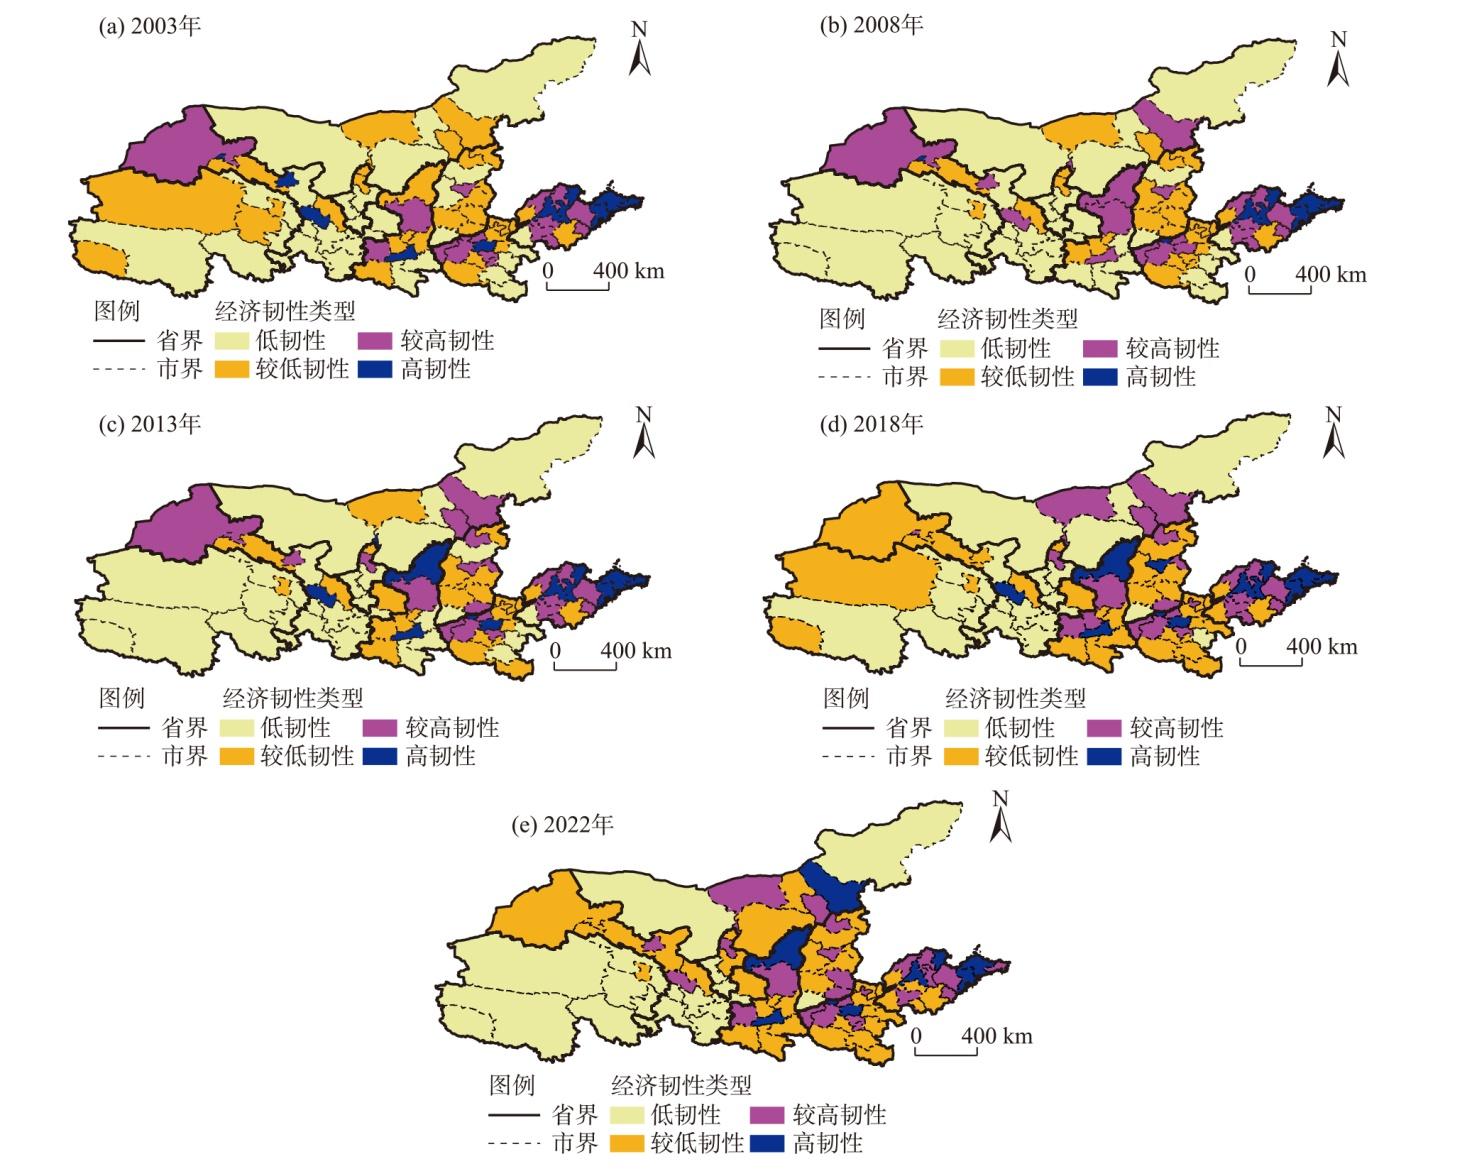
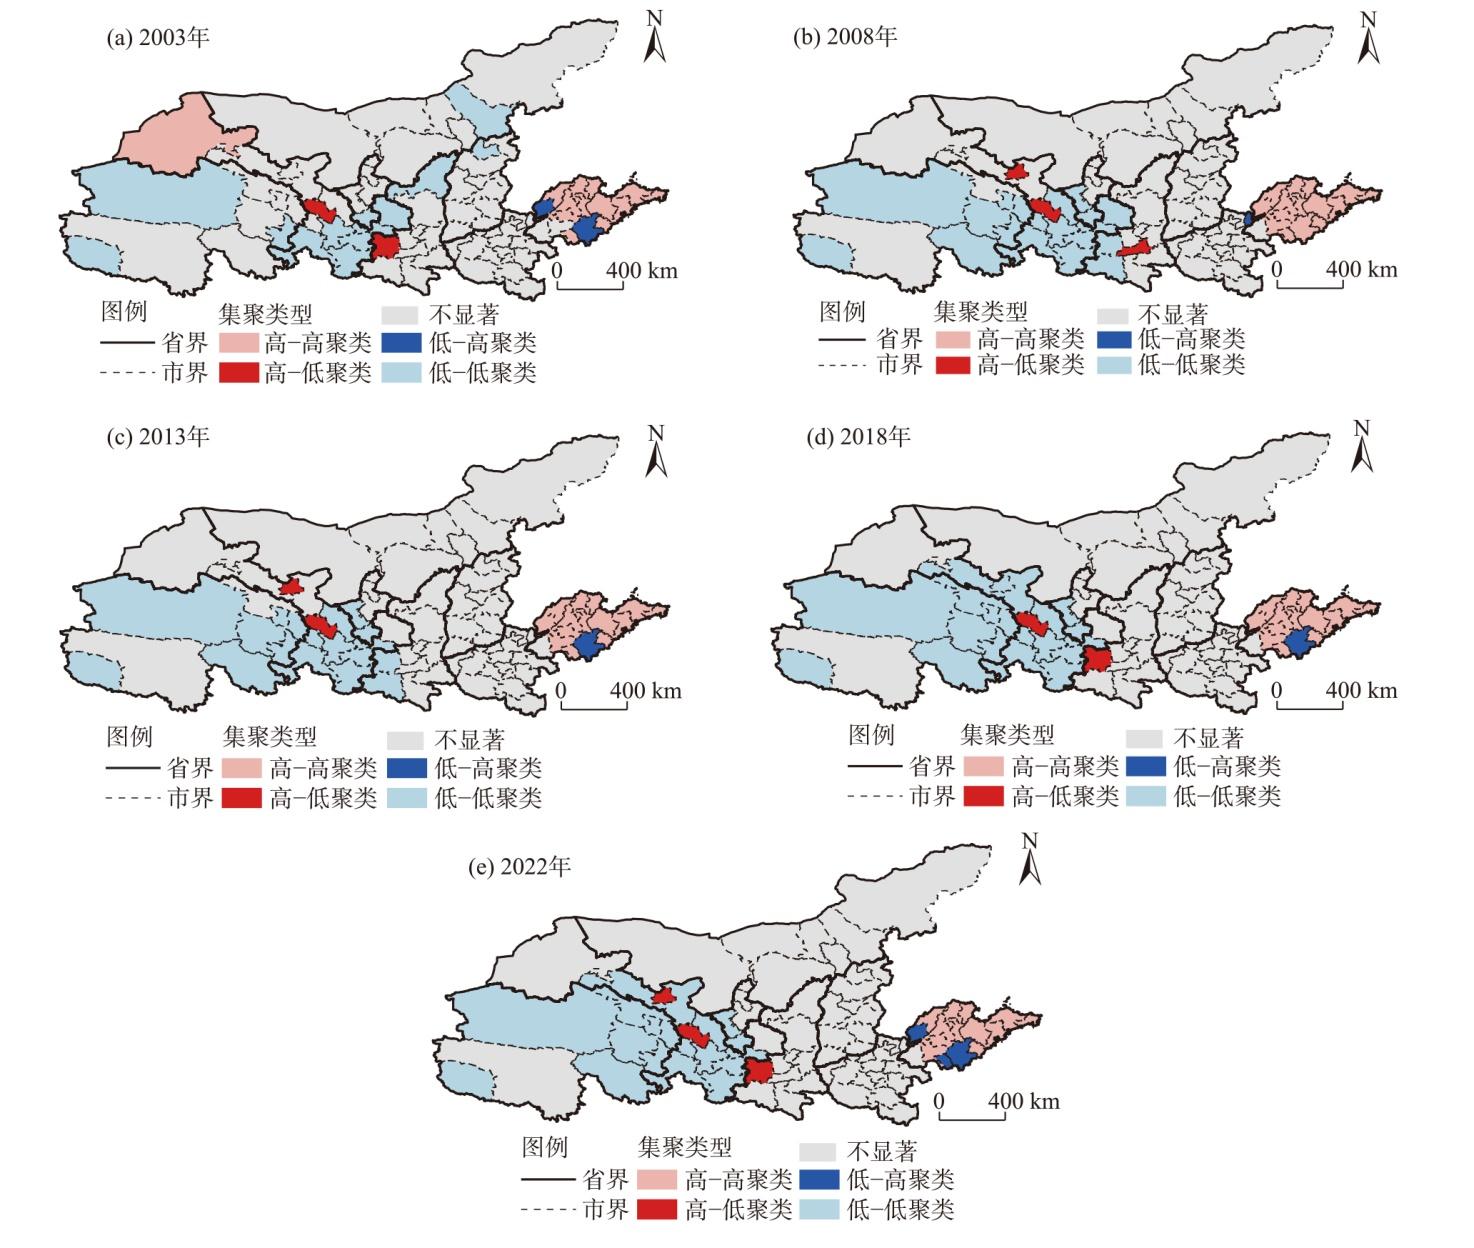
Scientifically measuring economic resilience in the Yellow River region is essential for enhancing regional development quality and sustainability. This study constructed a comprehensive indicator system to evaluate economic resilience across the Yellow River region from 2003 to 2022, examining three critical dimensions: Resistance, resilience, and transformation. We employed the Theil index to quantify regional disparities and the Moran’s index to analyze spatial correlation patterns. Our analysis revealed four key findings: (1) Regional performance: The Yellow River region demonstrated stable economic operation with strong overall resilience during the study period, though a significant gap persists compared to national economic resilience levels. Among the dimensional subsystems, resilience scored highest while transformation scored lowest. (2) Spatial distribution: Economic resilience exhibits a clear center-periphery structure at the prefecture level. Higher resilience areas are concentrated in the Shandong Peninsula, provincial capitals in central and western China, and mineral-rich cities. Lower resilience characterizes Qinghai, Ningxia, most of Gansu, Shaanxi, Henan, western Inner Mongolia, and western Shandong. (3) Temporal trends: The overall difference in economic resilience across the Yellow River region showed a decreasing trend over most of the study year. Regional differences contributed more than 75% to overall inequality, highlighting the need for coordinated intra-regional strategies. (4) Spatial correlation: Positive Moran’s index values throughout the study period indicate significant autocorrelation in economic resilience. Local spatial clustering revealed predominant “low-low” agglomeration (concentrated in Qinghai, Gansu, and Ningxia) and “high-high” agglomeration (primarily in Shandong).
表1 沿黄地区经济韧性评价指标体系Tab. 1 Evaluation index system for economic resilience in the Yellow River region |
| 目标层 | 系统层 | 准则层 | 指标层 | 单位 | 指标方向 |
|---|---|---|---|---|---|
| 沿黄地区经济韧性 | 抵抗力 | 经济发展水平 | 人均GDP | 元 | + |
| 人均固定资产投资 | 元 | + | |||
| 财政自给率 | % | + | |||
| 产业链结构与水平 | 制造业总产值 | 104元 | + | ||
| 第一产业增加值占GDP的比重 | % | - | |||
| 劳动密集型制造业产业链占比 | % | - | |||
| 恢复力 | 产业调整能力 | 地区工业规模 | 104元 | + | |
| 单位GDP能耗 | 104 tce | - | |||
| 产业结构高级化指数 | — | + | |||
| 产业结构多样化指数 | — | + | |||
| 经济普惠水平 | 人均可支配收入 | 元 | + | ||
| 外贸结构 | 外贸依存度 | % | + | ||
| 就业水平 | 就业人员占总人口比重 | % | + | ||
| 转型力 | 创新支撑能力 | R&D支出占GDP的比重 | % | + | |
| 规上工业企业有效专利数 | 件 | + | |||
| 高技术产业企业数 | 个 | + | |||
| 人力资本支持 | 万人在校大学生数 | 人 | + | ||
| 绿色转型能力 | 区域旅游收入 | 108元 | + |
表2 2003—2022年沿黄地区经济韧性泰尔指数及贡献率Tab. 2 Theil index and contribution rates of economic resilience in the Yellow River region from 2003 to 2022 |
| 年份 | 总体差异 | 区域间差异 | 区域间差异贡献率/% | 区域内差异 | 区域内差异贡献率/% | |||||||
|---|---|---|---|---|---|---|---|---|---|---|---|---|
| 总体 | 上游 | 中游 | 下游 | 总体 | 上游 | 中游 | 下游 | |||||
| 2003 | 0.22 | 0.03 | 15.82 | 0.18 | 0.09 | 0.03 | 0.07 | 84.18 | 39.93 | 11.76 | 32.49 | |
| 2004 | 0.22 | 0.04 | 19.24 | 0.18 | 0.08 | 0.03 | 0.07 | 80.76 | 35.05 | 12.03 | 33.68 | |
| 2005 | 0.22 | 0.05 | 20.92 | 0.18 | 0.07 | 0.03 | 0.08 | 79.08 | 32.54 | 11.89 | 34.65 | |
| 2006 | 0.21 | 0.05 | 22.48 | 0.16 | 0.07 | 0.03 | 0.07 | 77.52 | 31.16 | 13.36 | 33.00 | |
| 2007 | 0.20 | 0.05 | 22.87 | 0.16 | 0.06 | 0.03 | 0.07 | 77.13 | 29.49 | 14.25 | 33.38 | |
| 2008 | 0.20 | 0.04 | 22.04 | 0.15 | 0.06 | 0.03 | 0.06 | 77.96 | 30.30 | 15.21 | 32.45 | |
| 2009 | 0.16 | 0.02 | 12.83 | 0.14 | 0.07 | 0.03 | 0.04 | 87.17 | 42.07 | 18.19 | 26.91 | |
| 2010 | 0.16 | 0.02 | 11.72 | 0.14 | 0.07 | 0.03 | 0.05 | 88.28 | 41.00 | 16.56 | 30.72 | |
| 2011 | 0.15 | 0.02 | 11.47 | 0.14 | 0.07 | 0.03 | 0.04 | 88.53 | 43.35 | 16.47 | 28.72 | |
| 2012 | 0.15 | 0.02 | 13.45 | 0.13 | 0.06 | 0.03 | 0.04 | 86.55 | 41.52 | 16.90 | 28.13 | |
| 2013 | 0.15 | 0.02 | 16.58 | 0.12 | 0.06 | 0.02 | 0.04 | 83.42 | 39.64 | 15.21 | 28.57 | |
| 2014 | 0.14 | 0.03 | 20.20 | 0.11 | 0.05 | 0.02 | 0.04 | 79.80 | 35.76 | 15.06 | 28.99 | |
| 2015 | 0.13 | 0.03 | 21.84 | 0.10 | 0.05 | 0.02 | 0.04 | 78.16 | 35.30 | 13.43 | 29.43 | |
| 2016 | 0.13 | 0.03 | 21.97 | 0.10 | 0.05 | 0.02 | 0.04 | 78.03 | 35.69 | 13.55 | 28.79 | |
| 2017 | 0.14 | 0.03 | 24.34 | 0.11 | 0.05 | 0.02 | 0.04 | 75.66 | 33.98 | 14.25 | 27.43 | |
| 2018 | 0.13 | 0.03 | 22.69 | 0.10 | 0.05 | 0.02 | 0.04 | 77.31 | 34.99 | 13.87 | 28.45 | |
| 2019 | 0.12 | 0.03 | 21.97 | 0.09 | 0.04 | 0.02 | 0.03 | 78.03 | 36.21 | 15.01 | 26.82 | |
| 2020 | 0.11 | 0.03 | 22.95 | 0.09 | 0.04 | 0.02 | 0.03 | 77.05 | 34.24 | 14.68 | 28.13 | |
| 2021 | 0.12 | 0.03 | 21.46 | 0.09 | 0.04 | 0.02 | 0.03 | 78.54 | 36.11 | 15.77 | 26.66 | |
| 2022 | 0.13 | 0.03 | 21.61 | 0.10 | 0.05 | 0.02 | 0.03 | 78.39 | 37.92 | 17.06 | 23.41 | |
表3 2003—2022年沿黄地区经济韧性的全局莫兰指数Tab. 3 Global Moran’s I of economic resilience in the Yellow River region from 2003 to 2022 |
| 年份 | Moran’s I | P值 | 年份 | Moran’s I | P值 |
|---|---|---|---|---|---|
| 2003 | 0.19 | 0.000 | 2013 | 0.20 | 0.000 |
| 2004 | 0.22 | 0.000 | 2014 | 0.22 | 0.000 |
| 2005 | 0.24 | 0.000 | 2015 | 0.22 | 0.000 |
| 2006 | 0.25 | 0.000 | 2016 | 0.22 | 0.000 |
| 2007 | 0.27 | 0.000 | 2017 | 0.23 | 0.000 |
| 2008 | 0.29 | 0.000 | 2018 | 0.21 | 0.000 |
| 2009 | 0.16 | 0.000 | 2019 | 0.14 | 0.000 |
| 2010 | 0.18 | 0.000 | 2020 | 0.17 | 0.000 |
| 2011 | 0.17 | 0.000 | 2021 | 0.18 | 0.000 |
| 2012 | 0.18 | 0.000 | 2022 | 0.20 | 0.000 |
| [1] |
|
| [2] |
|
| [3] |
|
| [4] |
|
| [5] |
|
| [6] |
|
| [7] |
贺灿飞, 盛涵天. 区域经济韧性: 研究综述与展望[J]. 人文地理, 2023, 38(1): 1-10.
[
|
| [8] |
|
| [9] |
|
| [10] |
陈梦远. 国际区域经济韧性研究进展——基于演化论的理论分析框架介绍[J]. 地理科学进展, 2017, 36(11): 1435-1444.
[
|
| [11] |
|
| [12] |
|
| [13] |
胡晓辉, 董柯, 杨宇. 战略耦合演化视角下的区域经济韧性分析框架[J]. 地理研究, 2021, 40(12): 3272-3286.
[
|
| [14] |
生延超, 谭左思, 李倩, 等. 数字经济能否促进黄河流域旅游经济韧性提升?[J]. 干旱区地理, 2023, 46(10): 1704-1713.
[
|
| [15] |
王松茂, 牛金兰. 山东省旅游经济与城市生态韧性协同演化研究[J]. 地理学报, 2023, 78(10): 2591-2608.
[
|
| [16] |
朱静敏, 卢小丽. 数字经济提升旅游经济韧性的作用机制及空间效应[J]. 地理科学进展, 2024, 43(10): 2004-2020.
[
|
| [17] |
张路, 林国栋, 吕晓. 产业结构升级视角下城市经济韧性空间分异及其驱动因素[J]. 地理科学, 2024, 44(9): 1577-1586.
[
|
| [18] |
谭俊涛, 赵宏波, 刘文新, 等. 中国区域经济韧性特征与影响因素分析[J]. 地理科学, 2020, 40(2): 173-181.
[
|
| [19] |
宁静, 朱冉, 张馨元, 等. 内蒙古区县城市韧性评价与分析[J]. 干旱区地理, 2023, 46(7): 1217-1226.
[
|
| [20] |
关皓明, 杨青山, 浩飞龙, 等. 基于“产业-企业-空间”的沈阳市经济韧性特征[J]. 地理学报, 2021, 76(2): 415-427.
[
|
| [21] |
李博, 曲艺. 中国沿海地区产业演化路径依赖及突破对区域经济韧性的影响[J]. 地理学报, 2023, 78(4): 824-839.
[
|
| [22] |
彭荣熙, 刘涛, 曹广忠. 中国东部沿海地区城市经济韧性的空间差异及其产业结构解释[J]. 地理研究, 2021, 40(6): 1732-1748.
[
|
| [23] |
李连刚, 张平宇, 程钰, 等. 黄河流域经济韧性时空演变与影响因素研究[J]. 地理科学, 2022, 42(4): 557-567.
[
|
| [24] |
仇方道, 尹鹏星, 谭俊涛, 等. 沿海城市经济韧性演化特征及影响机理——以连云港市为例[J]. 地理科学, 2023, 43(11): 1944-1955.
[
|
| [25] |
张学波, 吴江楠, 王振波, 等. 中国地级以上城市医疗服务韧性的时空分异与驱动力分析[J]. 地理科学进展, 2024, 43(7): 1273-1289.
[
|
| [26] |
叶飞文. 经济韧性测度指标体系设计与实证研究[J]. 调研世界, 2024(11): 17-26.
[
|
| [27] |
齐昕, 张景帅, 徐维祥. 浙江省县域经济韧性发展评价研究[J]. 浙江社会科学, 2019(5): 40-46.
[
|
| [28] |
刘晓星, 张旭, 李守伟. 中国宏观经济韧性测度——基于系统性风险的视角[J]. 中国社会科学, 2021(1): 12-32.
[
|
| [29] |
胡志强, 苗长虹, 熊雪蕾, 等. 产业集聚对黄河流域工业韧性的影响研究[J]. 地理科学, 2021, 41(5): 824-831.
[
|
| [30] |
孙久文, 陈超君, 孙铮. 黄河流域城市经济韧性研究和影响因素分析——基于不同城市类型的视角[J]. 经济地理, 2022, 42(5): 1-10.
[
|
| [31] |
张跃胜, 谭宇轩, 金文俊. 黄河流域城市经济韧性影响因素分析与路径识别: 基于动态QCA的考察[J]. 现代财经(天津财经大学学报), 2024, 44(3): 37-53.
[
|
| [32] |
叶文显. 黄河流域经济韧性的时空演变特征与影响因素[J]. 统计与决策, 2024, 40(17): 132-137.
[
|
| [33] |
王兆峰, 张先甜. 黄河流域旅游经济系统韧性的时空差异特征及其影响因素[J]. 地理与地理信息科学, 2023, 39(3): 112-121.
[
|
| [34] |
周文慧, 钞小静. 黄河流域数字基础设施、经济发展韧性与生态环境保护的耦合协调发展分析——基于三元系统耦合协调模型[J]. 干旱区资源与环境, 2023, 37(9): 1-9.
[
|
| [35] |
史佳璐. 绿色发展视域下黄河流域城市群经济韧性研究[D]. 济南: 山东师范大学, 2023.
[
|
| [36] |
|
| [37] |
刘虹, 薛东前, 马蓓蓓. 基于ESDA分析的关中城市群县域经济空间分析研究[J]. 干旱区资源与环境, 2012, 26(4): 55-60.
[
|
| [38] |
张学波, 李亚宁, 马海涛, 等. 基于适应性循环的环渤海地区经济韧性演化分异机制[J]. 地理研究, 2024, 43(5): 1126-1145.
[
|
| [39] |
杨永春, 穆焱杰, 张薇. 黄河流域高质量发展的基本条件与核心策略[J]. 资源科学, 2020, 42(3): 409-423.
[
|
| [40] |
任保平, 邹起浩. 新发展阶段中国经济发展的韧性: 评价、影响因素及其维护策略[J]. 中国软科学, 2024(3): 15-25.
[
|
| [41] |
石玉堂, 王晓丹, 陈凯旋. 新质生产力与城市经济韧性: 理论逻辑与经验证据[J]. 重庆大学学报(社会科学版), 2024, 30(5): 29-45.
[
|
/
| 〈 |
|
〉 |