
|
王逸菲(2002-),女,硕士研究生,主要从事城市地理学和人口地理学研究. E-mail: yifeiwang2024@lzu.edu.cn |
收稿日期: 2024-11-09
修回日期: 2024-12-19
网络出版日期: 2026-03-11
基金资助
国家自然科学基金(42201198)
自然资源部陆表系统与人地关系重点实验室开放基金(LBXT2023YB09)
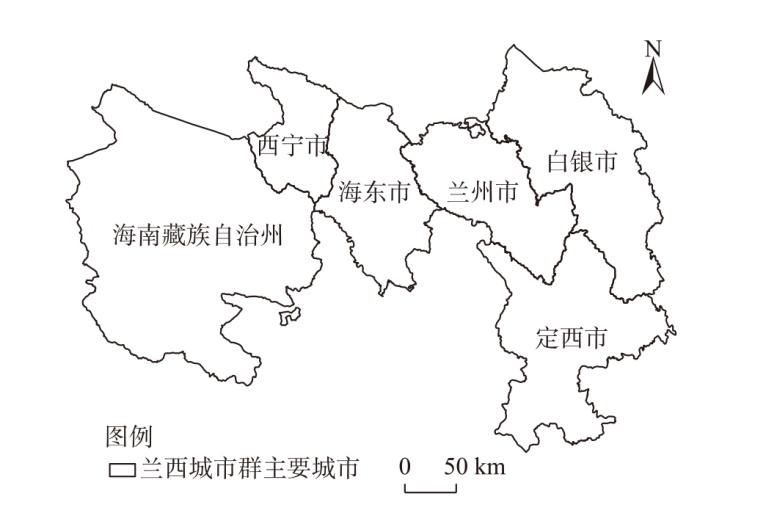
Impact and pathways of population growth-decline differentiation on urban economic resilience in the Lanzhou-Xining urban agglomeration
Received date: 2024-11-09
Revised date: 2024-12-19
Online published: 2026-03-11
王逸菲 , 孔德臻 , 罗宇煊 , 毛锦凰 , 王梅梅 . 人口增减分化对兰西城市群城市经济韧性的影响与作用路径[J]. 干旱区地理, 2025 , 48(6) : 1020 -1030 . DOI: 10.12118/j.issn.1000-6060.2024.692
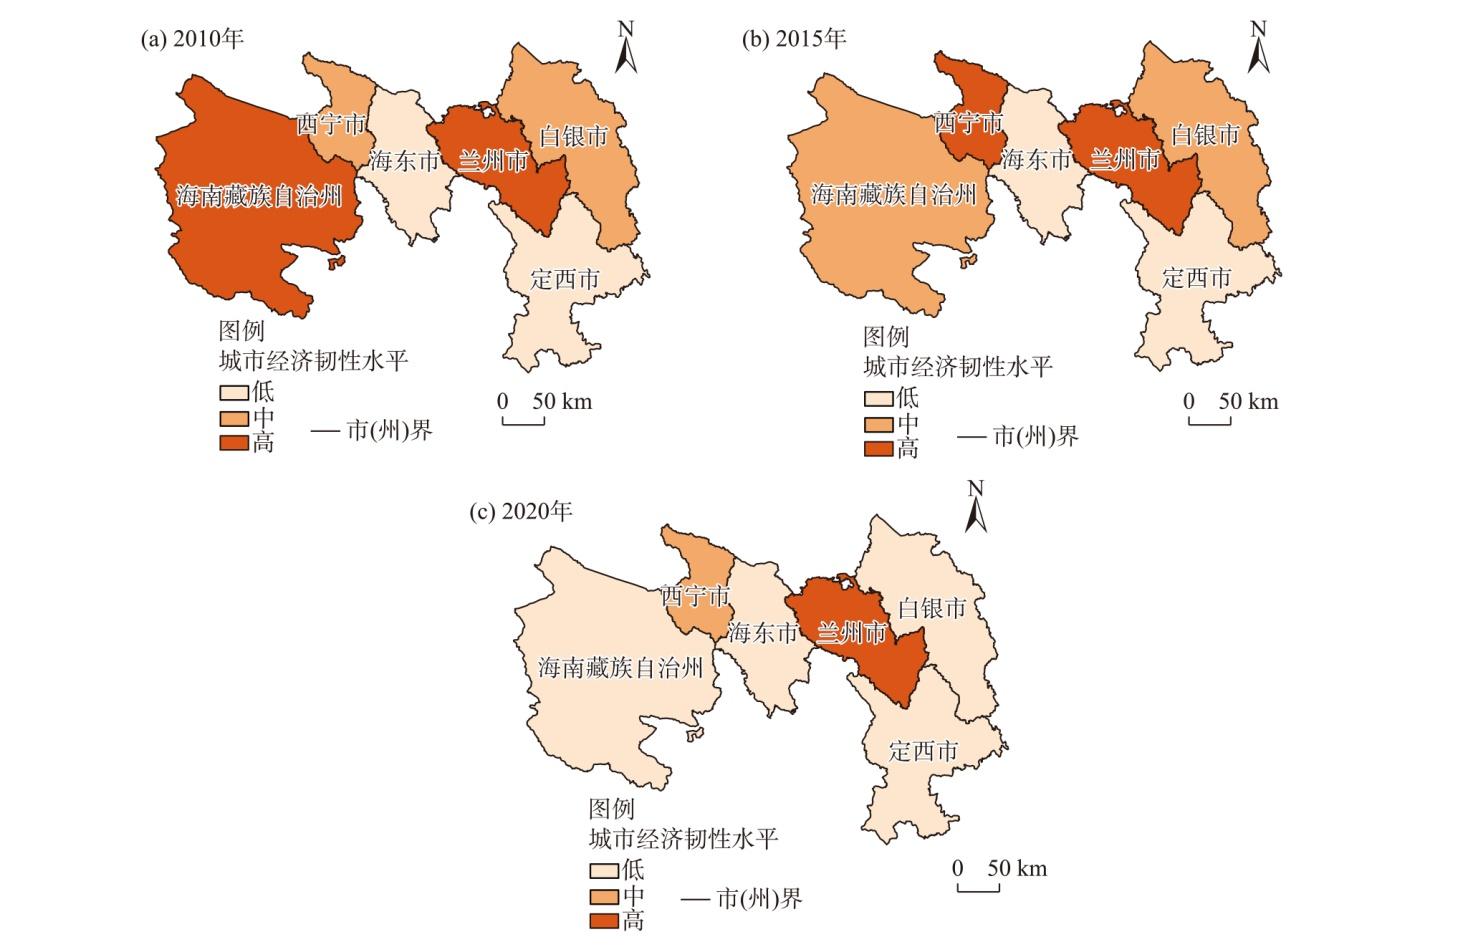
As China accelerates the construction of new development models and advances high-quality development, human capital has become a key driver of intercity competitiveness. In recent years, the Lanzhou-Xining urban agglomeration has experienced significant population decline and insufficient human capital competitiveness, which have directly weakened its urban economic resilience. This study examines six representative cities within the Lanzhou-Xining (Lanxi) urban agglomeration, employing a linear mixed-effects model to analyze the effects and mechanisms of differentiated population growth and decline on urban economic resilience in 2010, 2015, and 2020. The findings reveal the following characteristics of urban economic resilience in the Lanzhou-Xining urban agglomeration. (1) Between 2010 and 2020, urban economic resilience generally increased across the Lanxi region, forming a “core-edge” structure, with Lanzhou City and Xining City at the core and other cities at the periphery. (2) Variations in population growth significantly affected urban economic resilience, with population inflows exerting positive externalities on regional resilience. (3) The rationalization of the industrial structure did not moderate the impact of population change on urban economic resilience. In cities experiencing population loss, initial declines facilitated some degree of industrial restructuring; however, this mode of adjustment was not sustainable over time. (4) Population change also influenced the level of local informatization, which in turn affected urban economic resilience. Population growth supported the development of urban informatization, thereby strengthening urban economic resilience. Based on these findings, it is recommended to promote coordinated regional development, enhance human capital accumulation, accelerate industrial transformation and upgrading, and advance population policy in tandem with informatization initiatives to improve the economic resilience of major cities in the Lanzhou-Xining urban agglomeration.
表1 经济韧性评价指标体系Tab. 1 System of indicators for evaluating economic resilience |
| 维度 | 指标 | 说明 | 方向 |
|---|---|---|---|
| 经济稳定性 | 通胀率 | (本期CPI-上期CPI)/上期CPI | - |
| 人均GDP | GDP/常住人口 | + | |
| 城镇登记失业率 | 失业人口/适龄人口 | - | |
| 净出口与GDP比值 | (出口-进口)/GDP | + | |
| 财政赤字率 | (财政支出-财政收入)/GDP | - | |
| 经济创新性 | 教育经费投入 | 教育事业经费支出/常住人口 | + |
| 科技研发投入 | R&D经费支出/常住人口 | + | |
| 创新成果产出 | 专利申请量+专利授予量 | + | |
| 经济恢复性 | 人均固定资产投资额 | 固定资产投资总额/常住人口 | + |
| 人均社会消费品零售额 | 社会消费品零售总额/常住人口 | + | |
| 旅游人数 | 年度旅游总人次 | + | |
| GDP发展水平 | 名义GDP/CPI | + | |
| 私营企业和个体就业人数占比 | (私营企业就业人数+个体就业人数)/常住人口 | + | |
| 经济流通性 | 金融机构贷款余额 | 年度金融机构贷款余额 | + |
| 人均货运量 | 货运量/常住人口 | + |
注:CPI为居民消费价格指数;“+”表示该指标为正向指标,“-”表示该指标为逆向指标。 |
表2 兰西城市群主要城市的城市经济韧性Tab. 2 Urban economic resilience of major cities in the Lanzhou-Xining urban agglomeration |
| 城市 | 2010年 | 2015年 | 2020年 |
|---|---|---|---|
| 兰州市 | 0.244 | 0.537 | 0.689 |
| 西宁市 | 0.156 | 0.360 | 0.368 |
| 海南藏族自治州 | 0.271 | 0.204 | 0.221 |
| 海东市 | 0.056 | 0.141 | 0.197 |
| 定西市 | 0.042 | 0.108 | 0.145 |
| 白银市 | 0.118 | 0.177 | 0.224 |
表3 线性混合效应模型拟合结果Tab. 3 Linear mixed effects model fitting results |
| 模型 | 固定效应 | 随机效应 | 校正赤池 信息准则 | 对数 似然 | 固定效应 解释方差 | 总解释 方差 |
|---|---|---|---|---|---|---|
| a | 人口变动 | (截距|城市) | -2.504 | 9.508 | 0.778 | 0.778 |
| b | 人口变动 | (截距|年份) | -3.103 | 12.826 | 0.751 | 0.893 |
| c | 人口变动 | (截距|城市)+(截距|年份) | -2.504 | 9.508 | 0.778 | 0.889 |
注:(截距|城市)和(截距|年份)分别表示城市、年份的截距随机效应。下同。 |
表4 含随机效应的线性混合效应拟合结果Tab. 4 Linear mixed-effects fitting results with random effects |
| 参数 | (截距|城市)+(截距|年份) | (截距|城市) |
|---|---|---|
| 截距 | 0.232(0.001)*** | 0.232(0.021)*** |
| 人口变动 | -0.004(0.001)*** | -0.004(0.001)*** |
| 组间方差 | 0.004 | 0.005 |
注:括号内数值为参数估计值的标准误差;*、**、***分别表示在0.05、0.01、0.001水平上显著。下同。 |
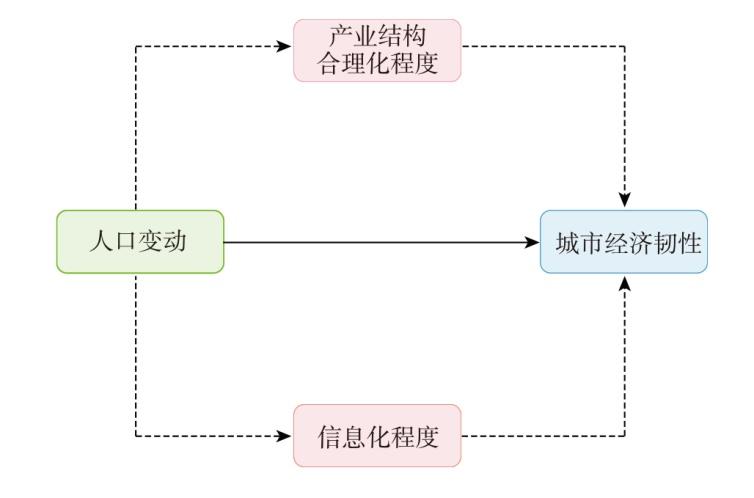
表5 中介效应分析结果Tab. 5 Results of the mediation effects analysis |
| 参数 | 模型1 | 标准化系数 | 模型2 | 标准化系数 | ||||||
|---|---|---|---|---|---|---|---|---|---|---|
| 回归系数 | 标准误 | t值 | 显著性 | 回归系数 | 标准误 | t值 | 显著性 | |||
| 截距 | 0.232** | 0.021 | 11.070 | 0.000 | - | 0.010 | 0.058 | 0.173 | 0.865 | - |
| 人口变动 | -0.004** | 0.001 | -6.514 | 0.000 | -0.852 | -0.003** | 0.001 | -4.547 | 0.000 | -0.724 |
| 产业结构合理化程度 | - | - | - | - | - | 0.125 | 0.101 | 1.232 | 0.238 | 0.172 |
| 信息化程度 | - | - | - | - | - | 0.178** | 0.049 | 3.671 | 0.003 | 0.434 |
表6 中介效应检验结果Tab. 6 Mediation effect test results |
| 中介路径 | 总效应 | 中介效应值 | 标准误 | Z值 | 显著性 | 95%置信区间 | 直接效应 |
|---|---|---|---|---|---|---|---|
| 产业结构合理化程度中介效应 | -0.004** | 0.001 | 0.124 | 0.004 | 0.997 | -0.053~0.437 | -0.003** |
| 信息化程度中介效应 | -0.004** | -0.001 | 0.105 | -0.010 | 0.992 | -0.449~-0.029 | -0.003** |
| [1] |
赵超, 刘红霞. 经济增速怎么看[N]. 人民日报, 2024-12-04(005).
[
|
| [2] |
陆铭, 向宽虎, 李鹏飞, 等. 分工与协调: 区域发展的新格局、新理论与新路径[J]. 中国工业经济, 2023(8): 5-22.
[
|
| [3] |
吴康, 戚伟. 收缩型城市: 认知误区、统计甄别与测算反思[J]. 地理研究, 2021, 40(1): 213-229.
[
|
| [4] |
王立奇. 中国城市生态韧性区域差异及影响因素研究[D]. 石家庄: 河北地质大学, 2024.
[
|
| [5] |
|
| [6] |
|
| [7] |
姜菁. 人口集聚对中国城市经济韧性的影响研究[D]. 济南: 山东师范大学, 2023.
[
|
| [8] |
|
| [9] |
|
| [10] |
吴康, 宋嘉卓, 陈艺文. 人口增长与收缩对城市经济韧性的影响机制——基于产业结构和人力资本的调节效应[J]. 资源科学, 2024, 46(2): 249-261.
[
|
| [11] |
孙铁山. 中国城市经济韧性和人口收缩——基于相关多样性和城际联系的解释[J]. 同济大学学报(社会科学版), 2024, 35(3): 63-74.
[
|
| [12] |
段汉明. 贫困的城市群带如何发展——黄河上游城镇密集区发展透视[J]. 城市规划, 2000, 24(11): 16-19.
[
|
| [13] |
|
| [14] |
齐昕, 张景帅, 徐维祥. 浙江省县域经济韧性发展评价研究[J]. 浙江社会科学, 2019(5): 40-46, 156.
[
|
| [15] |
许桂华, 陈海东. 粤港澳大湾区经济韧性的测度、时序演变及收敛性分析[J]. 当代经济, 2023, 40(5): 57-65.
[
|
| [16] |
宋玉茹, 董小君, 许诗源, 等. 中国经济韧性水平测度与时空格局演变分析[J]. 统计与决策, 2023, 39(9): 103-108.
[
|
| [17] |
蔡咏梅, 李新英, 孟令伟. 中国产业多样性、空间溢出与经济韧性[J]. 技术经济与管理研究, 2022(11): 118-123.
[
|
| [18] |
刘理欧. 东北地区人力资本变动的经济增长效应研究[D]. 沈阳: 辽宁大学, 2022.
[
|
| [19] |
李勋, 陈光宇. 人口聚集对城市经济韧性的影响研究——基于2010—2021年中国267个地级市差异性分析[J/OL]. 工程管理科技前沿. [2025-01-16]. http://kns.cnki.net/kcms/detail/34.1013.N.20241127.1844.004.html.
[
|
| [20] |
史玉芳, 牛玉. 关中平原城市群韧性空间关联网络及其影响因素研究[J]. 干旱区地理, 2024, 47(2): 270-280.
[
|
| [21] |
李连刚, 张平宇, 程钰, 等. 黄河流域经济韧性时空演变与影响因素研究[J]. 地理科学, 2022, 42(4): 557-567.
[
|
| [22] |
任保平. 从中国经济增长奇迹到经济高质量发展[J]. 政治经济学评论, 2022, 13(6): 3-34.
[
|
| [23] |
丁晨浩, 高鑫, 易兴. 长江经济带三大城市群经济韧性时空演变与影响因素研究——基于不同城市类型视角[J]. 长江流域资源与环境, 2025, 34(2): 280-294.
[
|
| [24] |
谢绚丽, 沈艳, 张皓星, 等. 数字金融能促进创业吗?——来自中国的证据[J]. 经济学(季刊), 2018, 17(4): 1557-1580.
[
|
| [25] |
施帆. 演化经济地理视角下的中国城市创业活动时空动态及影响因素研究[D]. 杭州: 浙江大学, 2021.
[
|
| [26] |
李研. 行业收入差距、产业结构升级与区域产业定位[J]. 山西财经大学学报, 2021, 43(1): 27-41.
[
|
| [27] |
于尚坤. 基于多源数据的中国城市收缩时空分异与驱动机制研究[D]. 济南: 山东师范大学, 2024.
[
|
| [28] |
陆丰刚. 人口流失影响了东北地区经济增长吗?——基于东北地区户籍人口流失测算数据[J]. 人口与发展, 2021, 27(5): 98-110, 120.
[
|
| [29] |
谢红雨, 伊继东, 甘建候. 云南民族文化旅游产业效益的SSA分析[J]. 中国人口·资源与环境, 2014, 24(增刊3): 238-241.
[
|
| [30] |
陈强远, 叶杨, 李晓萍. 中国区域人才政策的量化评价与时空演变[J]. 江苏社会科学, 2024(1): 166-175.
[
|
| [31] |
谢晓艺, 石培基, 张韦萍, 等. 兰西城市群产业生态化时空分异特征及驱动因素分析[J]. 兰州大学学报(自然科学版), 2022, 58(5): 668-677.
[
|
| [32] |
仇童伟. 精准扶贫、人口流动与地区经济差距[J]. 经济理论与经济管理, 2024, 44(4): 51-66.
[
|
| [33] |
陈实, 尚航标. 因地制宜发展新质生产力的财政政策激励研究[J]. 福建师范大学学报(哲学社会科学版), 2024(6): 66-76.
[
|
| [34] |
朱巧玲, 万春芳. 中国式现代化视域下数字经济与人口高质量发展[J]. 经济纵横, 2024(9): 57-65.
[
|
/
| 〈 |
|
〉 |