
|
米瑞华(1983-),女,博士,副教授,主要从事人口经济学、空间人口学研究. E-mail: rice221@163.com |
收稿日期: 2024-07-30
修回日期: 2024-10-12
网络出版日期: 2026-03-11
基金资助
国家社科基金一般项目(21BRK033)
Analysis of grid distribution characteristics of agricultural population in China based on land use data
Received date: 2024-07-30
Revised date: 2024-10-12
Online published: 2026-03-11
米瑞华 , 倪世龙 , 刘书敏 . 基于土地利用的中国农业人口格网分布特征分析[J]. 干旱区地理, 2025 , 48(6) : 1006 -1019 . DOI: 10.12118/j.issn.1000-6060.2024.460
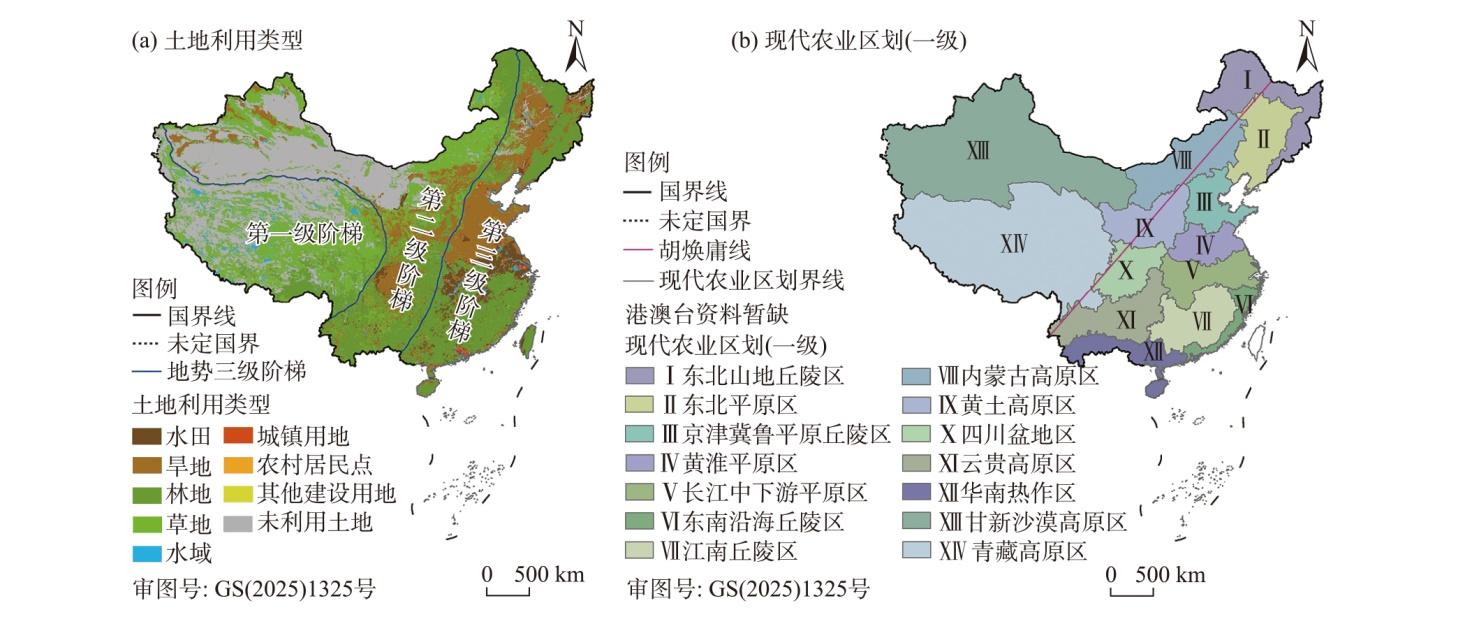
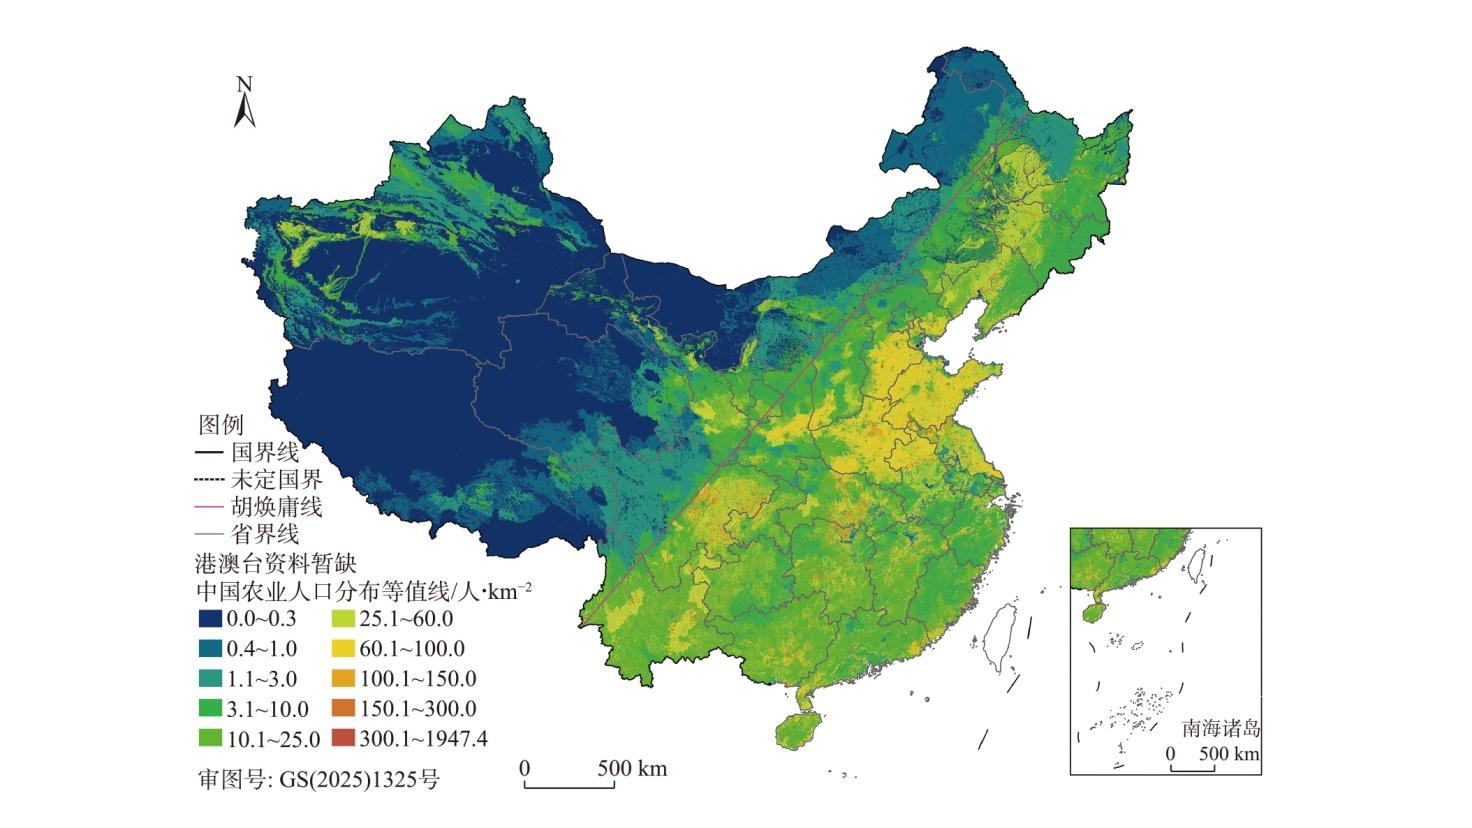
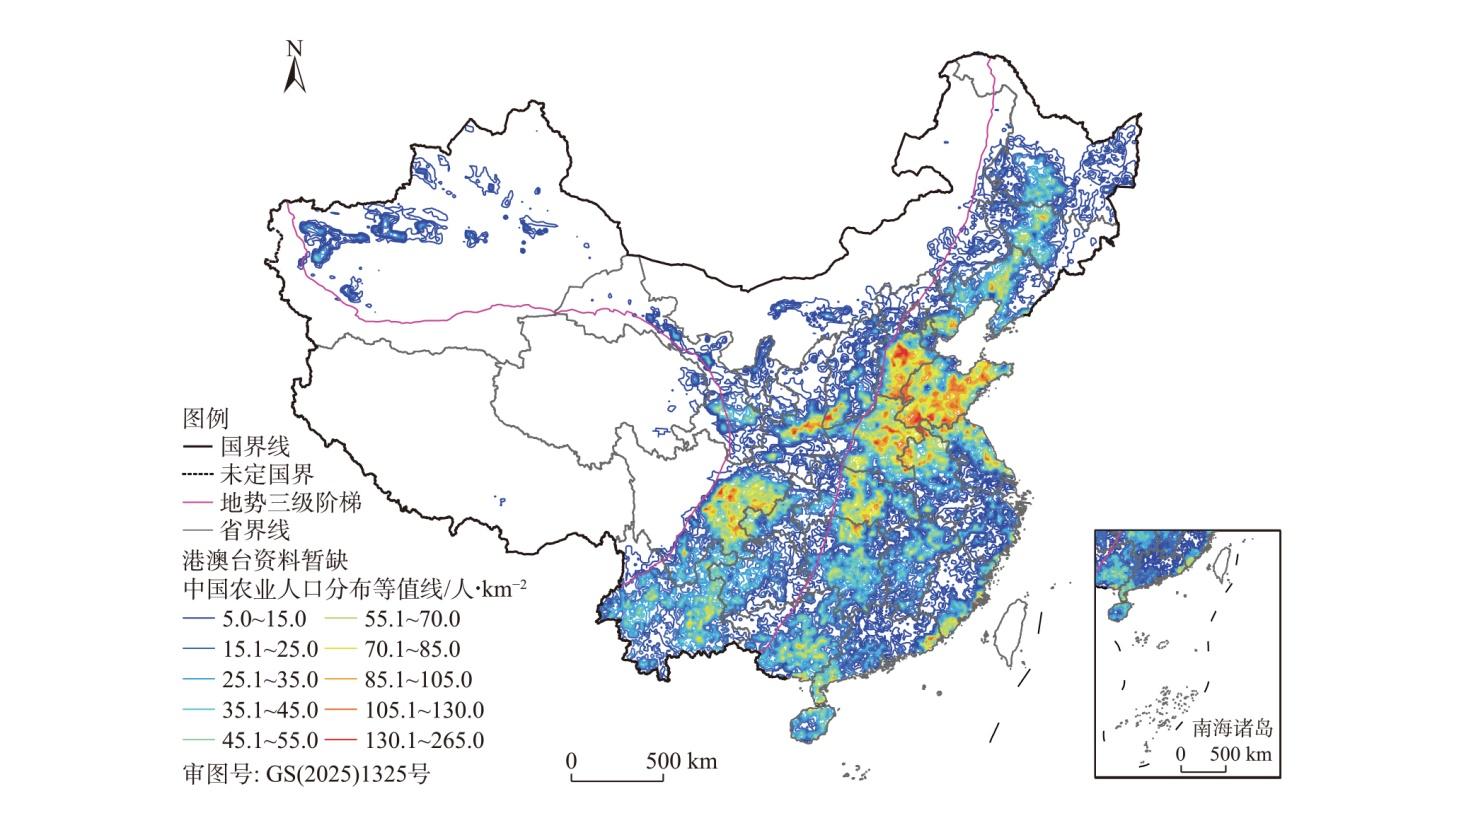
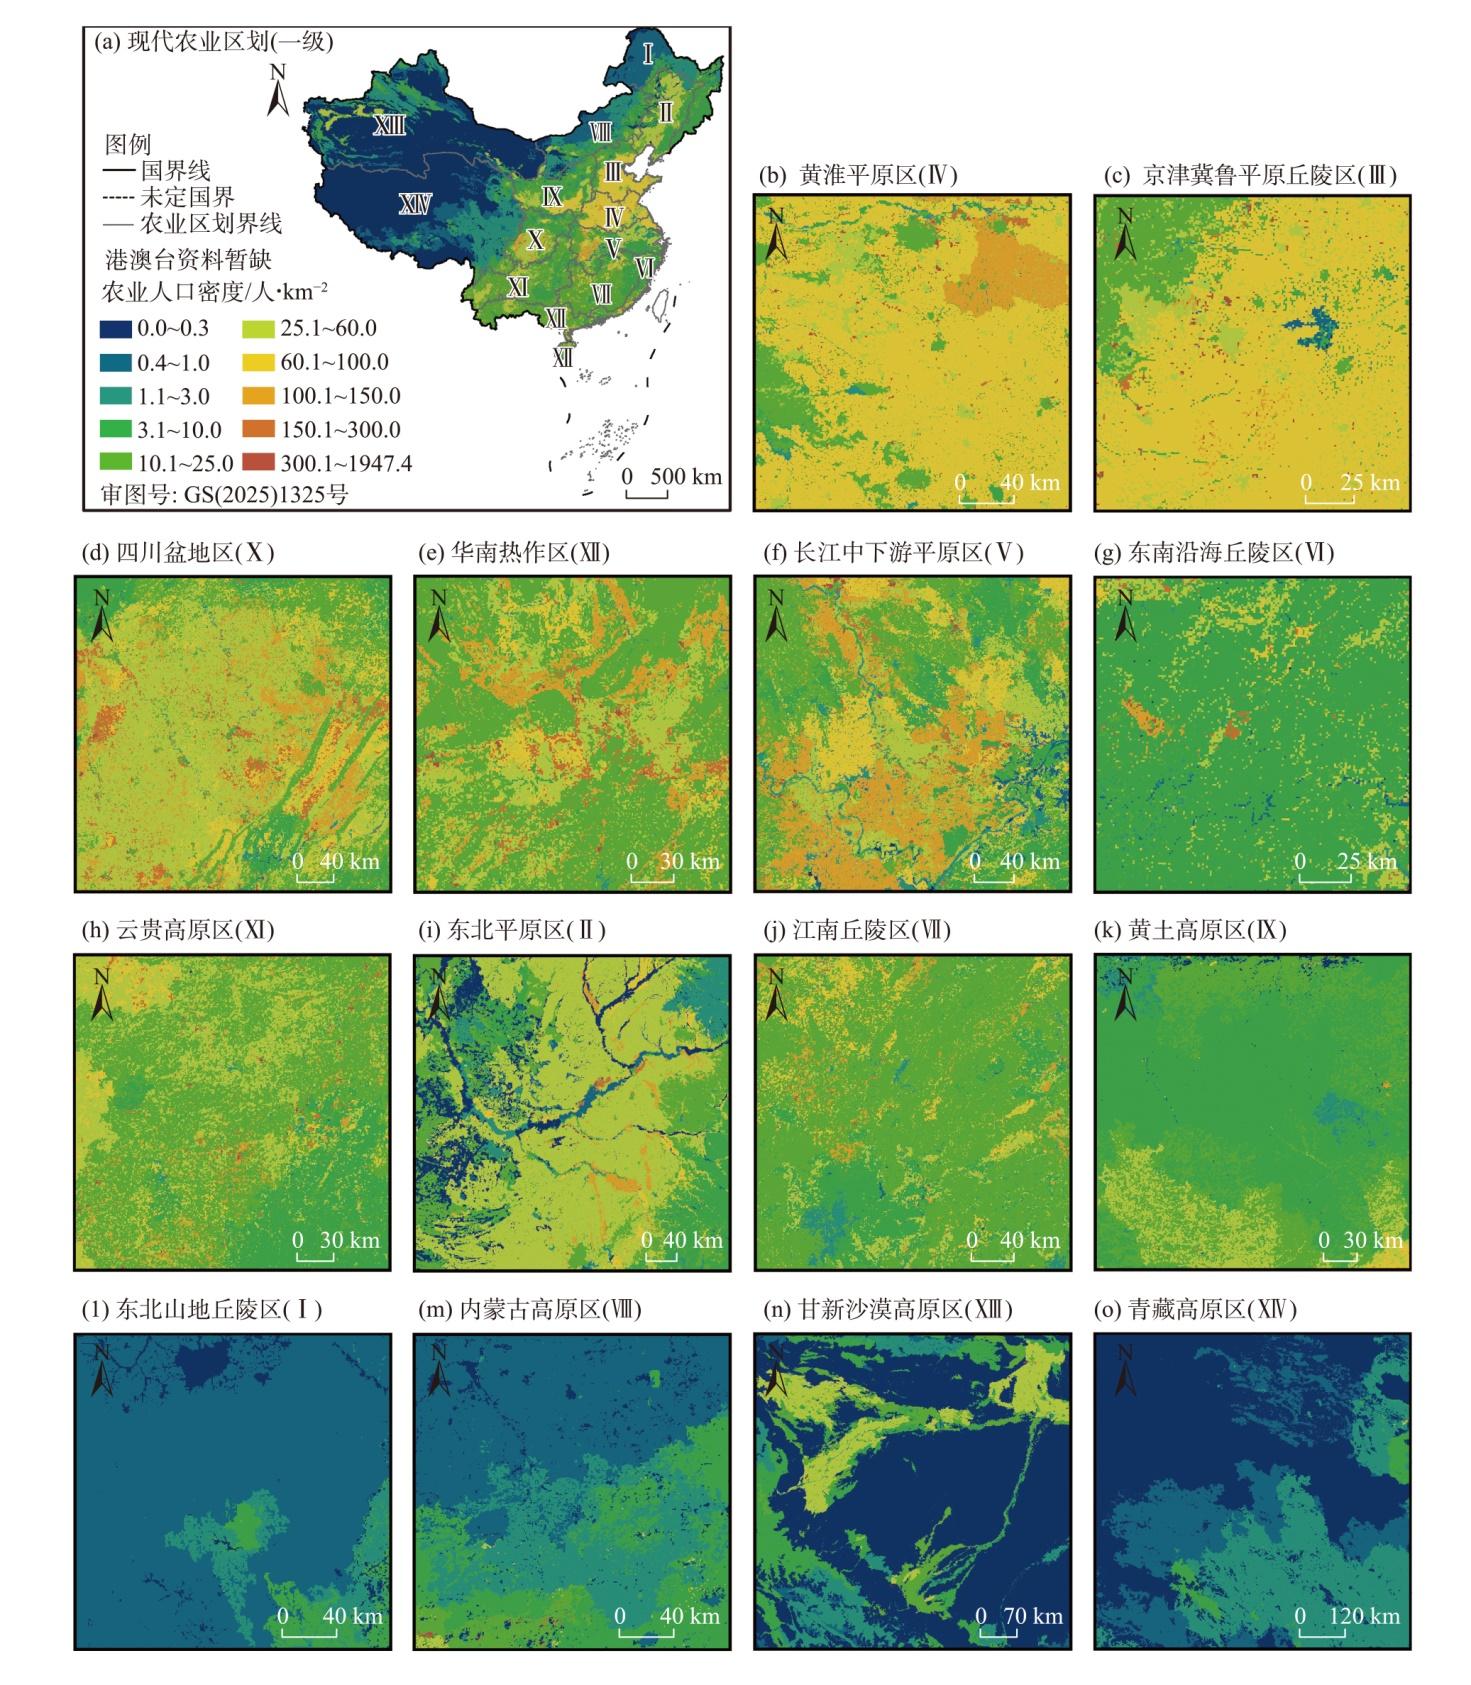
This study addresses the critical need for precise agricultural population distribution data to inform modern agricultural system development and policy formulation. We integrated country-level demographic data from the Seventh National Population Census with the China Land Use Remote Sensing Monitoring Dataset to develop a novel grid-based spatial distribution model. This methodological approach enabled the first comprehensive visualization of China’s agricultural population density at a 1 km resolution, with validation metrics confirming the high statistical reliability of the results. Our spatial analysis revealed three significant geographic patterns: (1) The Hu Huanyong Line (Hu Line) presents a profound demographic divide, with southeastern regions exhibiting an average agricultural population density (30.57 persons·km-2) nearly 15.9 times higher than northwestern regions (1.92 persons·km-2). (2) Agricultural population distribution follows China’s three-tiered topographical gradient, with densities increasing significantly from the western plateau (0.98 persons·km-2) through the central highlands (11.27 persons·km-2) to the eastern plains (30.76 persons·km-2). (3) Environmental determinants strongly influence agricultural settlement patterns, creating a clear dichotomy between densely populated warm, humid, low-altitude agricultural zones, and sparsely distributed cold-arid plateau and hilly agricultural regions. These findings provide an empirical basis for targeted agriculture development strategies: Prioritizing digital agriculture technologies in high-density regions like the Huang-Huai Plain; developing integrated agritourism models in ecologically sensitive areas; and implementing specialized training programs to cultivate a professional agricultural workforce adapted to regional conditions.
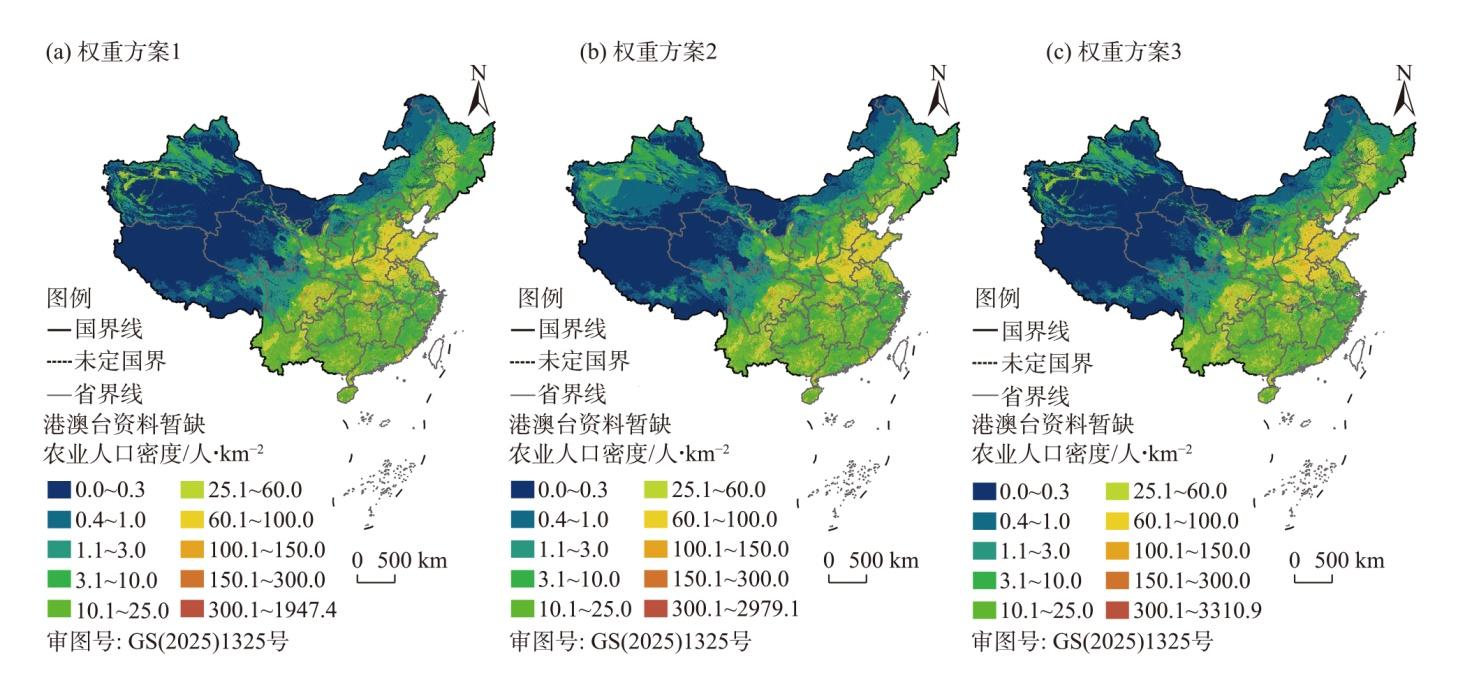
表1 土地利用类型的权重Tab. 1 Weighting of land use types |
| 土地利用类型 | 地类 代码 | 编号 (j) | 权重(fj ) | ||
|---|---|---|---|---|---|
| 方案1 | 方案2 | 方案3 | |||
| 水田 | 11 | 1 | 20.00 | 12.00 | 10.00 |
| 旱地 | 12 | 2 | 7.00 | 5.00 | 4.00 |
| 林地 | 20 | 3 | 3.00 | 2.20 | 2.00 |
| 草地 | 30 | 4 | 3.00 | 3.50 | 1.90 |
| 水域 | 40 | 5 | 0.45 | 0.80 | 0.09 |
| 城镇用地 | 51 | 6 | 3.00 | 3.00 | 5.00 |
| 农村居民点 | 52 | 7 | 3.50 | 3.00 | 5.00 |
| 其他建设用地 | 53 | 8 | 60.00 | 70.00 | 72.00 |
| 未利用土地 | 60 | 9 | 0.05 | 0.50 | 0.01 |
表2 胡焕庸线两侧农业人口分布情况Tab. 2 Basic situation of agricultural population distribution on both sides of the Hu Huanyong Line |
| 胡焕庸线两侧 | 国土面积占比/% | 水田占比/% | 旱地占比/% | 农业人口 | ||
|---|---|---|---|---|---|---|
| 占比/% | 密度/人·km-2 | 人均耕地面积/hm2 | ||||
| 东南半壁 | 42.65 | 98.14 | 77.86 | 92.22 | 30.57 | 1.18 |
| 西北半壁 | 57.35 | 1.86 | 22.14 | 7.78 | 1.92 | 2.86 |
| 合计 | 100.00 | 100.00 | 100.00 | 100.00 | - | - |
表3 地势三级阶梯的农业人口分布情况Tab. 3 Basic situation of agricultural population distribution on the three tiered terrain ladder |
| 地势三级阶梯 | 国土面积占比/% | 水田占比/% | 旱地占比/% | 农业人口 | ||
|---|---|---|---|---|---|---|
| 占比/% | 密度/人·km-2 | 人均耕地面积/hm2 | ||||
| 第一级阶梯 | 27.71 | 0.20 | 2.35 | 1.92 | 0.98 | 1.23 |
| 第二级阶梯 | 43.13 | 22.55 | 42.59 | 34.47 | 11.27 | 1.43 |
| 第三级阶梯 | 29.16 | 77.25 | 55.06 | 63.61 | 30.76 | 1.25 |
| 合计 | 100.00 | 100.00 | 100.00 | 100.00 | - | - |
表4 中国各个农业区上的农业人口分布情况Tab. 4 Basic situation of agricultural population distribution on agricultural regions in China |
| 区划编号 | 现代农业区划 | 国土面积 占比/% | 水田 占比/% | 旱地 占比/% | 农业人口 | ||
|---|---|---|---|---|---|---|---|
| 占比/% | 密度/人·km-2 | 人均耕地面积/hm2 | |||||
| Ⅳ | 黄淮平原区 | 2.97 | 7.47 | 11.98 | 13.97 | 66.52 | 1.02 |
| Ⅲ | 京津冀鲁平原丘陵区 | 3.41 | 0.54 | 12.70 | 12.87 | 53.39 | 0.98 |
| Ⅹ | 四川盆地区 | 3.63 | 12.50 | 7.69 | 9.19 | 35.85 | 1.27 |
| Ⅻ | 华南热作区 | 3.55 | 6.80 | 3.78 | 7.99 | 31.94 | 0.75 |
| Ⅴ | 长江中下游平原区 | 4.38 | 29.13 | 3.27 | 9.88 | 31.89 | 1.30 |
| Ⅵ | 东南沿海丘陵区 | 1.68 | 5.30 | 0.73 | 3.30 | 28.21 | 0.75 |
| Ⅺ | 云贵高原区 | 5.87 | 7.87 | 6.58 | 10.54 | 25.37 | 0.86 |
| Ⅱ | 东北平原区 | 5.01 | 7.11 | 15.34 | 8.73 | 24.66 | 1.99 |
| Ⅶ | 江南丘陵区 | 5.22 | 17.07 | 2.56 | 8.55 | 23.14 | 0.95 |
| Ⅸ | 黄土高原区 | 4.88 | 0.50 | 12.37 | 7.19 | 20.84 | 1.71 |
| Ⅰ | 东北山地丘陵区 | 6.58 | 4.49 | 6.62 | 1.68 | 3.61 | 4.77 |
| Ⅷ | 内蒙古高原区 | 6.72 | 0.76 | 6.45 | 1.67 | 3.53 | 3.92 |
| ⅩⅢ | 甘新沙漠高原区 | 22.03 | 0.03 | 7.72 | 2.47 | 1.58 | 3.08 |
| ⅩⅣ | 青藏高原区 | 24.07 | 0.43 | 2.21 | 1.97 | 1.16 | 1.17 |
| 合计 | 100.00 | 100.00 | 100.00 | 100.00 | - | - | |
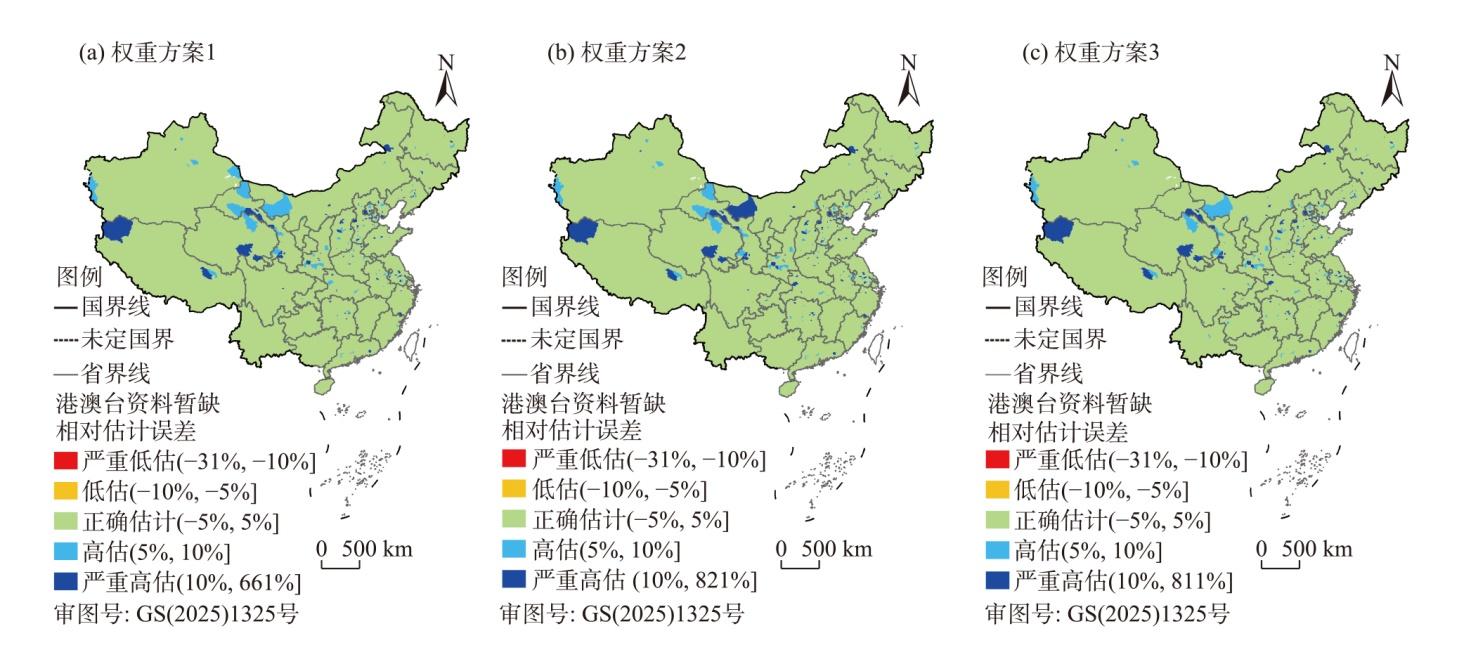
表5 不同权重方案下的精度评估Tab. 5 Accuracy assessment under different weight schemes |
| 权重方案 | RMSE | MAE | MAPE/% | r |
|---|---|---|---|---|
| 方案1 | 55.65 | 33.71 | 2.45 | 0.999 |
| 方案2 | 58.43 | 35.64 | 2.69 | 0.999 |
| 方案3 | 58.30 | 35.37 | 2.77 | 0.999 |
注:RMSE为均方根误差;MAE为平均绝对误差;MAPE为平均绝对百分比误差;r为相关系数。下同。 |
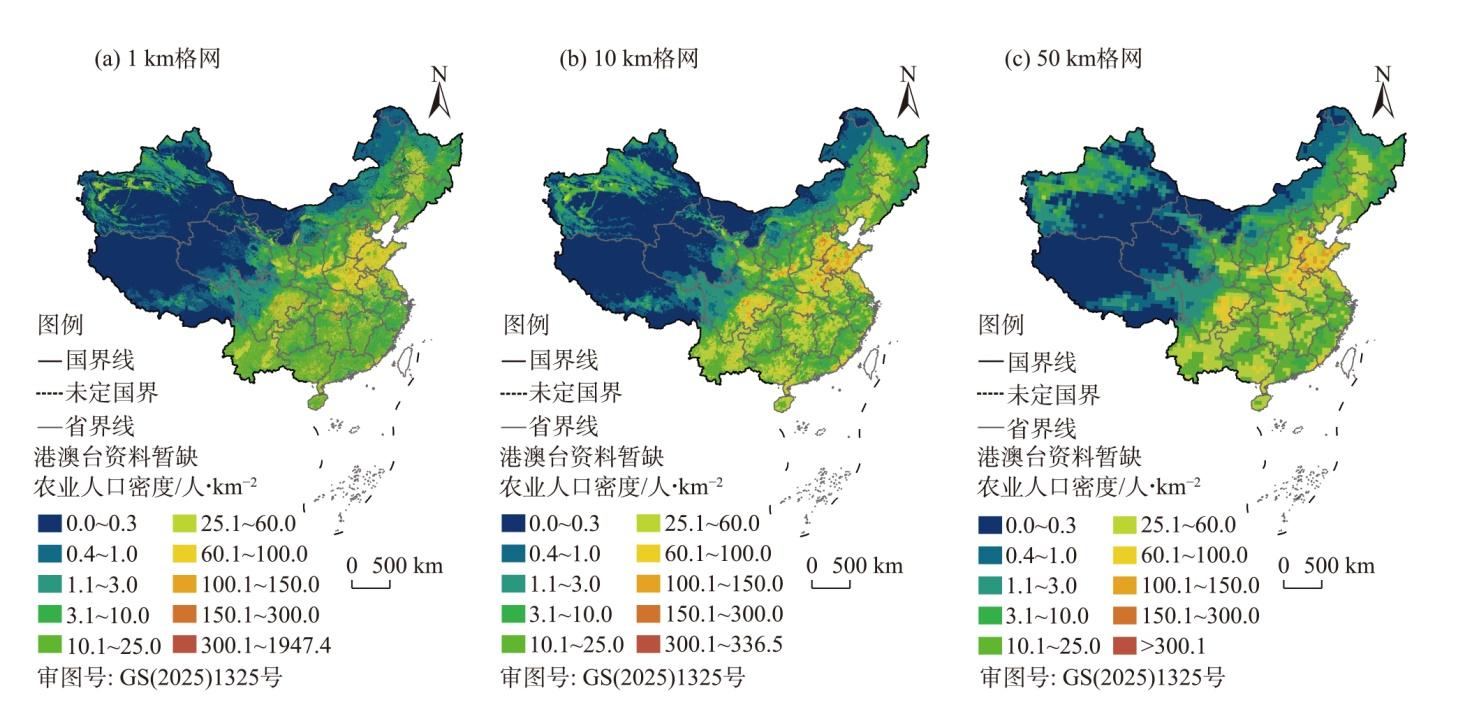
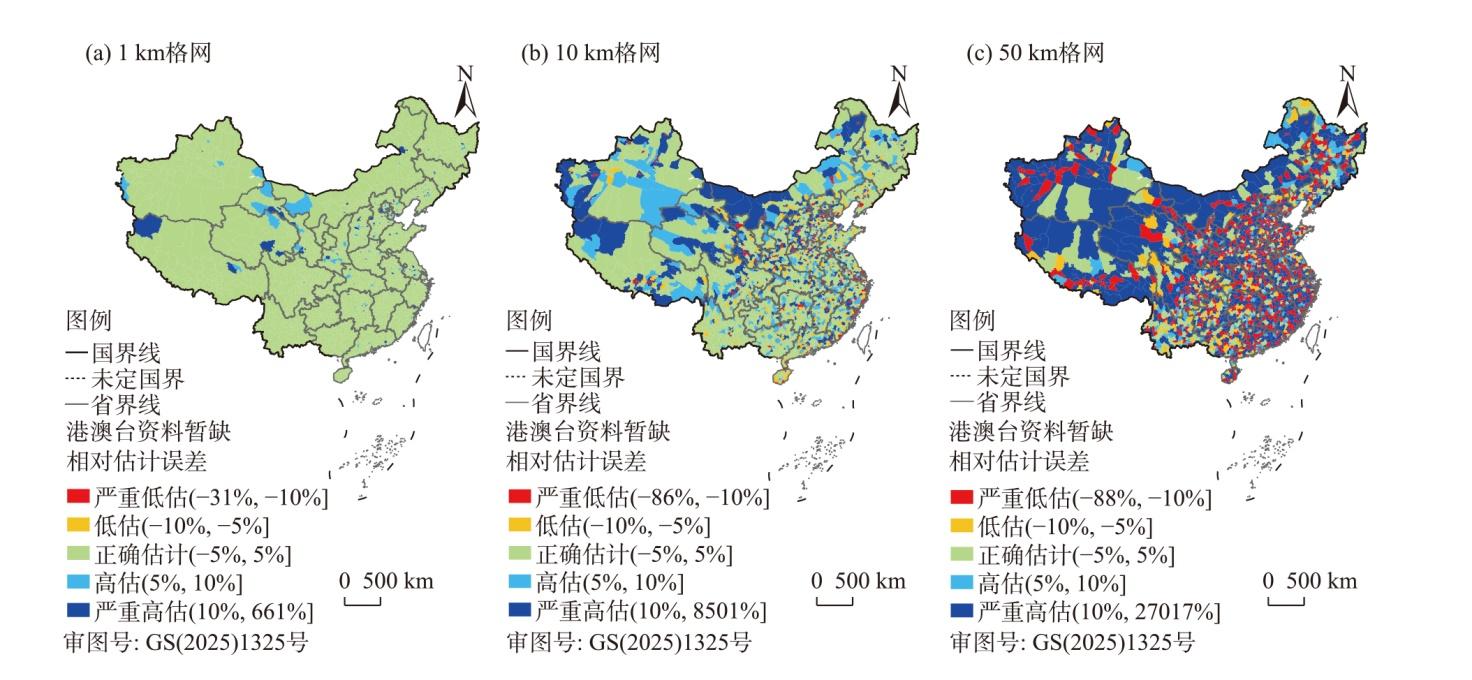
表6 不同格网尺度下的精度评估Tab. 6 Accuracy assessment under different grid scales |
| 格网尺度/km | RMSE | MAE | MAPE/% | r |
|---|---|---|---|---|
| 1 | 55.65 | 33.71 | 2.45 | 0.999 |
| 10 | 413.15 | 268.23 | 21.51 | 0.997 |
| 50 | 1494.44 | 983.54 | 73.52 | 0.950 |
| [1] |
胡焕庸, 张善余. 中国人口地理(上册)[M]. 上海: 华东师范大学出版社, 1984.
[
|
| [2] |
王克冬, 曾维忠, 武佩佩. 以新质生产力引领农业农村现代化——内在逻辑、机遇挑战与实现路径[J]. 四川农业大学学报, 2024, 42(6): 1159-1164, 1178.
[
|
| [3] |
戴蓉, 郭泺, 薛达元, 等. 中国农业人口分布格局的时空变化特征[J]. 中国人口·资源与环境, 2010, 20(增刊2): 186-189.
[
|
| [4] |
陈阳. 县域尺度下农业人口分布特征及驱动因素初探——以四川省为例[C]// 中国城市规划学会, 重庆市人民政府. 活力城乡美好人居——2019中国城市规划年会论文集(18乡村规划). 北京: 中国建筑工业出版社, 2019: 11.
[
|
| [5] |
王海涛, 吴通宜, 白正兵, 等. 陕西省农业人口空间分布与时空演变特征研究[J]. 地理空间信息, 2020, 18(10): 106-109, 6.
[
|
| [6] |
杨燕新, 曹毅, 王文斌. 晋中市农业人口分布的分形研究[J]. 山西农业大学学报(自然科学版), 2011, 31(6): 573-576.
[
|
| [7] |
米瑞华, 刘书敏, 倪世龙. 陕西省农业人口格网分布特征及其时空演变[J]. 陕西师范大学学报(自然科学版), 2025, 53(2): 37-47.
[
|
| [8] |
张慧泽, 高启杰. 新农人现象与乡村人才振兴机制构建——基于社会与产业双重网络视角[J]. 现代经济探讨, 2021(2): 121-125.
[
|
| [9] |
|
| [10] |
|
| [11] |
刘彦随, 张紫雯, 王介勇. 中国农业地域分异与现代农业区划方案[J]. 地理学报, 2018, 73(2): 203-218.
[
|
| [12] |
徐新良, 刘纪远, 张树文, 等. 中国多时期土地利用遥感监测数据集(CNLUCC)[DB/OL]. [2018]. 资源环境科学数据注册与出版系统(http://www.resdc.cn/
[
|
| [13] |
蒋捷, 杨昕. 基于DEM中国地势三大阶梯定量划分[J]. 地理信息世界, 2009, 7(1): 8-13.
[
|
| [14] |
米瑞华, 杨昕, 冯飞. 城市开发区人口分布预测及其规划价值——以西安市高新区为例[J]. 西北大学学报(自然科学版), 2019, 49(5): 801-807.
[
|
| [15] |
郑川, 贾召亮, 许瑞杰, 等. 基于风险普查建筑物隐患数据和夜间灯光数据的云南省盈江县人口分布精细化研究[J]. 地震研究, 2023, 46(3): 403-414.
[
|
| [16] |
淳锦, 张新长, 黄健锋, 等. 基于POI数据的人口分布格网化方法研究[J]. 地理与地理信息科学, 2018, 34(4): 83-89, 124, 2.
[
|
| [17] |
|
| [18] |
李姗姗, 林文坛. 基于夜光遥感的粤港澳大湾区人口空间分布及特征研究[J]. 热带地理, 2023, 43(3): 384-394.
[
|
| [19] |
桂志鹏, 梅宇翱, 吴华意, 等. 顾及POI人口吸引力异质性的城市人口空间化方法[J]. 地球信息科学学报, 2022, 24(10): 1883-1897.
[
|
| [20] |
李慧敏, 罗大伟, 窦世卿. 利用腾讯位置大数据进行多尺度人口空间化估算[J]. 测绘通报, 2022(6): 93-97.
[
|
| [21] |
|
| [22] |
张学珍, 王发浩, 路伟东, 等. 1776—1953年中国传统农区人口的格网化重建[J]. 中国科学: 地球科学, 2022, 52(3): 528-539.
[
|
| [23] |
|
| [24] |
吴京航, 桂志鹏, 申力, 等. 顾及格网属性分级与空间关联的人口空间化方法[J]. 武汉大学学报(信息科学版), 2022, 47(9): 1364-1375.
[
|
| [25] |
|
| [26] |
|
| [27] |
|
| [28] |
|
| [29] |
|
| [30] |
罗永臻, 董春, 张玉. 人口空间化适宜格网评价方法研究[J]. 地球信息科学学报, 2023, 25(5): 896-908.
[
|
| [31] |
董南, 杨小唤, 蔡红艳, 等. 人口密度格网尺度适宜性评价方法研究——以宣州区乡村区域为例[J]. 地理学报, 2017, 72(12): 2310-2324.
[
|
| [32] |
|
| [33] |
王明明, 王卷乐. 山东省街道/乡镇级格网化人口空间分布数据集(2000、2010年)[J]. 中国科学数据 2019, 4(3): 182-192.
[
|
| [34] |
米瑞华, 石英. 基于常住人口分布的城市主副中心识别方法——以西安市为例[J]. 陕西师范大学学报(自然科学版), 2014, 42(3): 97-102.
[
|
| [35] |
郭子翰, 陈斐, 刘晓丽, 等. 基于土地利用类型提高人口格网数据空间精度的方法[J]. 测绘通报, 2021(12): 66-70.
[
|
| [36] |
周祖根, 王静龙. 人口密度的等值线图应用研究[J]. 中国人口科学, 1992(5): 28-33.
[
|
| [37] |
伍理. 介绍新编“1/(600万)”中国人口分布图和等值线密度图[J]. 人口研究, 1987(4): 59-60, 58.
[
|
| [38] |
|
| [39] |
肖东升, 王宁, 刘志成. 干旱地区“代表性人口格网数据集”精度研究——以甘宁青地区为例[J]. 干旱区地理, 2023, 46(3): 505-514.
[
|
| [40] |
|
/
| 〈 |
|
〉 |