
1964—2020年毛乌素沙地新垦耕地和弃耕地空间格局变化及其对荒漠化的影响
|
费兵强(1991-),男,博士研究生,主要从事荒漠化监测与景观格局研究. E-mail: bqf_ids@caf.ac.cn |
收稿日期: 2024-06-25
修回日期: 2024-08-19
网络出版日期: 2026-03-11
基金资助
国家重点研发计划项目(2023YFF1305300)
国家自然科学基金项目(42371074)
中国林业科学研究院基本科研业务费专项(CAFYBB2023MB017)
Changes in the spatial pattern of newly cultivated and abandoned farmland in the Mu Us Sandy Land from 1964 to 2020 and their impact on desertification
Received date: 2024-06-25
Revised date: 2024-08-19
Online published: 2026-03-11
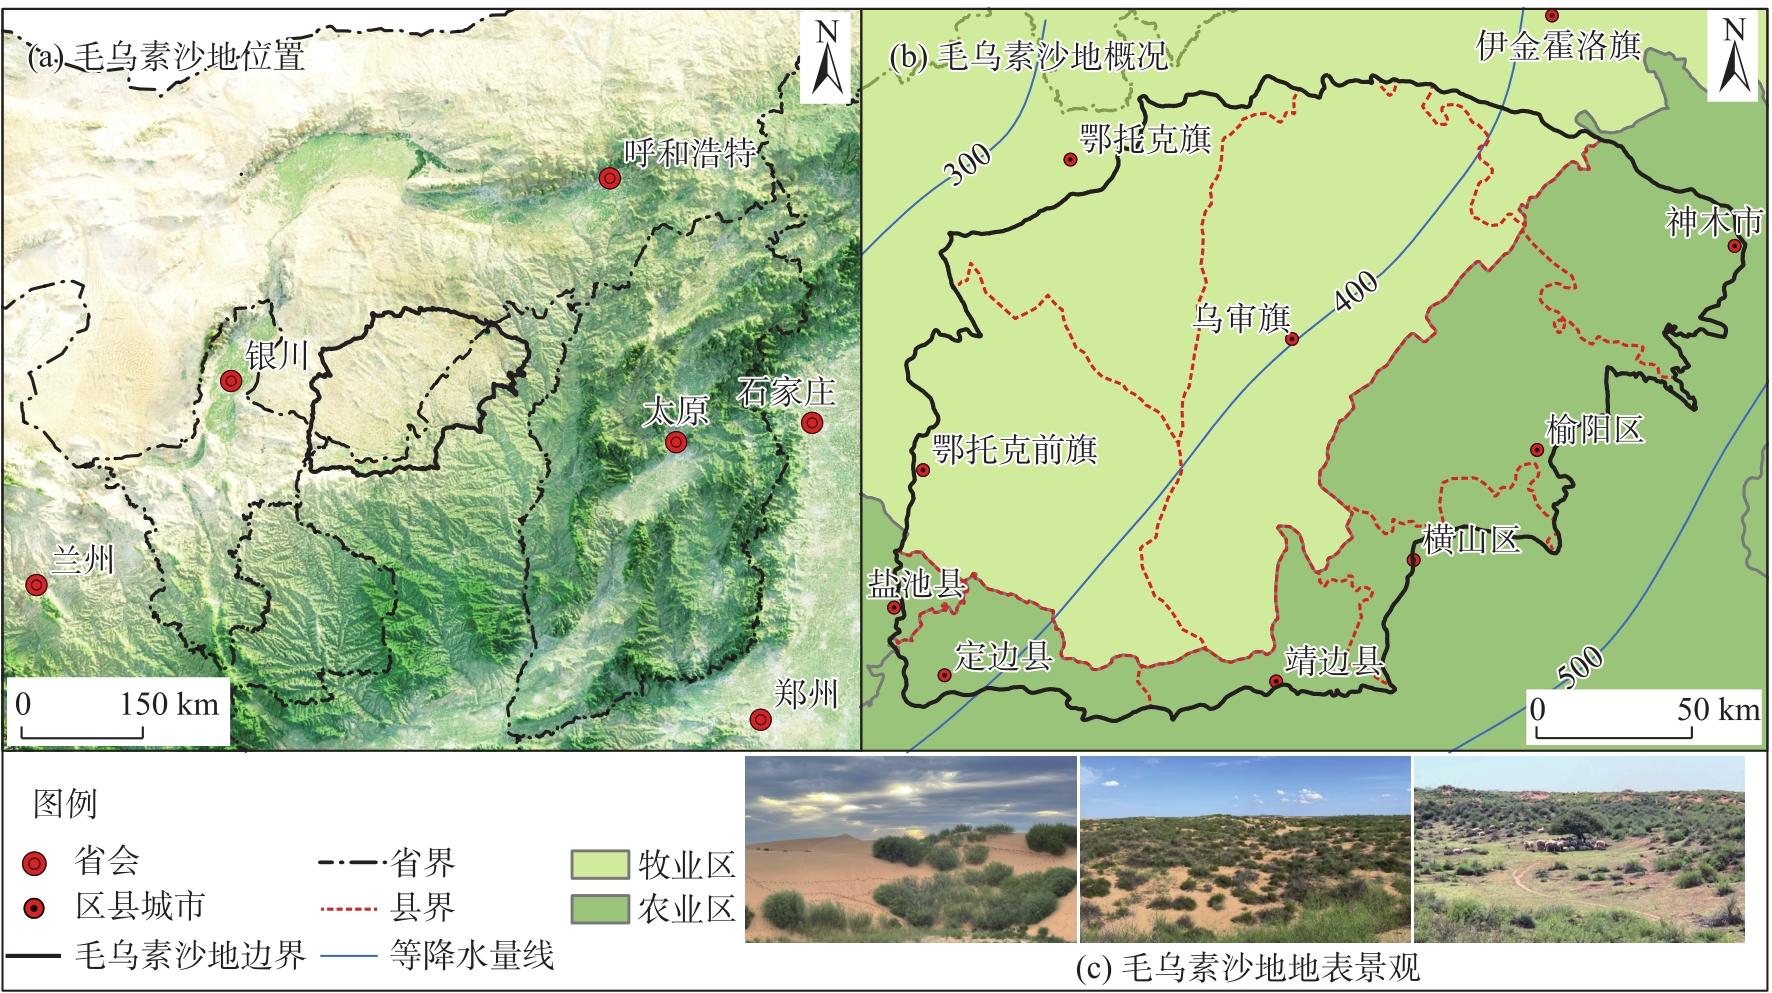
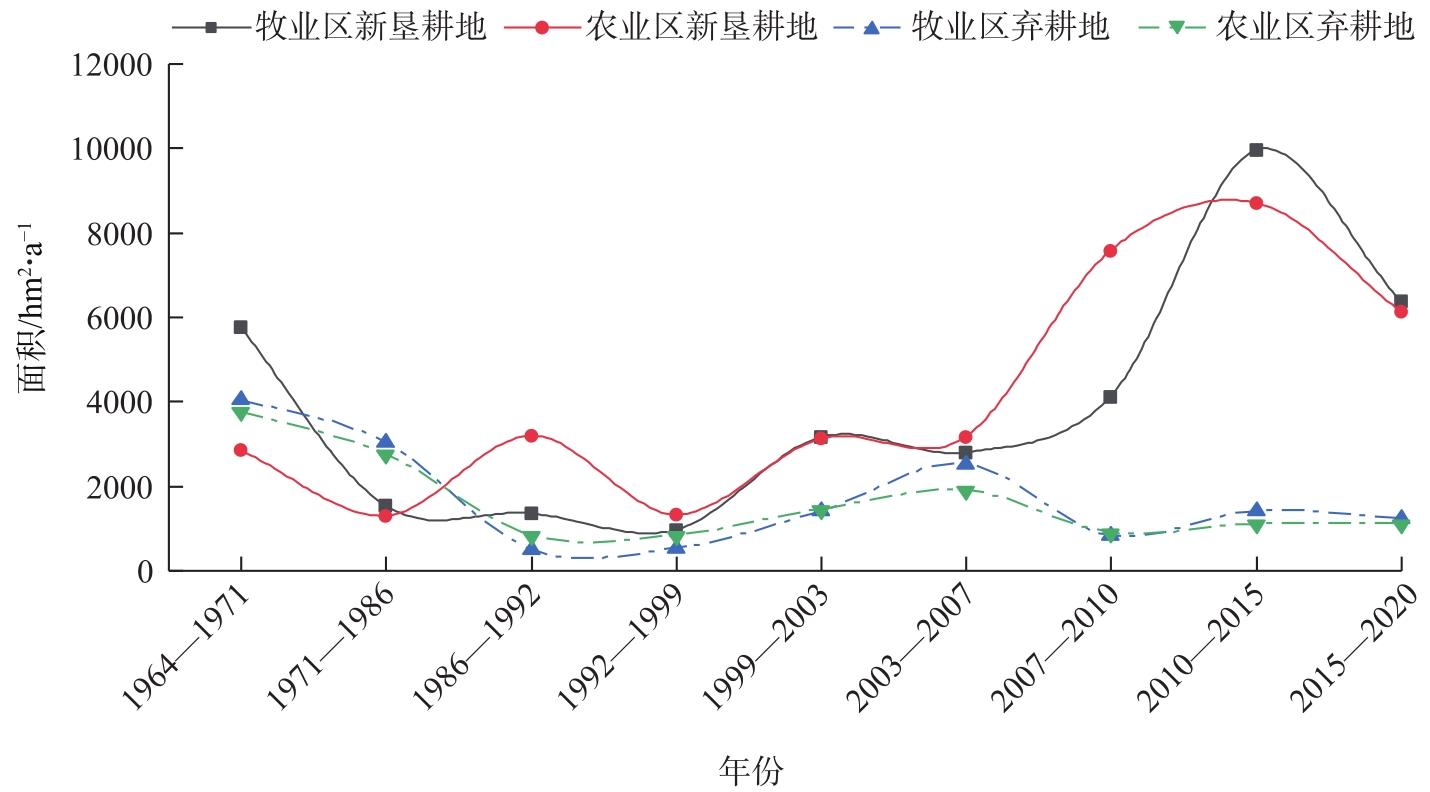
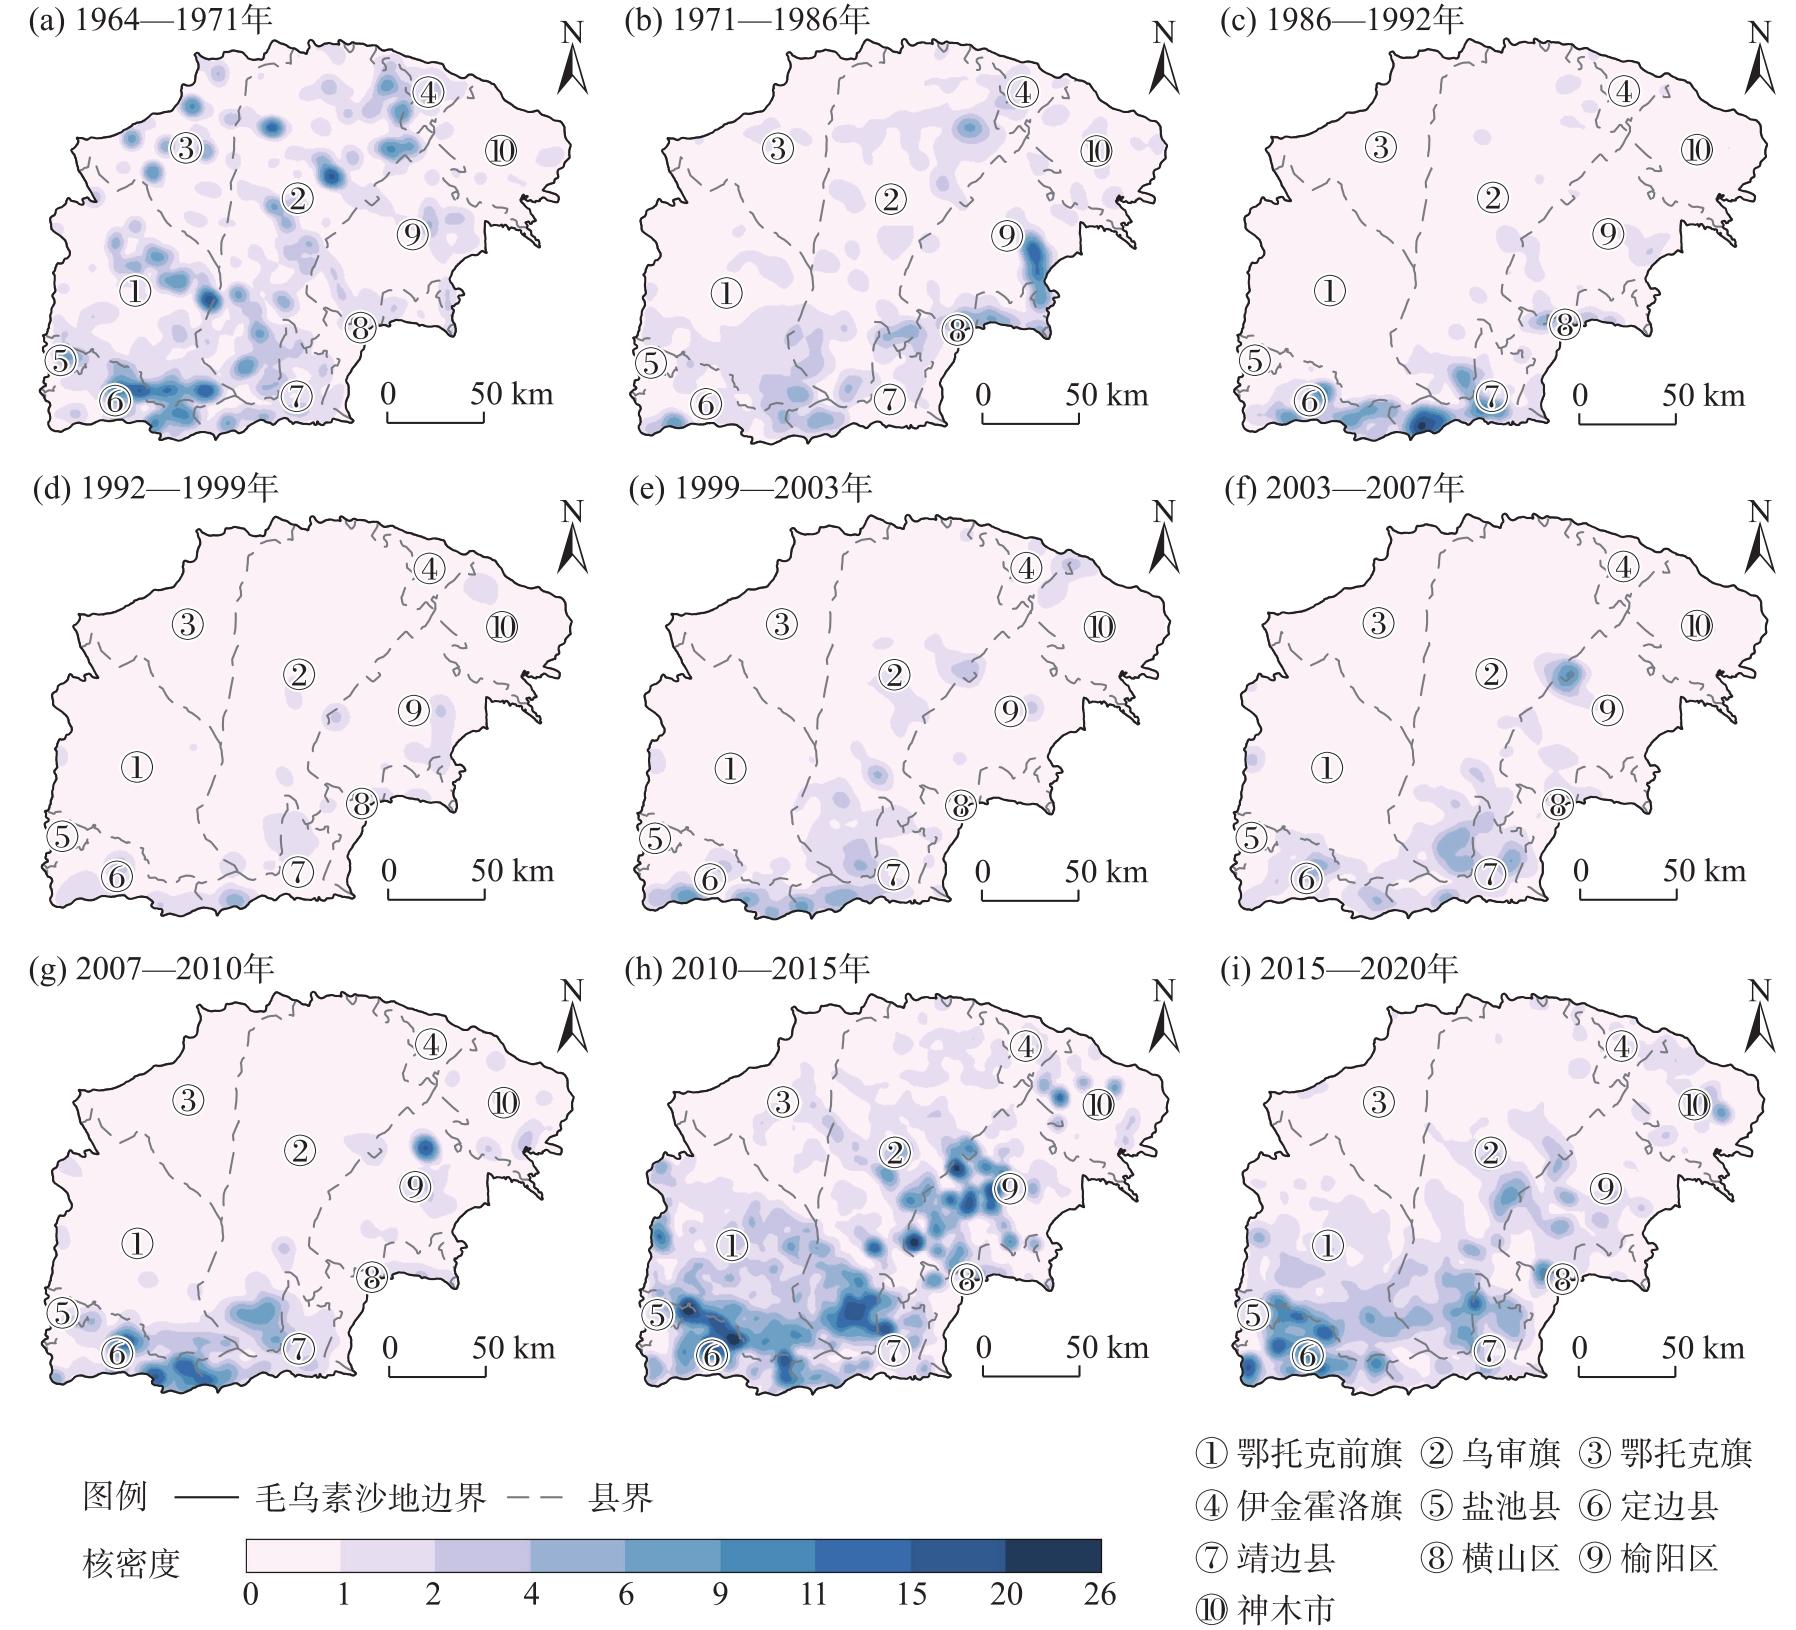
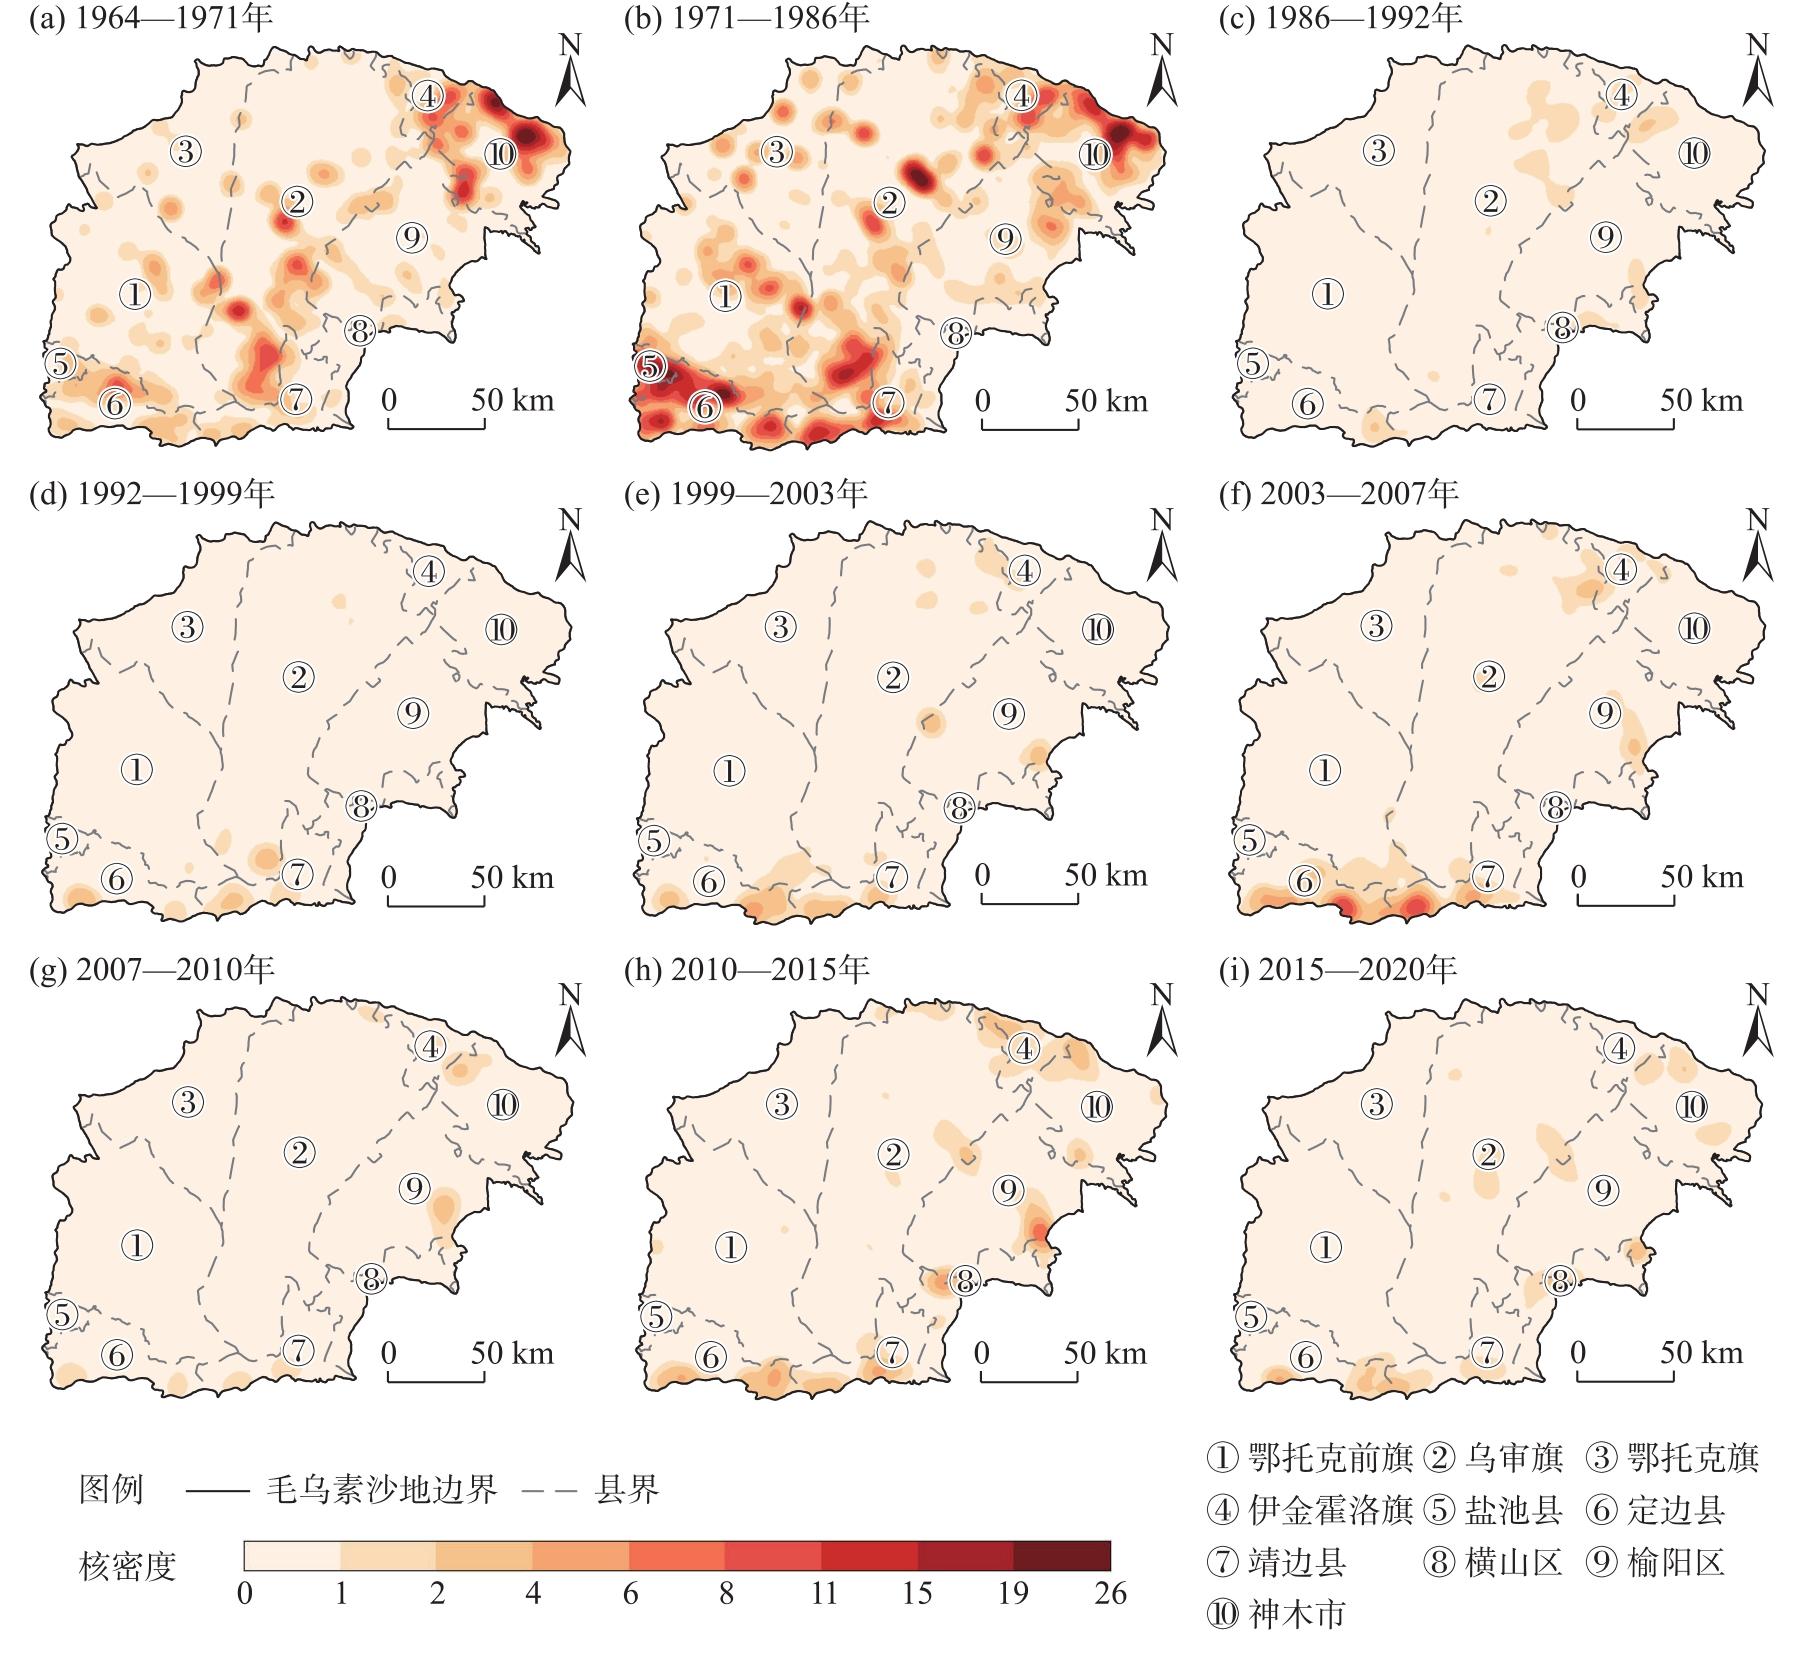
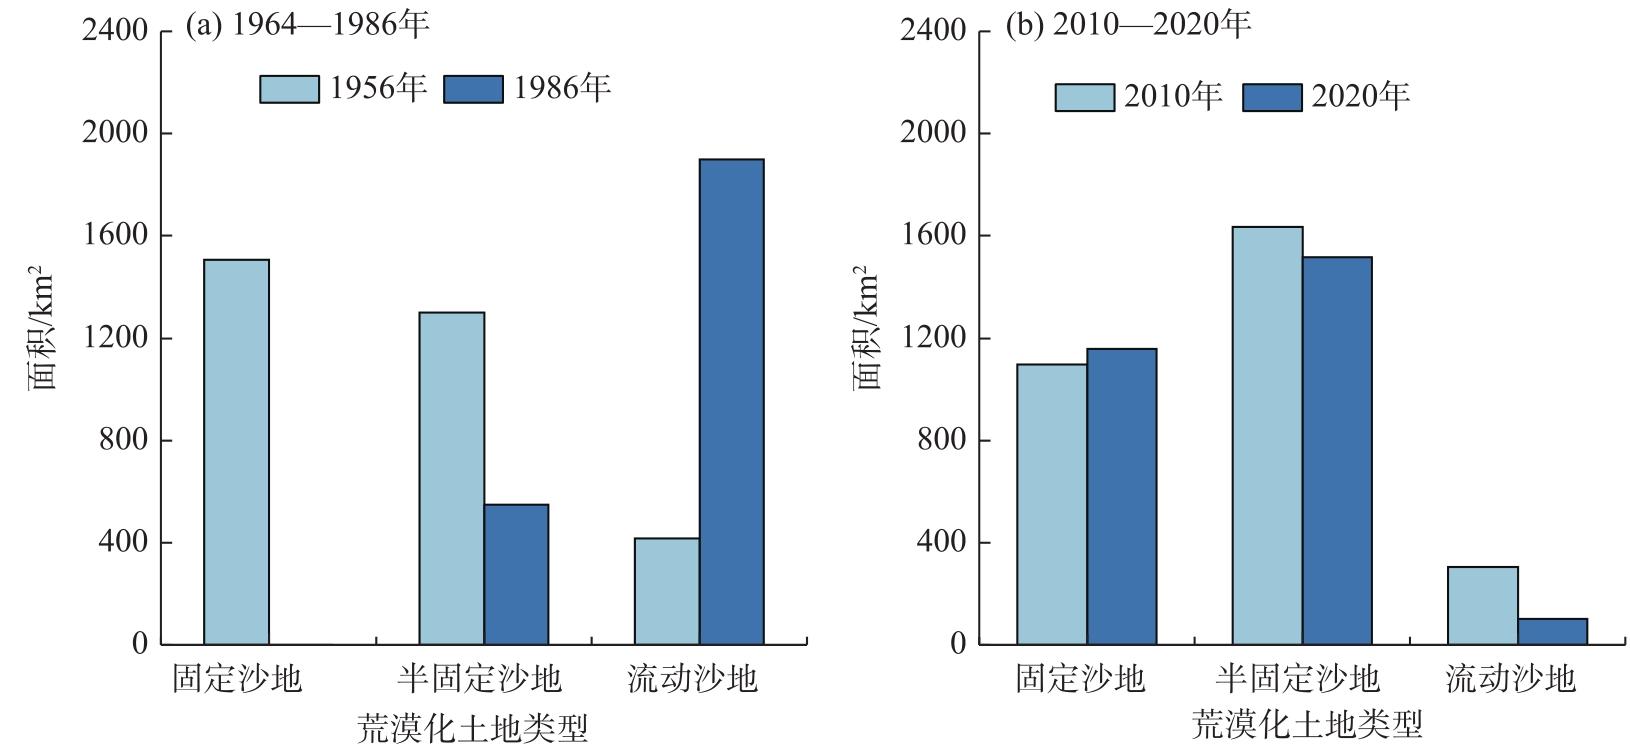
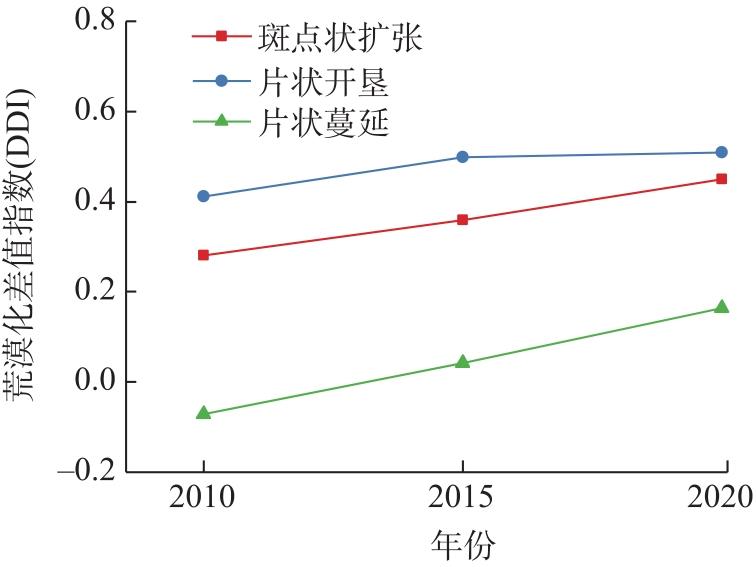
毛乌素沙地位于我国北方农牧交错带,生态环境非常脆弱。基于长时序多源遥感数据,分析了1964—2020年毛乌素沙地新垦耕地与弃耕地的空间格局变化及其对荒漠化的影响。结果显示:(1) 1964—2020年毛乌素沙地新垦耕地和弃耕地面积变化可分为3个阶段。1964—1986年新垦耕地和弃耕地面积均较大,年均弃耕地面积是1986—2020年的2.89倍;1986—2007年新垦耕地和弃耕地面积均较小并且相对稳定;2007—2020年新垦耕地面积增长迅速,年均新垦耕地面积是1964—2007年的3.24倍。(2) 新垦耕地和弃耕地表现出明显的空间分布差异。1964—1986年新垦耕地集中分布于沙地中部和西部,以及南部部分区域;1971—2010年新垦耕地只在沙地南部和东部区域局部出现;2010—2020年沙地南部和东部区域新垦耕地大幅度增加,2015年以来开垦强度有所降低。1964—1971年弃耕地集中分布于沙地东北部以及中部和南部部分区域,1971—1986年弃耕地在沙地南部分布比较集中,同时也散布于沙地东北部以及中部和西部部分区域;1986—2020年弃耕地面积大幅度减少,仅在沙地南缘和东部部分区域出现。(3) 1964—1986年毛乌素沙地的耕地弃耕使弃耕地及其周边区域发生了强烈的荒漠化;2010—2020年新垦耕地周边区域荒漠化土地并未出现扩张现象,但荒漠化程度存在加重趋势。耕地开垦和弃耕主要受政策因素驱动。近年来毛乌素沙地的大规模耕地开垦对其荒漠化的长期影响需要持续关注。
费兵强 , 吴波 , 殷婕 , 董春媛 , 马慧榕 , 修晓敏 , 贾晓红 , 庞营军 , 张平 . 1964—2020年毛乌素沙地新垦耕地和弃耕地空间格局变化及其对荒漠化的影响[J]. 干旱区地理, 2025 , 48(4) : 661 -672 . DOI: 10.12118/j.issn.1000-6060.2024.390
The Mu Us Sandy Land, located in the agro-pastoral ecotone of northern China, has a fragile ecological environment highly susceptible to agricultural development. This study employs long-term multivariate remote sensing data to analyze the spatio-temporal patterns of newly cultivated and abandoned farmland in the region from 1964 to 2020 and their subsequent impacts on desertification. The results indicate that (1) From 1964 to 2020, changes in the area of newly cultivated and abandoned farmland in the Mu Us Sandy Land can be categorized into three stages. Between 1964 and 1986, the extent of both newly cultivated and abandoned farmland was relatively high, with abandoned farmland significantly exceeding other periods. The average annual abandoned farmland area was 2.89 times that of 1986—2020, and newly cultivated farmland in pastoral areas was notably greater than that in agricultural areas. Between 1986 and 2007, both newly cultivated and abandoned farmland remained relatively low and stable, with newly cultivated farmland slightly exceeding abandoned farmland. From 2007 to 2020, the area of newly cultivated farmland expanded rapidly, with an average annual increase 3.24 times that of 1964—2007, while the abandoned farmland area remained relatively low. (2) Significant spatial and temporal differences exist between newly cultivated and abandoned farmland. From 1964 to 1986, newly cultivated farmland hotspots were widely distributed in the pastoral areas of central and western Mu Us Sandy Land. Between 1971 and 1986, a few concentrated cultivation hotspots emerged in the agricultural areas of eastern Mu Us Sandy Land. From 2007 to 2020, newly cultivated farmland hotspots were mainly concentrated in the east, central agricultural areas, and the southern region. (3) Between 1964 and 1986, large-scale farmland cultivation and abandonment, driven by policy factors, led to severe land desertification in the Mu Us Sandy Land. The area of fixed sandy land surrounding abandoned farmland decreased by 99.9%, while the area of shifting sandy land increased by 358.2%. From 2007 to 2020, no significant trend of desertification was observed around newly cultivated farmland; however, the degree of desertification surrounding newly cultivated farmland showed an increasing trend. Future agricultural and animal husbandry management policies, as well as desertification prevention and control plans, should carefully balance agricultural development with the preservation of fragile sandy ecosystems. Additionally, attention should be given to the potential desertification risks associated with land reclamation and abandonment.
表1 影像数据详细信息Tab. 1 Information of the images |
| 时间(年-月) | 类型 | 数量/景 | 分辨率/m | 传感器 |
|---|---|---|---|---|
| 1963-06 1964-08 | 全色 | 1 | 140 | ARGON |
| 全色 | 16 | 4 | CORONA | |
| 1971-10 | 全色 | 23 | 4 | CORONA |
| 1986-08 | 多光谱 | 4 | 30 | TM |
| 1992-08 | 多光谱 | 4 | 30 | TM |
| 1999-08 | 多光谱 | 4 | 30 | TM |
| 2003-08 | 多光谱 | 4 | 30 | TM |
| 2007-09 | 多光谱 | 4 | 30 | TM |
| 2010-08 | 多光谱 | 4 | 30 | TM |
| 2015-09 | 多光谱 | 4 | 30 | OLI |
| 2020-08 | 多光谱 | 4 | 30 | OLI |
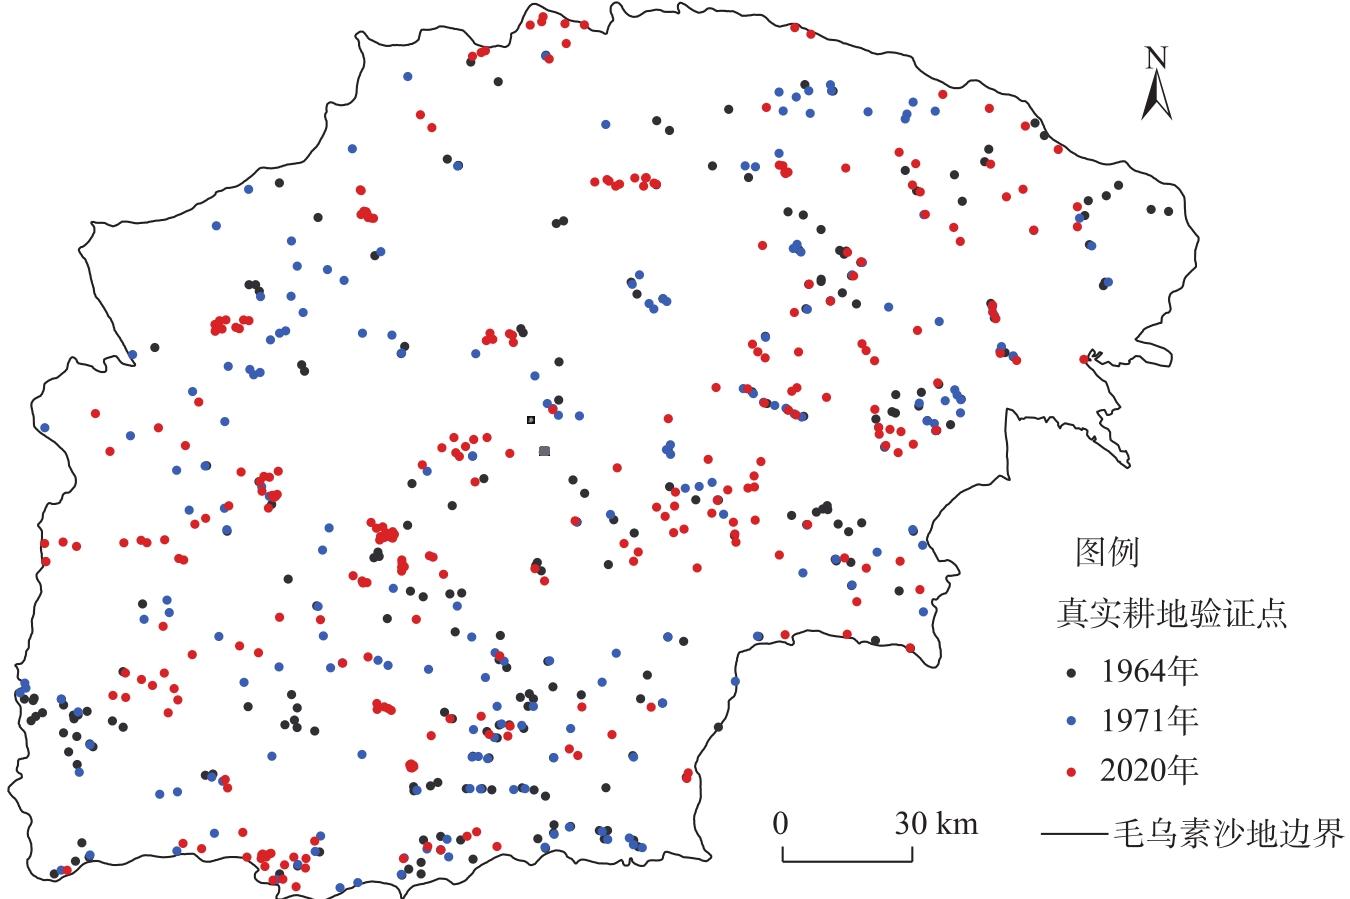
表2 耕地提取精度验证结果Tab. 2 Accuracy verification results of farmland extraction |
| 影像类型 | 解译方法 | 年份 | OA | Kappa |
|---|---|---|---|---|
| CORONA | 目视解译 | 1964 | 0.97 | 0.95 |
| CORONA | 目视解译 | 1971 | 0.92 | 0.87 |
| Landsat | 随机森林 | 2020 | 0.93 | 0.78 |
注:OA为总体精度。 |
表3 不同时期农业区和牧业区新垦耕地和弃耕地面积及其占耕地总面积百分比Tab. 3 Area of newly cultivated and abandoned farmland in agricultural and pastoral areas during different periods, as well as their percentages in the total cultivated farmland area |
| 年份 | 新垦耕地 | 弃耕地 | |||||||
|---|---|---|---|---|---|---|---|---|---|
| 牧业区/hm2 | 占比/% | 农业区/hm2 | 占比/% | 牧业区/hm2 | 占比/% | 农业区/hm2 | 占比/% | ||
| 1964—1971 | 40191 | 39.3 | 19997 | 12.9 | 26262 | 28.3 | 28372 | 17.3 | |
| 1971—1986 | 23087 | 30.6 | 19090 | 15.3 | 41361 | 40.5 | 45600 | 29.3 | |
| 1986—1992 | 8126 | 10.1 | 19085 | 13.8 | 4908 | 6.5 | 3018 | 2.4 | |
| 1992—1999 | 6600 | 8.3 | 9291 | 6.4 | 5832 | 7.3 | 3579 | 2.6 | |
| 1999—2003 | 12649 | 14.7 | 12530 | 8.2 | 5724 | 7.2 | 5617 | 3.9 | |
| 2003—2007 | 11154 | 12.4 | 12619 | 8.1 | 7630 | 8.9 | 10031 | 6.5 | |
| 2007—2010 | 12288 | 12.3 | 22677 | 12.8 | 2676 | 3.0 | 2491 | 1.6 | |
| 2010—2015 | 49780 | 34.2 | 43457 | 20.7 | 5548 | 5.6 | 7071 | 4.0 | |
| 2015—2020 | 31785 | 18.4 | 30597 | 13.1 | 5514 | 3.8 | 6096 | 2.9 | |
注:表中某一时期新垦耕地占耕地总面积的百分比是当期新垦耕地面积占当期末耕地总面积的百分比;某一时期弃耕地占耕地总面积的百分比是当期弃耕地面积占当期初耕地总面积的百分比。表中比例显示的是新垦耕地和弃耕地占各时期耕地总面积百分比,因此百分比总和不是100%。 |
| [1] |
|
| [2] |
|
| [3] |
|
| [4] |
|
| [5] |
|
| [6] |
|
| [7] |
|
| [8] |
|
| [9] |
周炎广, 武子丰, 胡日娜, 等. 毛乌素沙地新垦地土壤风蚀特征[J]. 农业工程学报, 2020, 36(1): 138-147.
[
|
| [10] |
原晋涛, 陈万旭, 曾杰. 中国耕地利用变化时空分异特征及对耕地NPP的影响[J]. 自然资源学报, 2023, 38(12): 3135-3149.
[
|
| [11] |
刘纪远, 宁佳, 匡文慧, 等. 2010—2015年中国土地利用变化的时空格局与新特征[J]. 地理学报, 2018, 73(5): 789-802.
[
|
| [12] |
刘目兴, 刘连友. 农田休闲期作物留茬对近地表风场的影响[J]. 农业工程学报, 2009, 25(9): 295-300.
[
|
| [13] |
乌云嘎, 郑佳华, 李邵宇, 等. 阴山北麓农牧交错区不同弃耕演替时期土壤质量评价[J]. 草业科学, 2024, 41(3): 548-560.
[Wuyunga,
|
| [14] |
|
| [15] |
李森, 王涛, 颜长珍. 1965—2015年毛乌素沙地人类活动强度时空变化研究[J]. 兰州大学学报(自然科学版), 2021, 57(3): 330-337.
[
|
| [16] |
吴波. 沙质荒漠化土地景观分类与制图——以毛乌素沙地为例[J]. 植物生态学报, 2000, 24(1): 52-57.
[
|
| [17] |
|
| [18] |
米胜渊, 谭雪兰, 谭杰扬, 等. 近30年来洞庭湖地区水稻种植面积演变的影响因素分析[J]. 自然资源学报, 2020, 35(10): 2499-2510.
[
|
| [19] |
陈航, 谭永忠, 邓欣雨, 等. 撂荒耕地信息获取方法研究进展与展望[J]. 农业工程学报, 2020, 36(23): 258-268.
[
|
| [20] |
陶泽涪, 王世清, 孙丕苓, 等. 中国北方农牧交错带耕地时空分异及驱动因素[J]. 干旱区地理, 2022, 45(1): 153-163.
[
|
| [21] |
李志鹏, 曹晓明, 丁杰, 等. MODIS卫星影像显示的2001—2017年中国荒漠化年度状况[J]. 中国沙漠, 2019, 39(6): 135-140.
[
|
| [22] |
修晓敏, 吴波, 费兵强, 等. 基于Meta分析的毛乌素沙地荒漠化动态研究[J]. 干旱区地理, 2024, 47(12): 2051-2063.
[
|
| [23] |
伊克昭盟地方志编纂委员会. 伊克昭盟志[M]. 北京: 现代出版社, 1994.
[Yikzhao League Local Chronicle Compilation Committee. Yikzhao League Chronicles[M]. Beijing: Modern Press, 1994.]
|
| [24] |
|
| [25] |
|
| [26] |
敏玉芳, 冯克庭, 康建芳, 等. 2000—2017年中巴经济走廊逐年荒漠化分布数据集[J]. 中国科学数据, 2019, 4(3): 75-85.
[
|
| [27] |
|
| [28] |
|
| [29] |
吴波. 毛乌素沙地的景观动态与荒漠化成因研究[D]. 北京: 中国科学院研究生院(国家计划委员会自然资源综合考察委员会), 2006.
[
|
| [30] |
|
| [31] |
|
| [32] |
|
| [33] |
石辉, 刘秀花, 陈占飞, 等. 陕北榆林毛乌素沙地大规模土地整治开发的生态环境问题及其对策[J]. 生态学杂志, 2019, 38(7): 2228-2235.
[
|
| [34] |
朱聪, 曲春红, 司智陟. 2020年牛羊肉市场形势分析及2021年展望[J]. 农业展望, 2021, 17(3): 11-16.
[
|
| [35] |
曲春红, 司智陟. 2014年牛羊肉市场形势分析及2015年展望[J]. 农业展望, 2015, 11(2): 13-17.
[
|
| [36] |
|
| [37] |
|
| [38] |
|
/
| 〈 |
|
〉 |