
内蒙古不同干湿区潜在蒸散发变化特征及主导因子分析
|
王志春(1974-),男,硕士,正高级工程师,主要从事农业气象、气候变化、气候资源与区划、生态等研究. E-mail: cfqxwzc@163.com |
收稿日期: 2024-08-10
修回日期: 2024-10-06
网络出版日期: 2026-03-11
基金资助
国家自然科学基金项目(41665007)
内蒙古自然科学基金项目(2024LHMS04020)
Changes characteristics and dominant factors of potential evapotranspiration in different dry and wet zones of Inner Mongolia
Received date: 2024-08-10
Revised date: 2024-10-06
Online published: 2026-03-11
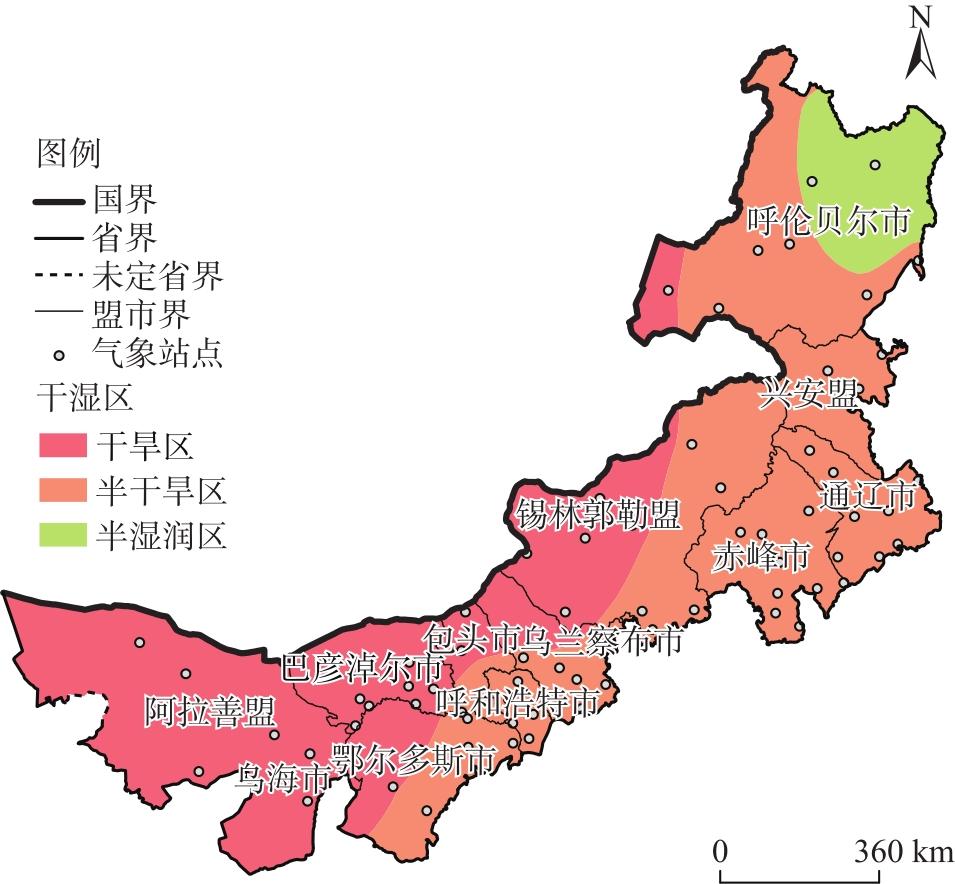
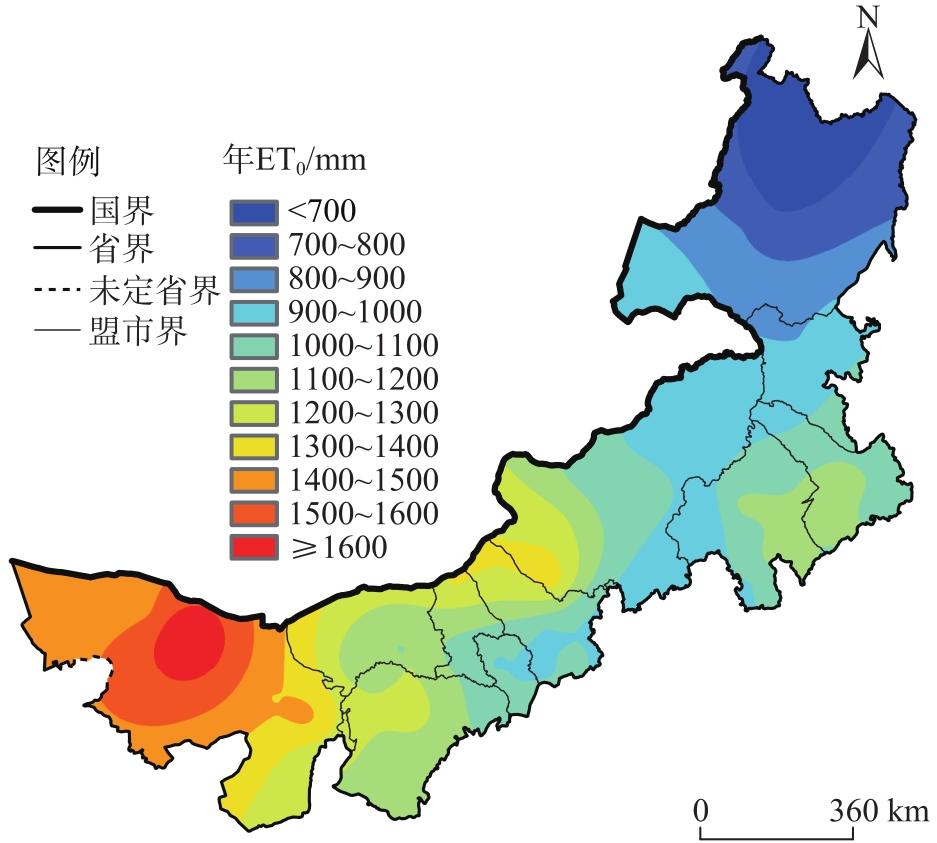
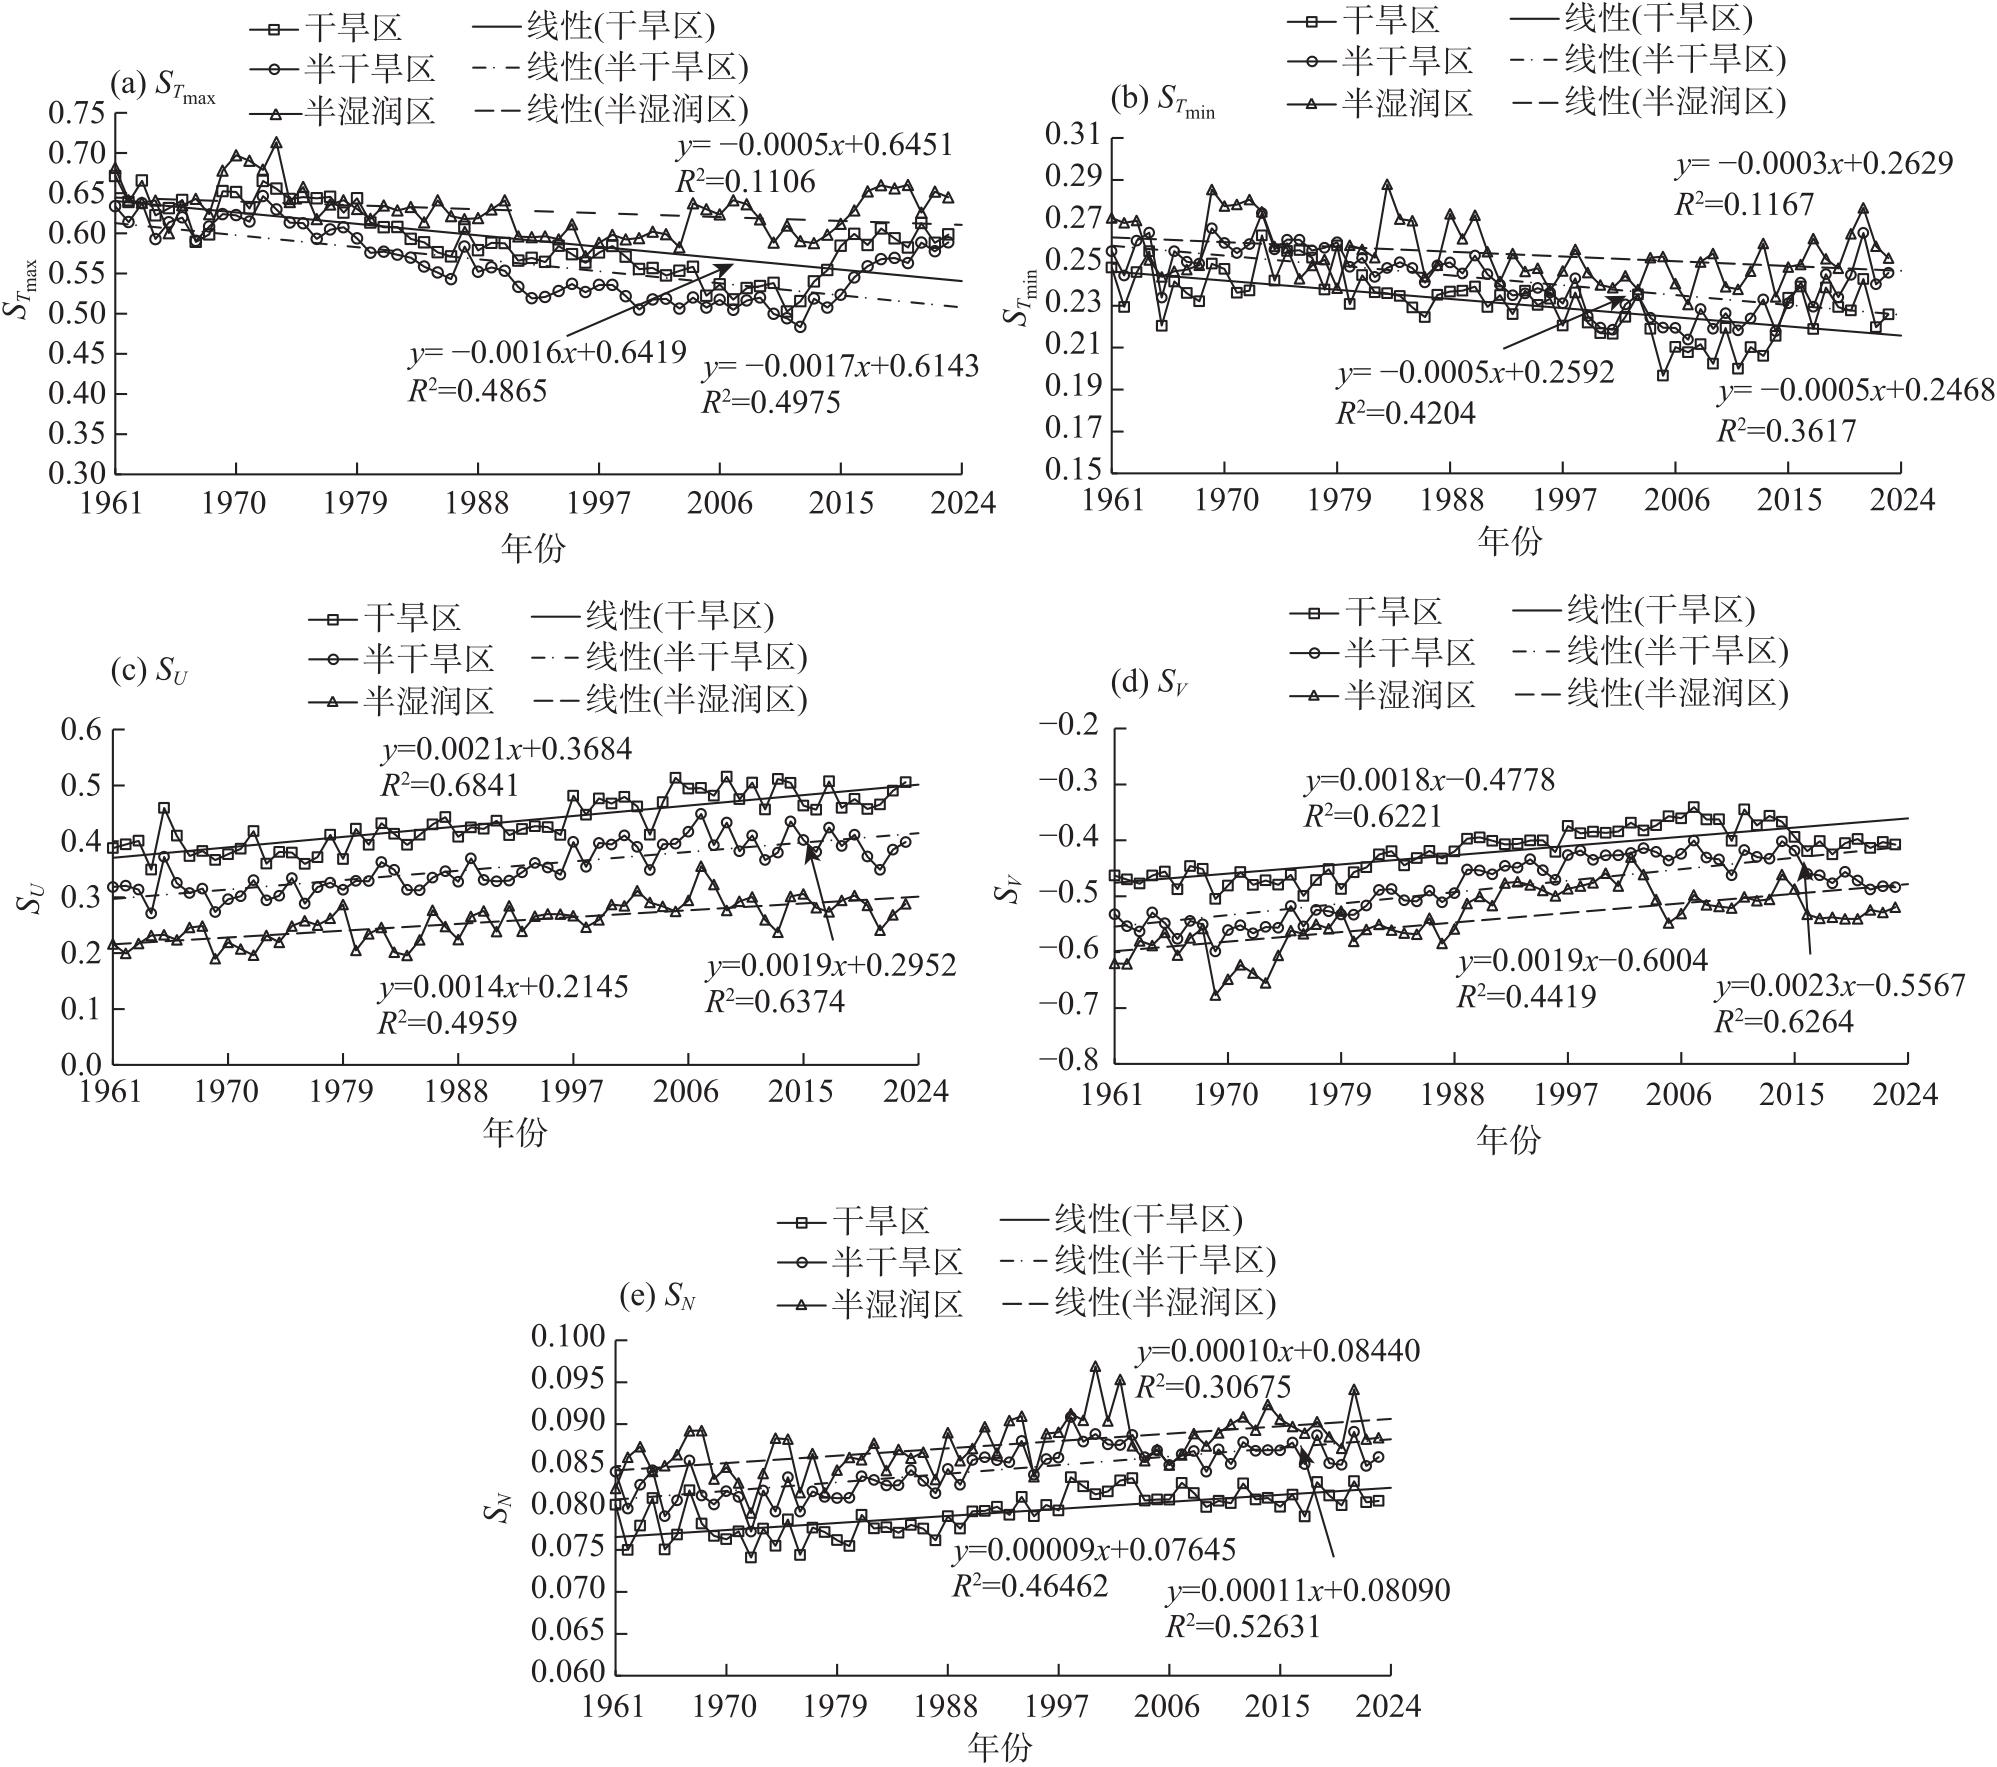
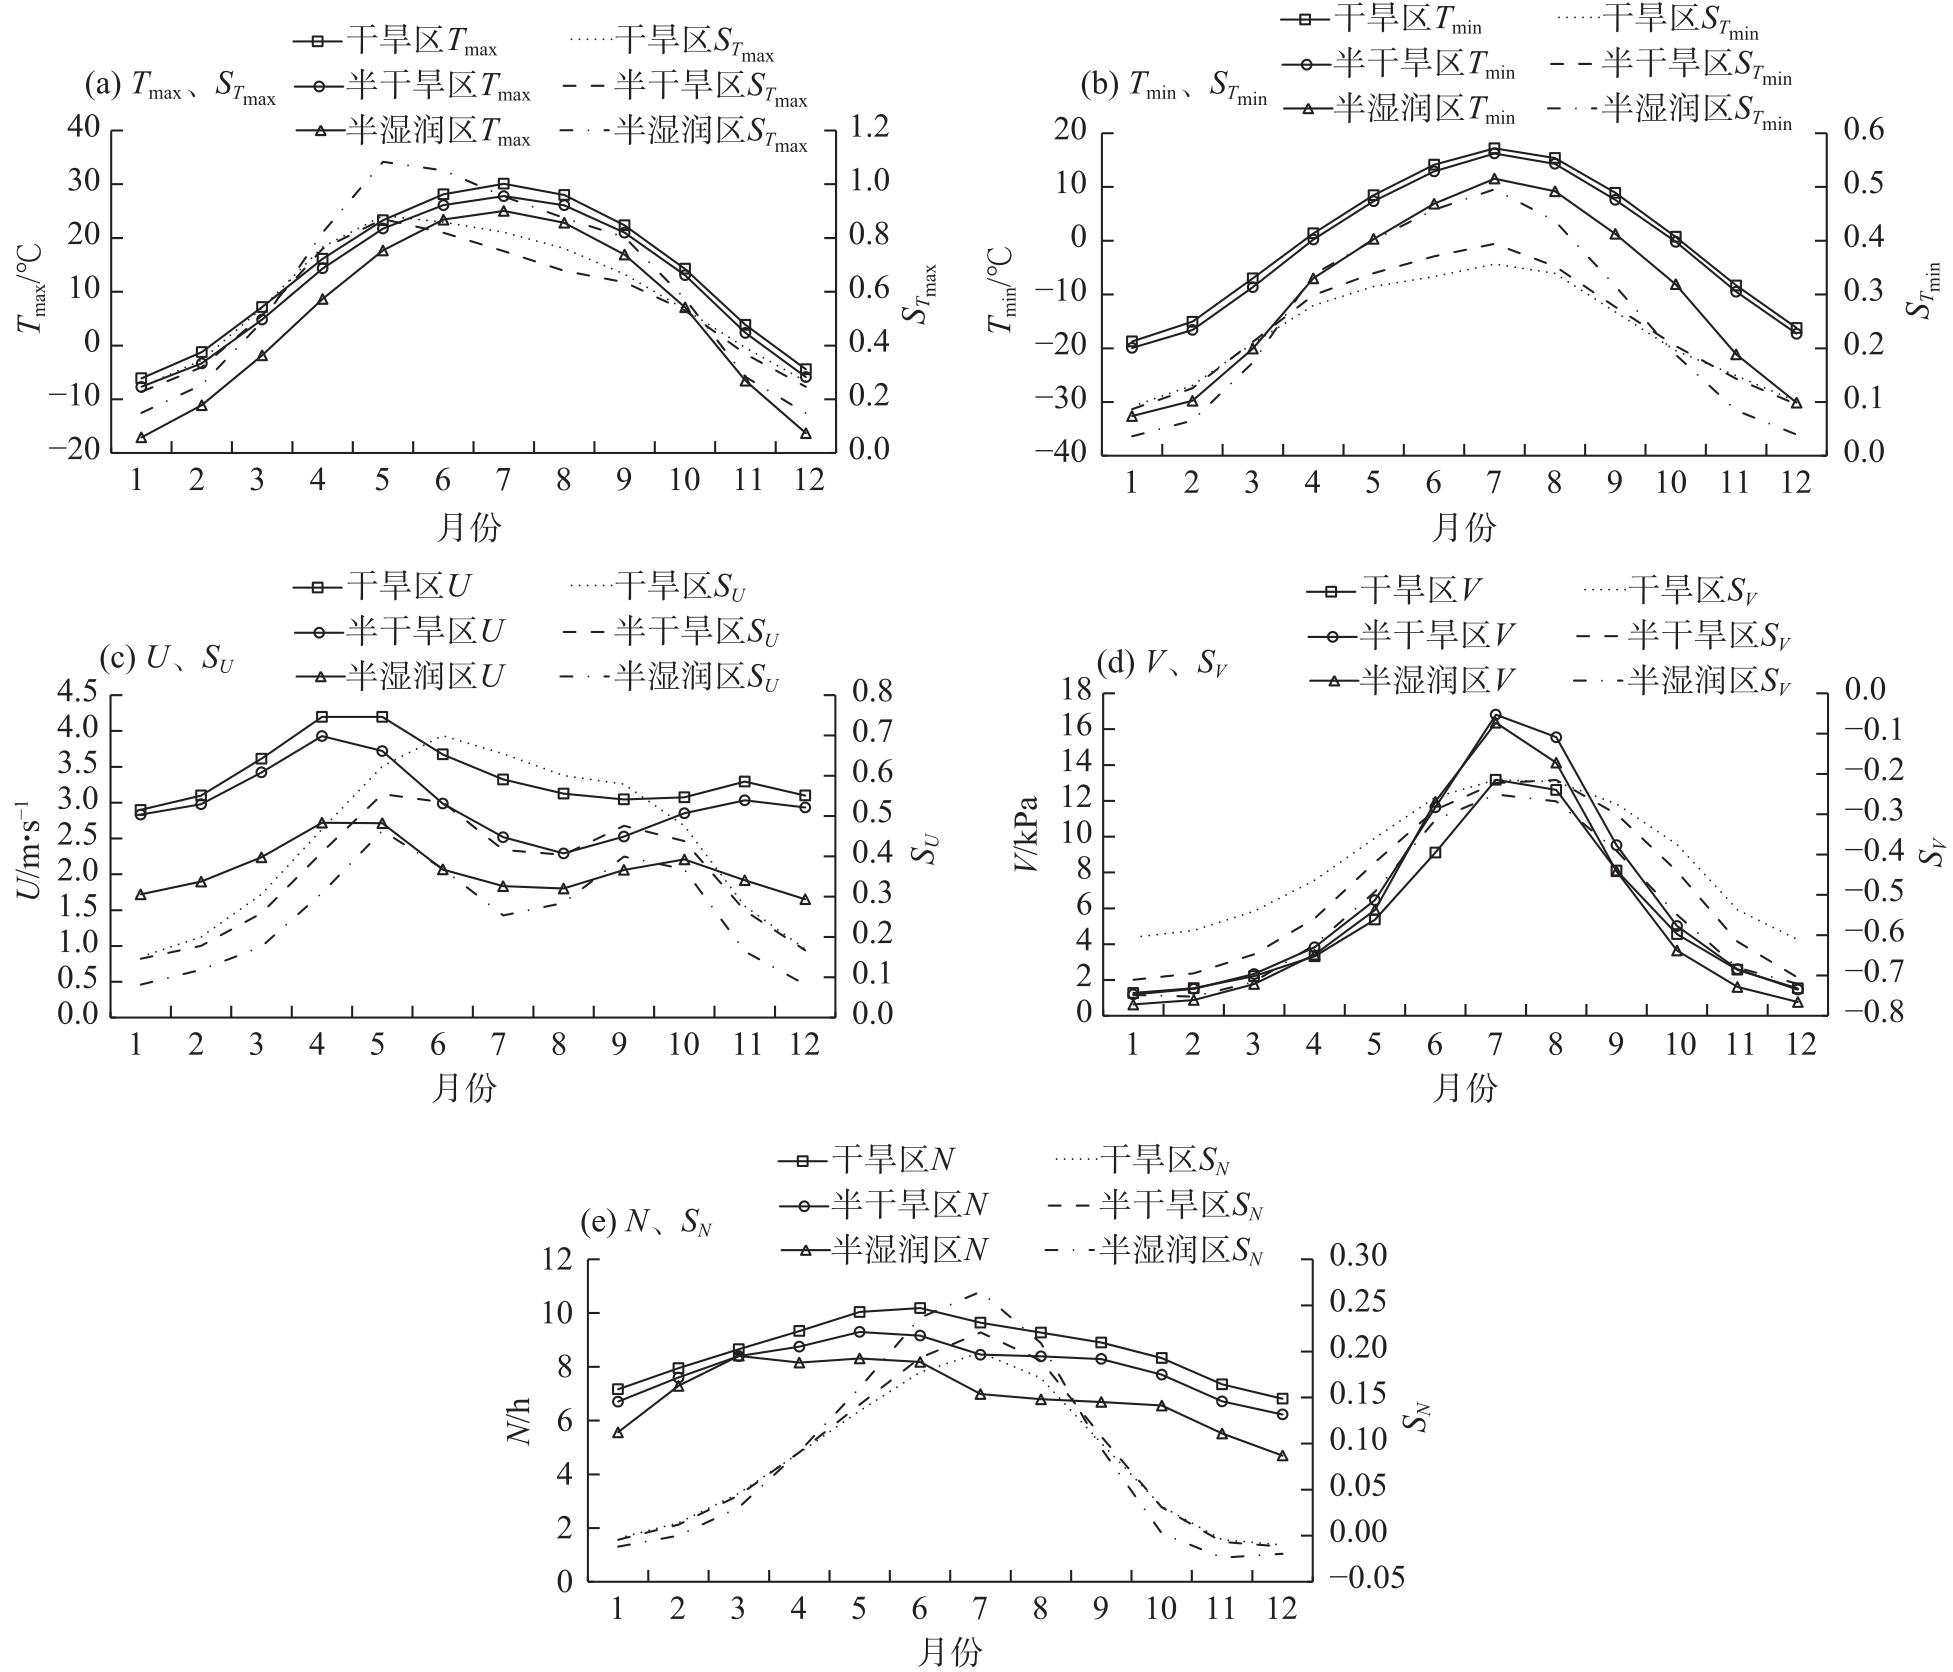
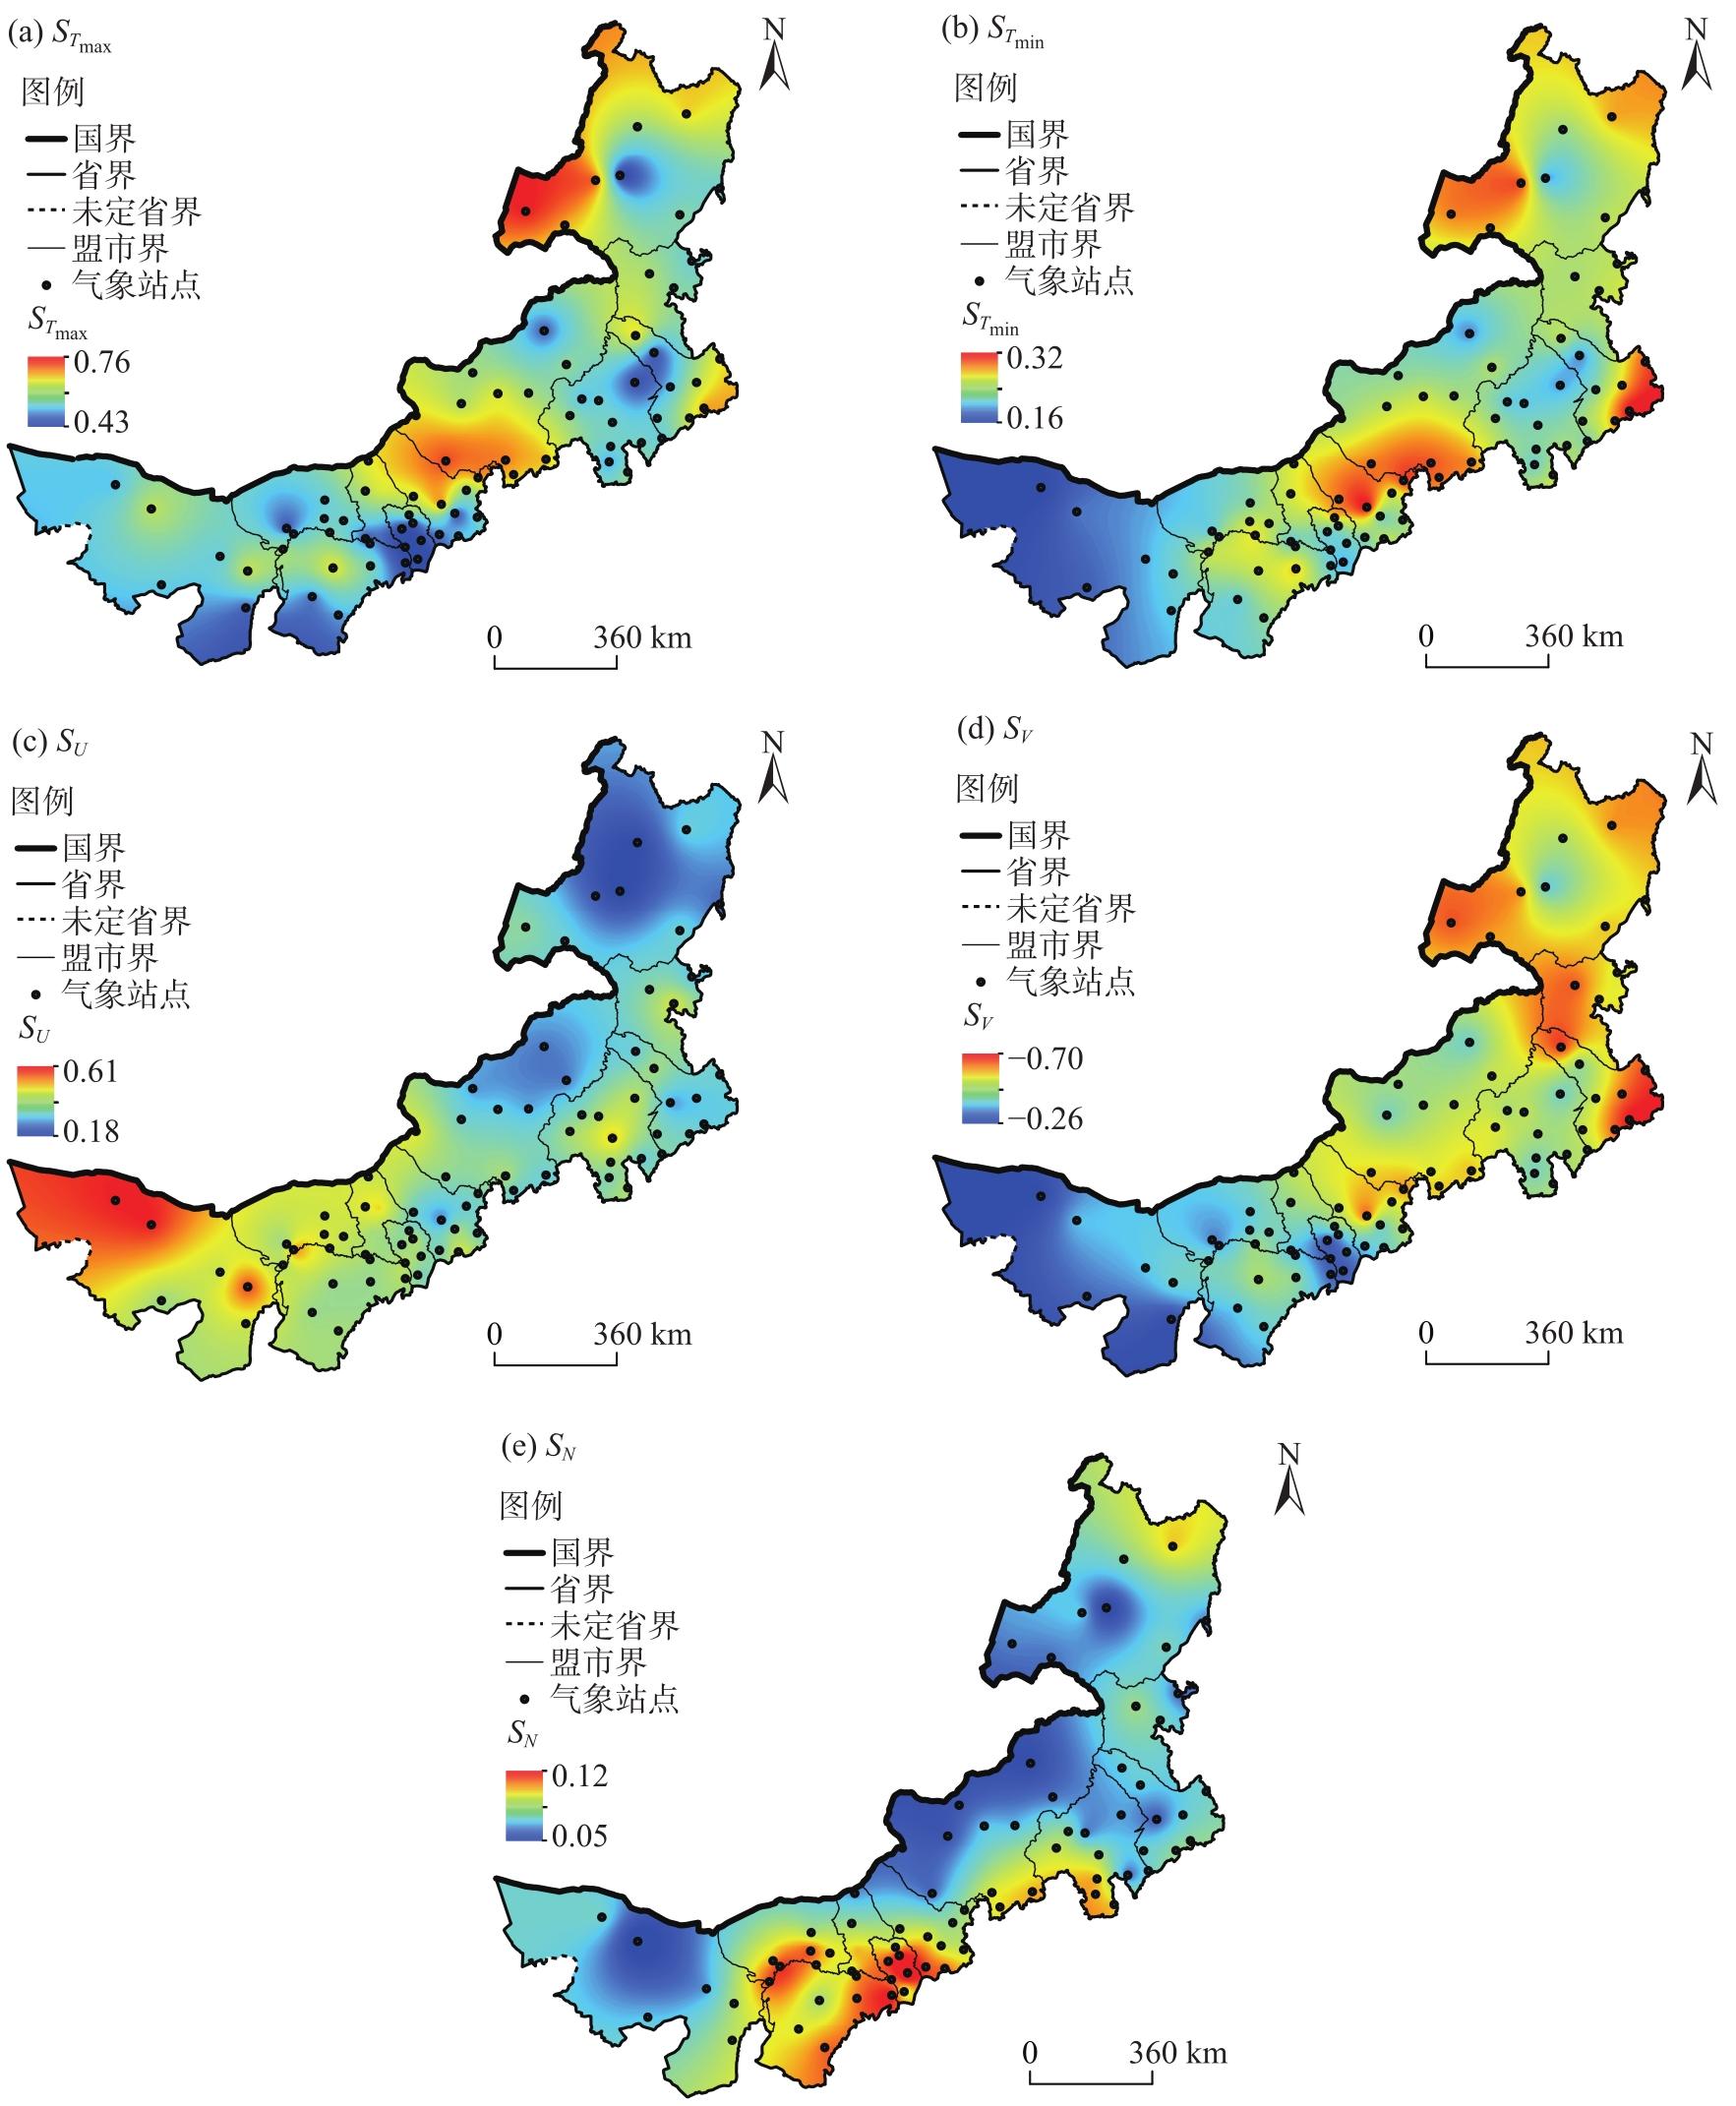
分析不同干湿区潜在蒸散发时空变化及其对气象因子的敏感性,有助于优化农牧林业用水管理及水资源规划和配置,及预测气候变化对水资源的影响。鉴于内蒙古干湿状况和气候条件多样,且为气候变化显著区,基于FAO Penman-Monteith公式计算了内蒙古76个气象站1961—2023年潜在蒸散发ET0及其对气温、风速、水汽压和日照时数的敏感系数,探讨了气候变化下内蒙古不同干湿区ET0变化的主导因子及ET0对气候变化的定量响应。结果表明:(1) 空间上ET0大体表现为经向由西向东、纬向由南向北递减的趋势,干旱区和半干旱区的ET0变化趋势不明显,半湿润区ET0呈增加趋势。(2) 各干湿区ET0对气象因子的敏感性表现为对最高气温最敏感,其次是水汽压、风速、最低气温,对日照时数最不敏感。(3) 不同干湿区各气象因子敏感系数的变化趋势均一致,气温敏感系数和水汽压敏感系数呈减小的态势,风速敏感系数和日照敏感系数呈增加态势,水汽压敏感系数和风速敏感系数变化显著。(4) 最高气温、最低气温变化对ET0变化为正贡献,风速、水汽压、日照变化对ET0变化为负贡献,日照在各干湿区对ET0变化贡献都最小,干旱区和半干旱区风速为ET0变化的主导因子,半湿润区最高气温为ET0变化的主导因子。
王志春 , 王彦平 , 徐震宇 , 薛文超 . 内蒙古不同干湿区潜在蒸散发变化特征及主导因子分析[J]. 干旱区地理, 2025 , 48(4) : 612 -622 . DOI: 10.12118/j.issn.1000-6060.2024.480
The analysis of the spatial and temporal variations in potential evapotranspiration and its sensitivity to meteorological factors in different dry and wet zones is essential for optimizing water resource management in agriculture, animal husbandry, forestry, and water resource planning and allocation, as well as for predicting the impact of climate change on water resources. Given the diverse dry and wet conditions and climatic conditions in Inner Mongolia, China, a region significantly affected by climate change, the sensitivity coefficients of potential evapotranspiration to air temperature, wind speed, water vapor pressure, and sunshine hours were calculated based on the Penman-Monteith formula of the FAO for 76 meteorological stations in Inner Mongolia from 1961 to 2023. The dominant factors influencing potential evapotranspiration in different dry and wet zones and its quantitative response to climate change were investigated. The results indicate that: (1) Spatially, potential evapotranspiration generally decreases from west to east in the longitudinal direction and from south to north in the latitudinal direction. In arid and semi-arid zones, the trend in potential evapotranspiration is not pronounced, whereas in semihumid zones, an increasing trend is observed. (2) The sensitivity of potential evapotranspiration to meteorological factors follows this order: maximum air temperature is the most sensitive factor, followed by water vapor pressure, wind speed, and minimum air temperature, with sunshine hours being the least sensitive. (3) The sensitivity coefficients of all meteorological factors exhibit consistent trends across different dry and wet zones. The temperature sensitivity coefficient and vapor pressure sensitivity coefficient show a decreasing trend, whereas the wind speed sensitivity coefficient and sunshine hours sensitivity coefficient display an increasing trend, with significant changes observed for the water vapor pressure sensitivity coefficient and wind speed sensitivity coefficient. (4) Maximum and minimum air temperatures contribute positively to changes in potential evapotranspiration, whereas wind speed, water vapor pressure, and sunshine hours contribute negatively. Among these, sunshine hours have the least influence on potential evapotranspiration in all dry and wet zones. Wind speed is the dominant factor driving potential evapotranspiration changes in arid and semi-arid zones, while maximum air temperature is the dominant factor in semihumid zones.
表1 1961—2023年不同干湿区日平均 及气象因子Mann-Kendall趋势分析Tab. 1 Mann-Kendall trend analysis of daily mean and meteorological factors in different dry and wet zones from 1961 to 2023 |
| 干湿区 | /mm·(10a)-1 | /℃·(10a)-1 | /℃·(10a)-1 | U/m·s-1·(10a)-1 | V/kPa·(10a)-1 | N/h·(10a)-1 |
|---|---|---|---|---|---|---|
| 干旱区 | 0.003 | 0.328** | 0.519** | -0.133** | 0.032* | -0.088** |
| 半干旱区 | -0.003 | 0.281** | 0.459** | -0.159** | 0.049* | -0.079** |
| 半湿润区 | 0.018** | 0.384** | 0.412** | -0.063** | 0.090** | -0.001 |
注: 、 、 、 、 、 分别为潜在蒸散发、最高气温、最低气温、10 m平均风速、平均水汽压、日照时数。**表示通过α=0.01水平显著性检验,*表示通过α=0.05水平显著性检验,无标记则未通过α=0.05水平显著性检验。下同。 |
表2 不同干湿区气象因子对 变化的贡献及 实际变化Tab. 2 Contribution of meteorological factors to and actual relative change of in different wet and dry regions |
| 干湿区 | 气象因子贡献/% | 总贡献/% | 实际变化/% | 主导因子 | ||||
|---|---|---|---|---|---|---|---|---|
| 干旱区 | 7.05 | 4.40 | -7.63 | -2.06 | -1.17 | 0.59 | 0.55 | |
| 半干旱区 | 6.81 | 5.02 | -10.04 | -1.43 | -1.08 | -0.72 | -0.68 | |
| 半湿润区 | 10.57 | 5.01 | -3.34 | -6.12 | 0.00 | 6.12 | 6.31 | |
| [1] |
张宝忠, 许迪, 刘钰, 等. 多尺度蒸散发估测与时空尺度拓展方法研究进展[J]. 农业工程学报, 2015, 31(6): 8-16.
[
|
| [2] |
|
| [3] |
|
| [4] |
|
| [5] |
|
| [6] |
|
| [7] |
|
| [8] |
刘昌明, 张丹. 中国地表潜在蒸散发敏感性的时空变化特征分析[J]. 地理学报, 2011, 66(5): 579-588.
[
|
| [9] |
秦年秀, 陈喜, 薛显武, 等. 潜在蒸散发量计算公式在贵州省适用性分析[J]. 水科学进展, 2010, 21(3): 357-363.
[
|
| [10] |
陈晓菲, 任立良, 江善虎, 等. 赣江上游流域蒸散发量影响因素的遥感分析[J]. 水资源保护, 2014, 30(2): 33-37.
[
|
| [11] |
朱国锋, 何元庆, 蒲焘, 等. 1960—2009年横断山区潜在蒸发量时空变化[J]. 地理学报, 2011, 66(7): 905-916.
[
|
| [12] |
张永生, 陈喜, 高满, 等. 不同气候区潜在蒸散发全局敏感性分析[J]. 河海大学学报(自然科学版), 2017, 45(2): 137-144.
[
|
| [13] |
|
| [14] |
李红阳, 陈天宇, 王圣杰, 等. 1979—2021年新疆昆仑山北坡潜在蒸散时空变化研究[J]. 干旱区地理, 2024, 47(9): 1443-1450.
[
|
| [15] |
封志明, 孙小舟, 杨艳昭. 西辽河流域1952年—2007年参考作物蒸散量的变化趋势[J]. 资源科学, 2009, 31(3): 479-484.
[
|
| [16] |
李媛, 谢应忠, 王亚娟. 宁夏中部干旱带潜在蒸散量变化及影响因素[J]. 生态学报, 2016, 36(15): 4680-4688.
[
|
| [17] |
周秉荣, 李凤霞, 肖宏斌, 等. 三江源区潜在蒸散时空分异特征及气候归因[J]. 自然资源学报, 2014, 29(12): 2068-2077.
[
|
| [18] |
王佳爽, 高晓瑜, 李为萍, 等. 塔布河流域潜在蒸散量时空变化特征及成因[J]. 干旱区研究, 2024, 41(9): 1538-1547.
[
|
| [19] |
吴霜, 延晓冬, 杨伯钢, 等. 中国潜在蒸散量时空变化分析[J]. 北京测绘, 2022, 36(11): 1460-1464.
[
|
| [20] |
|
| [21] |
曾丽红, 宋开山, 张柏, 等. 东北地区参考作物蒸散量对主要气象要素的敏感性分析[J]. 中国农业气象, 2010, 31(1): 11-18.
[
|
| [22] |
王大刚, 于洋,
[
|
| [23] |
|
| [24] |
刘小莽, 郑红星, 刘昌明, 等. 海河流域潜在蒸散发的气候敏感性分析[J]. 资源科学, 2009, 31(9): 1470-1476.
[
|
| [25] |
曹永强, 高璐, 袁立婷, 等. 辽宁省潜在蒸散发量及其敏感性规律分析[J]. 地理科学, 2017, 37(9): 1422-1429.
[
|
| [26] |
王鹏涛, 延军平, 蒋冲, 等. 华北平原参考作物蒸散量时空变化及其影响因素分析[J]. 生态学报, 2014, 34(19): 5589-5599.
[
|
| [27] |
马亚丽, 牛最荣, 孙栋元. 河西走廊潜在蒸散发时空格局变化与气象因素的关系[J]. 干旱区地理, 2024, 47(2): 192-202.
[
|
| [28] |
王炳亮, 李国胜. 1961—2010年辽河三角洲参考蒸散发变化特征及主导因子分析[J]. 地理科学, 2014, 34(10): 1233-1238.
[
|
| [29] |
中国气象局气候变化中心. 中国气候变化蓝皮书(2024)[M]. 北京: 科学技术出版社, 2024: 1-5.
[China Meteorological Administration Climate Change Center. Blue book on climate change in China 2024[M]. Beijing: China Science and Technology Press, 2024: 1-5.]
|
| [30] |
王志春, 陈素华, 李超. 近57年西辽河流域气候变化特征分析[J]. 内蒙古农业大学学报(自然科学版), 2020, 41(1): 42-48.
[
|
| [31] |
苏立娟, 李喜仓, 邓晓东. 1951—2005年内蒙古东部气候变化特征分析[J]. 气象与环境学报, 2008, 24(5): 25-28.
[
|
| [32] |
李静, 何清, 姚俊强, 等. 内蒙古西部地区气候变化特征及影响因子分析[J]. 干旱区资源与环境, 2014, 28(5): 186-191.
[
|
| [33] |
安莉娟. 1971—2010年内蒙古干湿变化特征及对水资源影响[J]. 冰川冻土, 2016, 38(3): 732-740.
[
|
| [34] |
张存厚, 王明玖, 李兴华, 等. 近30年来内蒙古地区气候干湿状况时空分布特征[J]. 干旱区资源与环境, 2011, 25(8): 70-75.
[
|
| [35] |
董晓宇, 姚华荣, 戴君虎, 等. 2000—2017年内蒙古荒漠草原植被物候变化及对净初级生产力的影响[J]. 地理科学进展, 2020, 39(1): 24-35.
[
|
| [36] |
张存杰, 刘海波, 宋艳玲, 等. GB/T 20481-2017. 气象干旱等级[S]. 北京: 中国标准出版社, 2017.
[
|
| [37] |
|
| [38] |
梁丽乔, 李丽娟, 张丽, 等. 松嫩平原西部生长季参考作物蒸散发的敏感性分析[J]. 农业工程学报, 2008, 24(5): 1-5.
[
|
| [39] |
曹雯, 申双和, 段春锋. 西北地区生长季参考作物蒸散变化成因的定量分析[J]. 地理学报, 2011, 66(3): 407-415.
[
|
| [40] |
|
/
| 〈 |
|
〉 |