
内蒙古中部地区风电场风速特性及尾流效应计算
|
贾晓红(1993-),女,硕士,工程师,主要从事新能源气象研究. E-mail: jiaxh22@sina.com |
收稿日期: 2024-05-09
修回日期: 2024-08-22
网络出版日期: 2026-03-11
基金资助
内蒙古自治区自然科学基金项目(2022MS04019)
内蒙古自治区“揭榜挂帅”项目(2024JBGS0054)
Wind speed characteristics and wake effect calculation of the wind farm in the central region of Inner Mongolia
Received date: 2024-05-09
Revised date: 2024-08-22
Online published: 2026-03-11
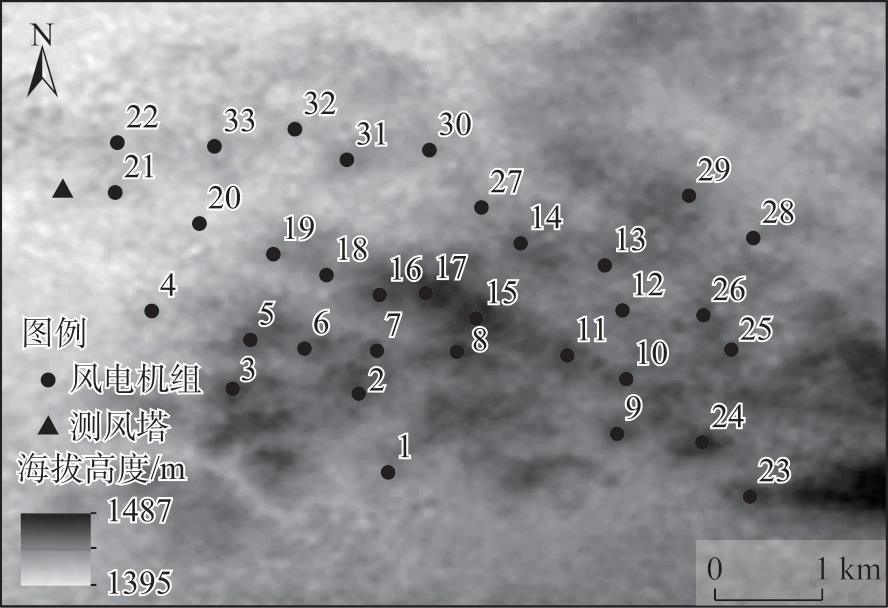
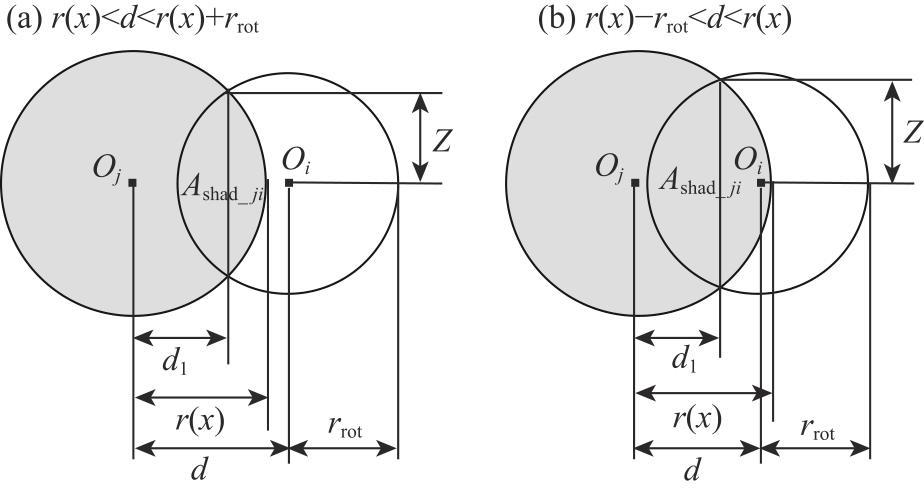
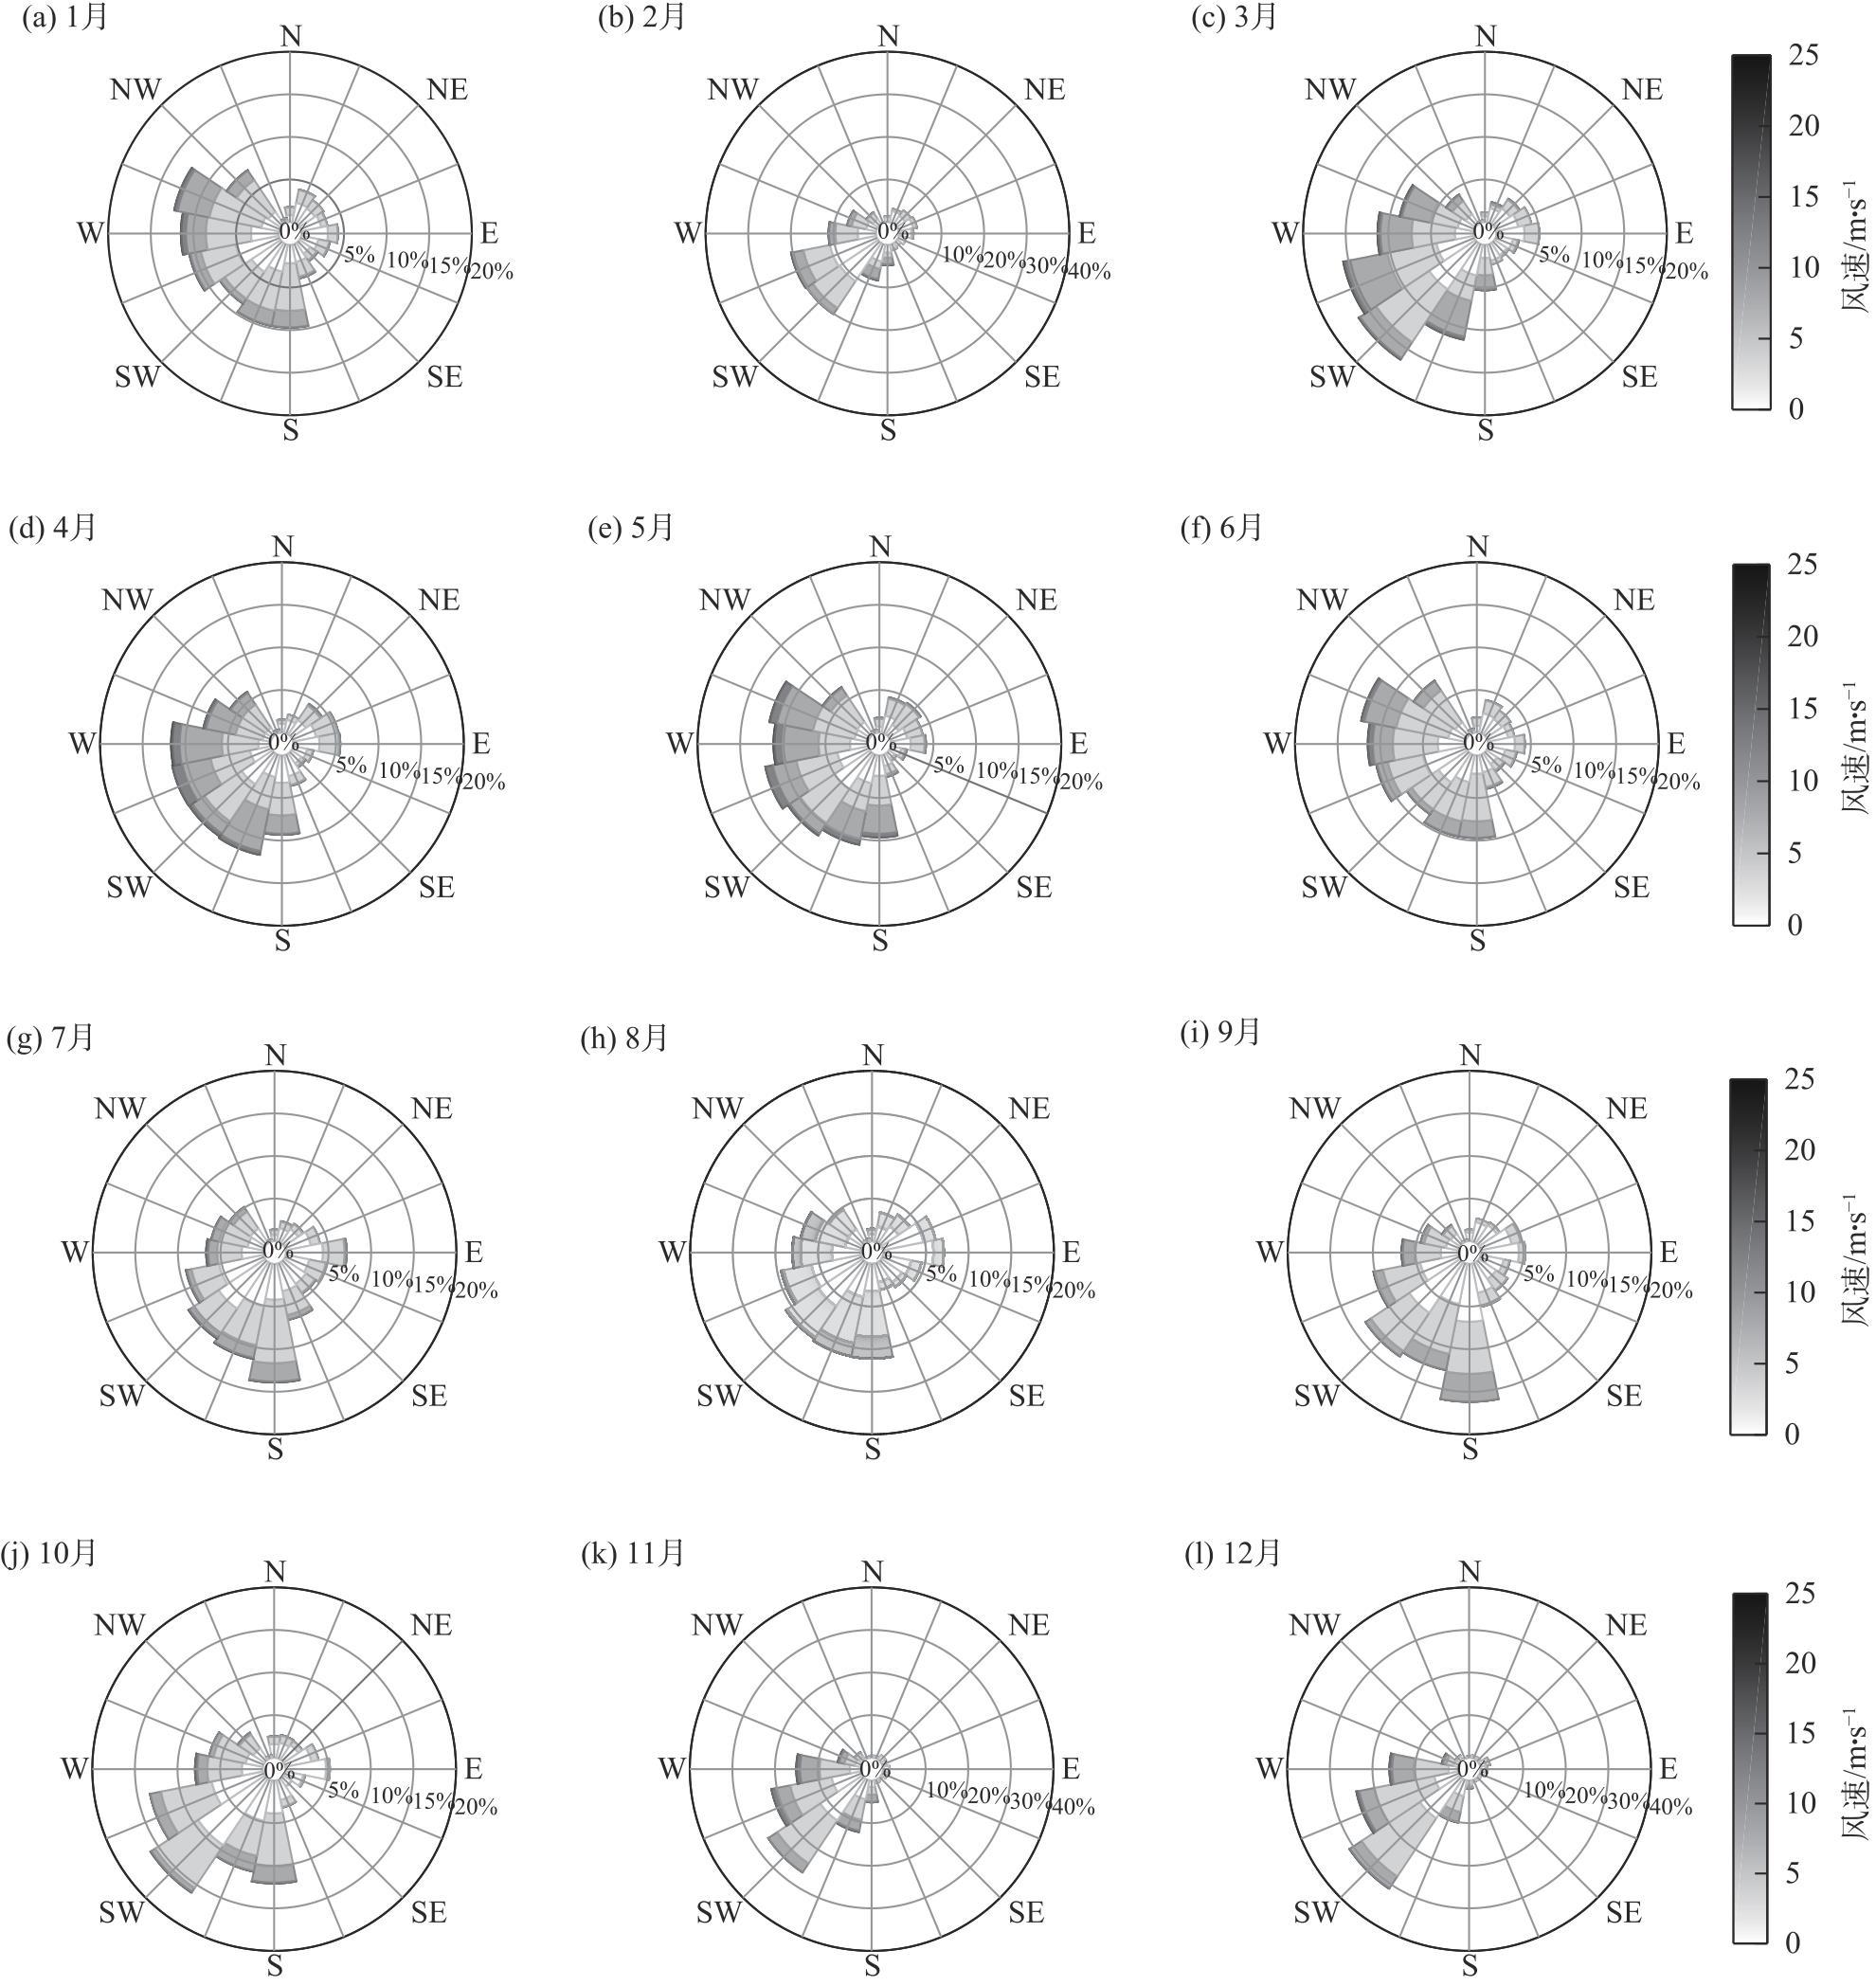
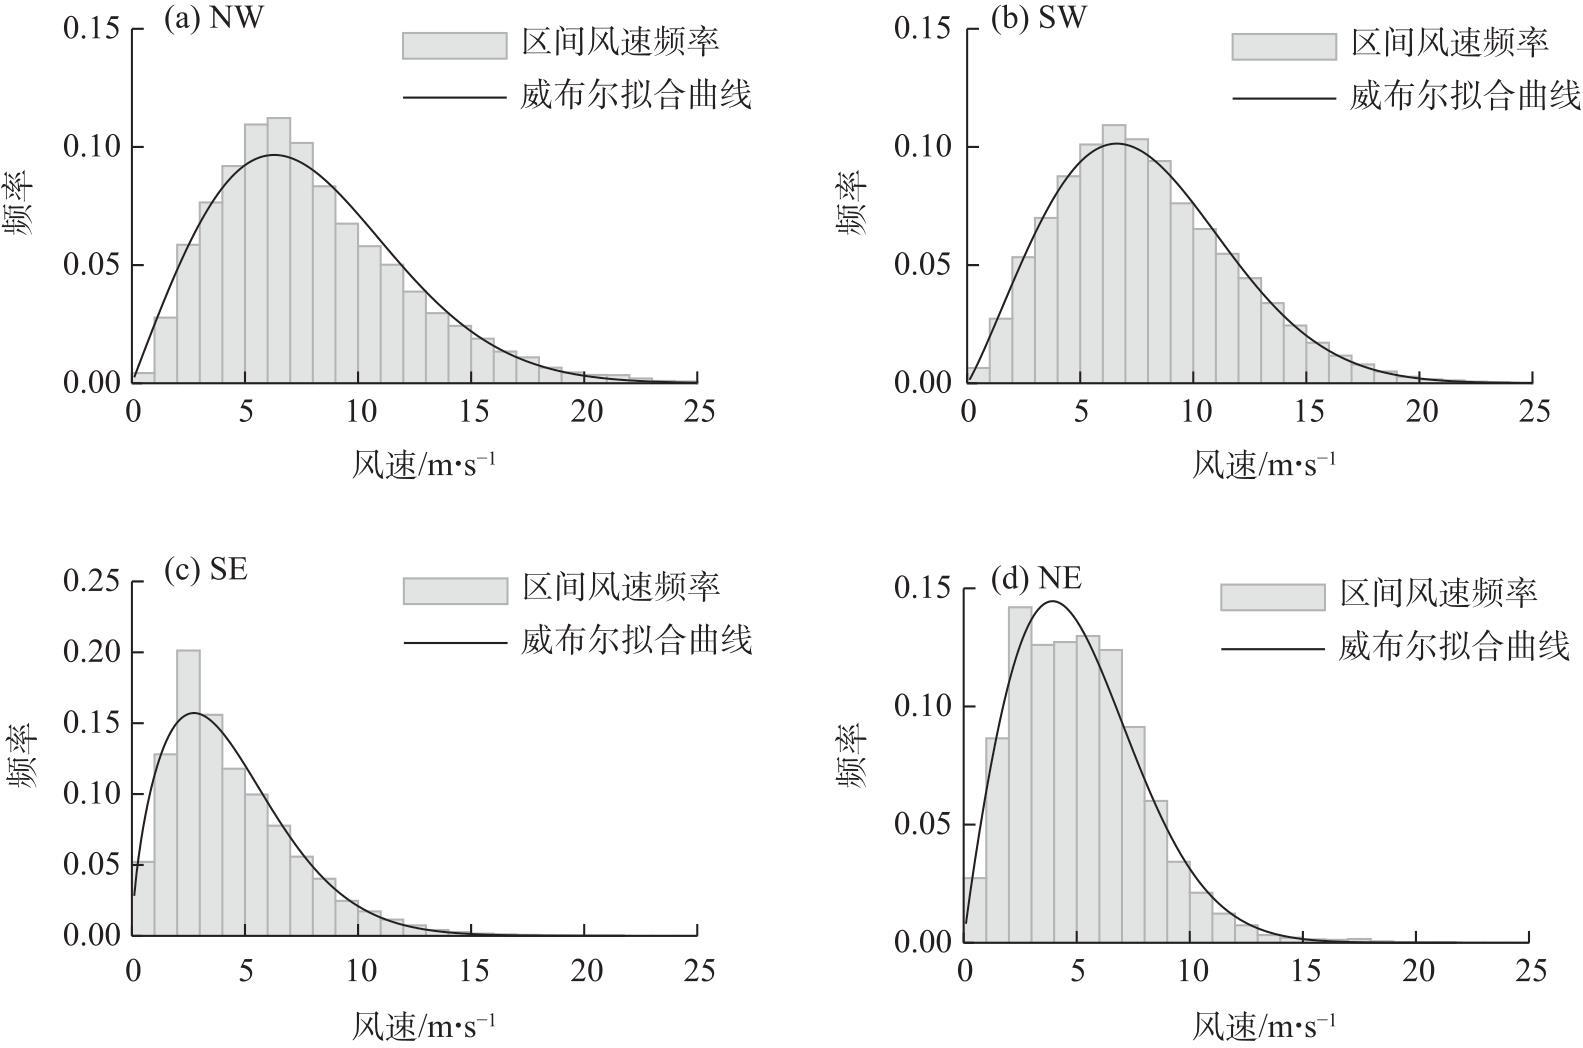
为研究风电场尾流特征及与气象条件的关系,选取内蒙古中部地区某风电场33台风电机组,统计分析了2021—2023年平均风速、风向、风频分布等风资源评估参数。基于Jensen尾流模型,计算不同风向及精细化主导风向尾流区风速,探讨考虑尾流效应后的风速与其他气象要素的相关性。结果表明:(1) 2021—2023年内蒙古中部地区风电场以西南(SW)风为主,高频风向年内变化由偏西向偏南转变,月内风向集中且风速差较小。主导风向下平均风速最大,风速频率曲线呈现正偏态分布。(2) 各风向平均风速下,受尾流影响最大的风电机组风速损失率超过10%,其中西北(NW)、东南(SE)风向超过50%风电机组受尾流影响,风速损失集中分布在风电场东北(NE)向偏后位置,偏西风向风速减小更明显。(3) 气压、气温和湿度对不同风向风速日变化的影响程度不同,上述气象因子对风速的影响下,SW风向在4~5 m·s-1风速区间内尾流模型计算效果相对好于其他风速段,风速平均绝对百分比误差与相对湿度呈负相关。NW风向在9~10 m·s-1风速区间内尾流模型计算风速与实测更接近,误差与气压和气温都呈正相关。SE、NE风向分别在9~10 m·s-1、7~8 m·s-1风速区间尾流模型计算效果较好。研究结果可为风电机组尾流效应分析及风电场风速预测提供一定参考。
贾晓红 , 石岚 , 郝玉珠 . 内蒙古中部地区风电场风速特性及尾流效应计算[J]. 干旱区地理, 2025 , 48(3) : 421 -433 . DOI: 10.12118/j.issn.1000-6060.2024.289
To investigate the characteristics of wind farm wake effects and their relationship with meteorological conditions, 33 wind turbines from a wind farm in central Inner Mongolia, China were selected for analysis. Wind resource assessment parameters, including average wind speed, wind direction, and wind frequency distribution, were statistically analyzed from 2021 to 2023. Using the Jensen wake model, wind speeds in the wake area were calculated for different wind directions, with a focus on the refined dominant wind direction. The correlation between wind speeds and meteorological factors, accounting for wake effects, was also explored. The findings are as follows: (1) From 2021 to 2023, the wind farm in central Inner Mongolia was predominantly influenced by southwest winds. High-frequency wind directions shifted from west to south throughout the year. Monthly wind directions were relatively stable, with concentrated wind directions and small wind speed variations. The average wind speed was highest under the dominant wind direction, and the wind speed frequency curve exhibited a positively skewed distribution. (2) Under average wind speeds for each direction, turbines most affected by the wake experienced wind speed losses exceeding 10%. More than half of the turbines were affected by wake effects under northwest and southeast winds, with the most significant losses occurring in the northeasterly downstream positions of the wind farm. Wind speed reductions were particularly pronounced under westerly winds. (3) The impact of barometric pressure, air temperature, and humidity on daily wind speed variation differed across wind directions. For southwest winds, the wake model performed best in the 4-5 m·s-1 wind speed range, with the average absolute percentage error of wind speed negatively correlated with relative humidity. For northwest winds in the 9-10 m·s-1 range, the wake model calculations closely matched measured wind speeds, with errors positively correlated with barometric pressure and temperature. In addition, the wake model performed well in the 9-10 m·s-1 and 7-8 m·s-1 ranges for southeast and northeast winds, respectively. These results provide valuable insights into the analysis of wind turbine wake effects and wind speed predictions for wind farms.
Key words: wind farm; wind speed; wind direction; wake effect; meteorological factor
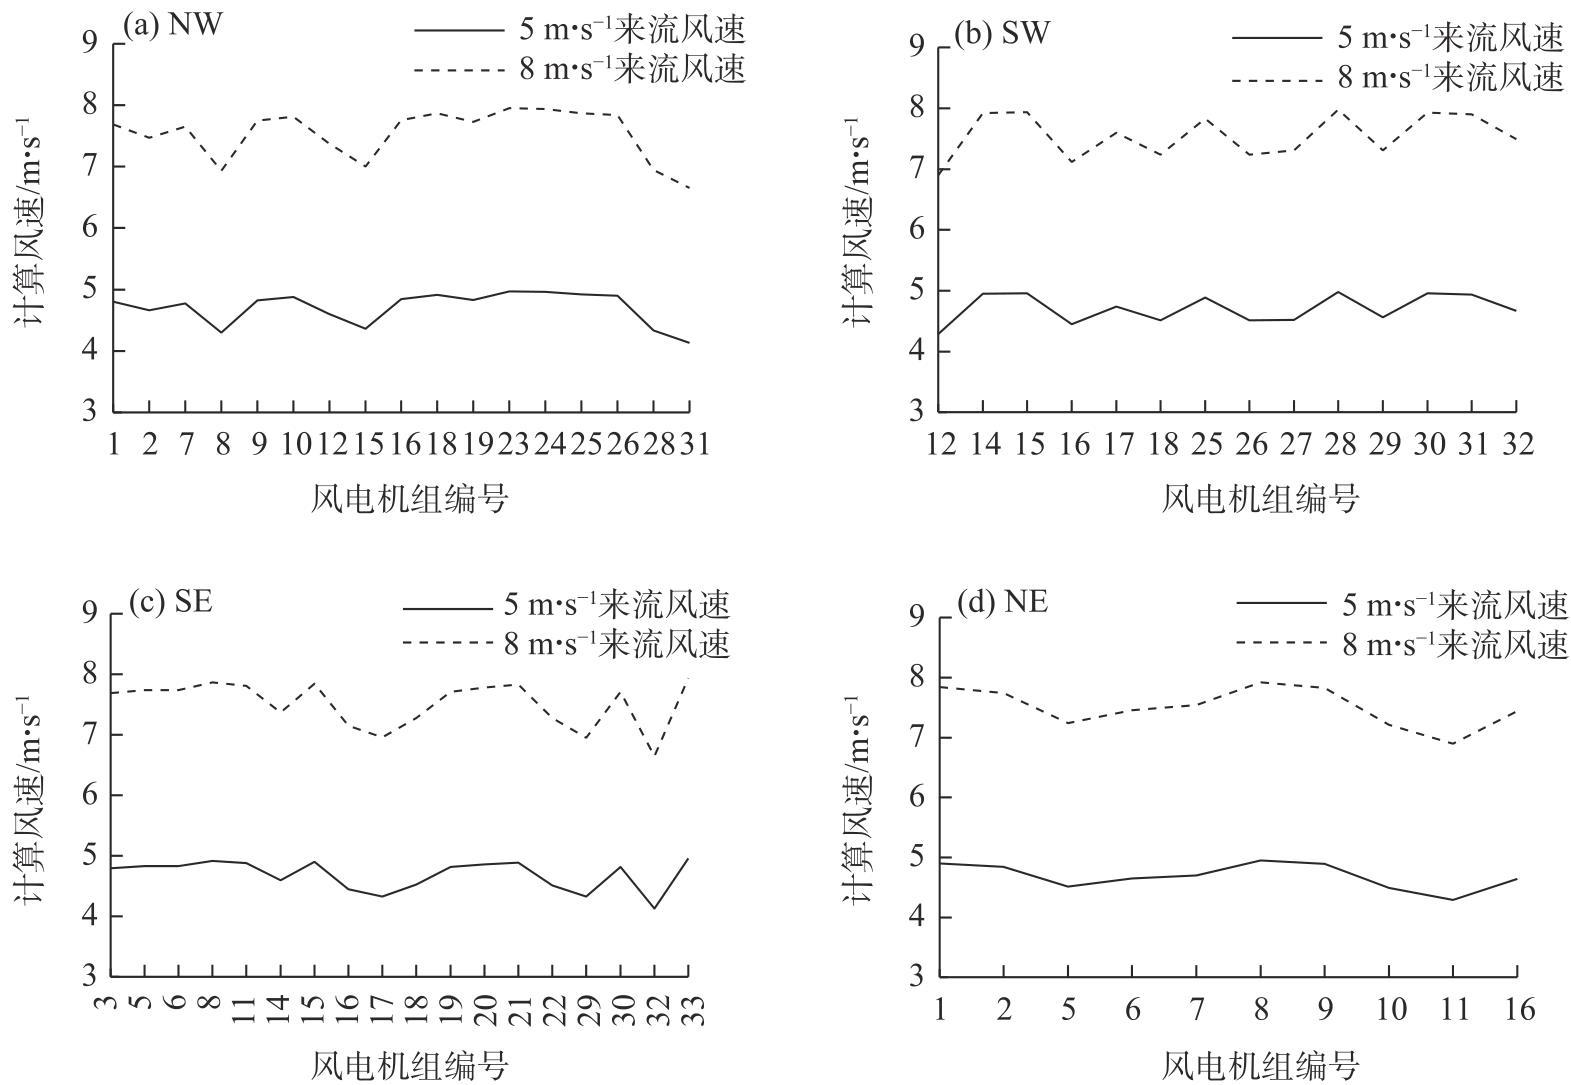
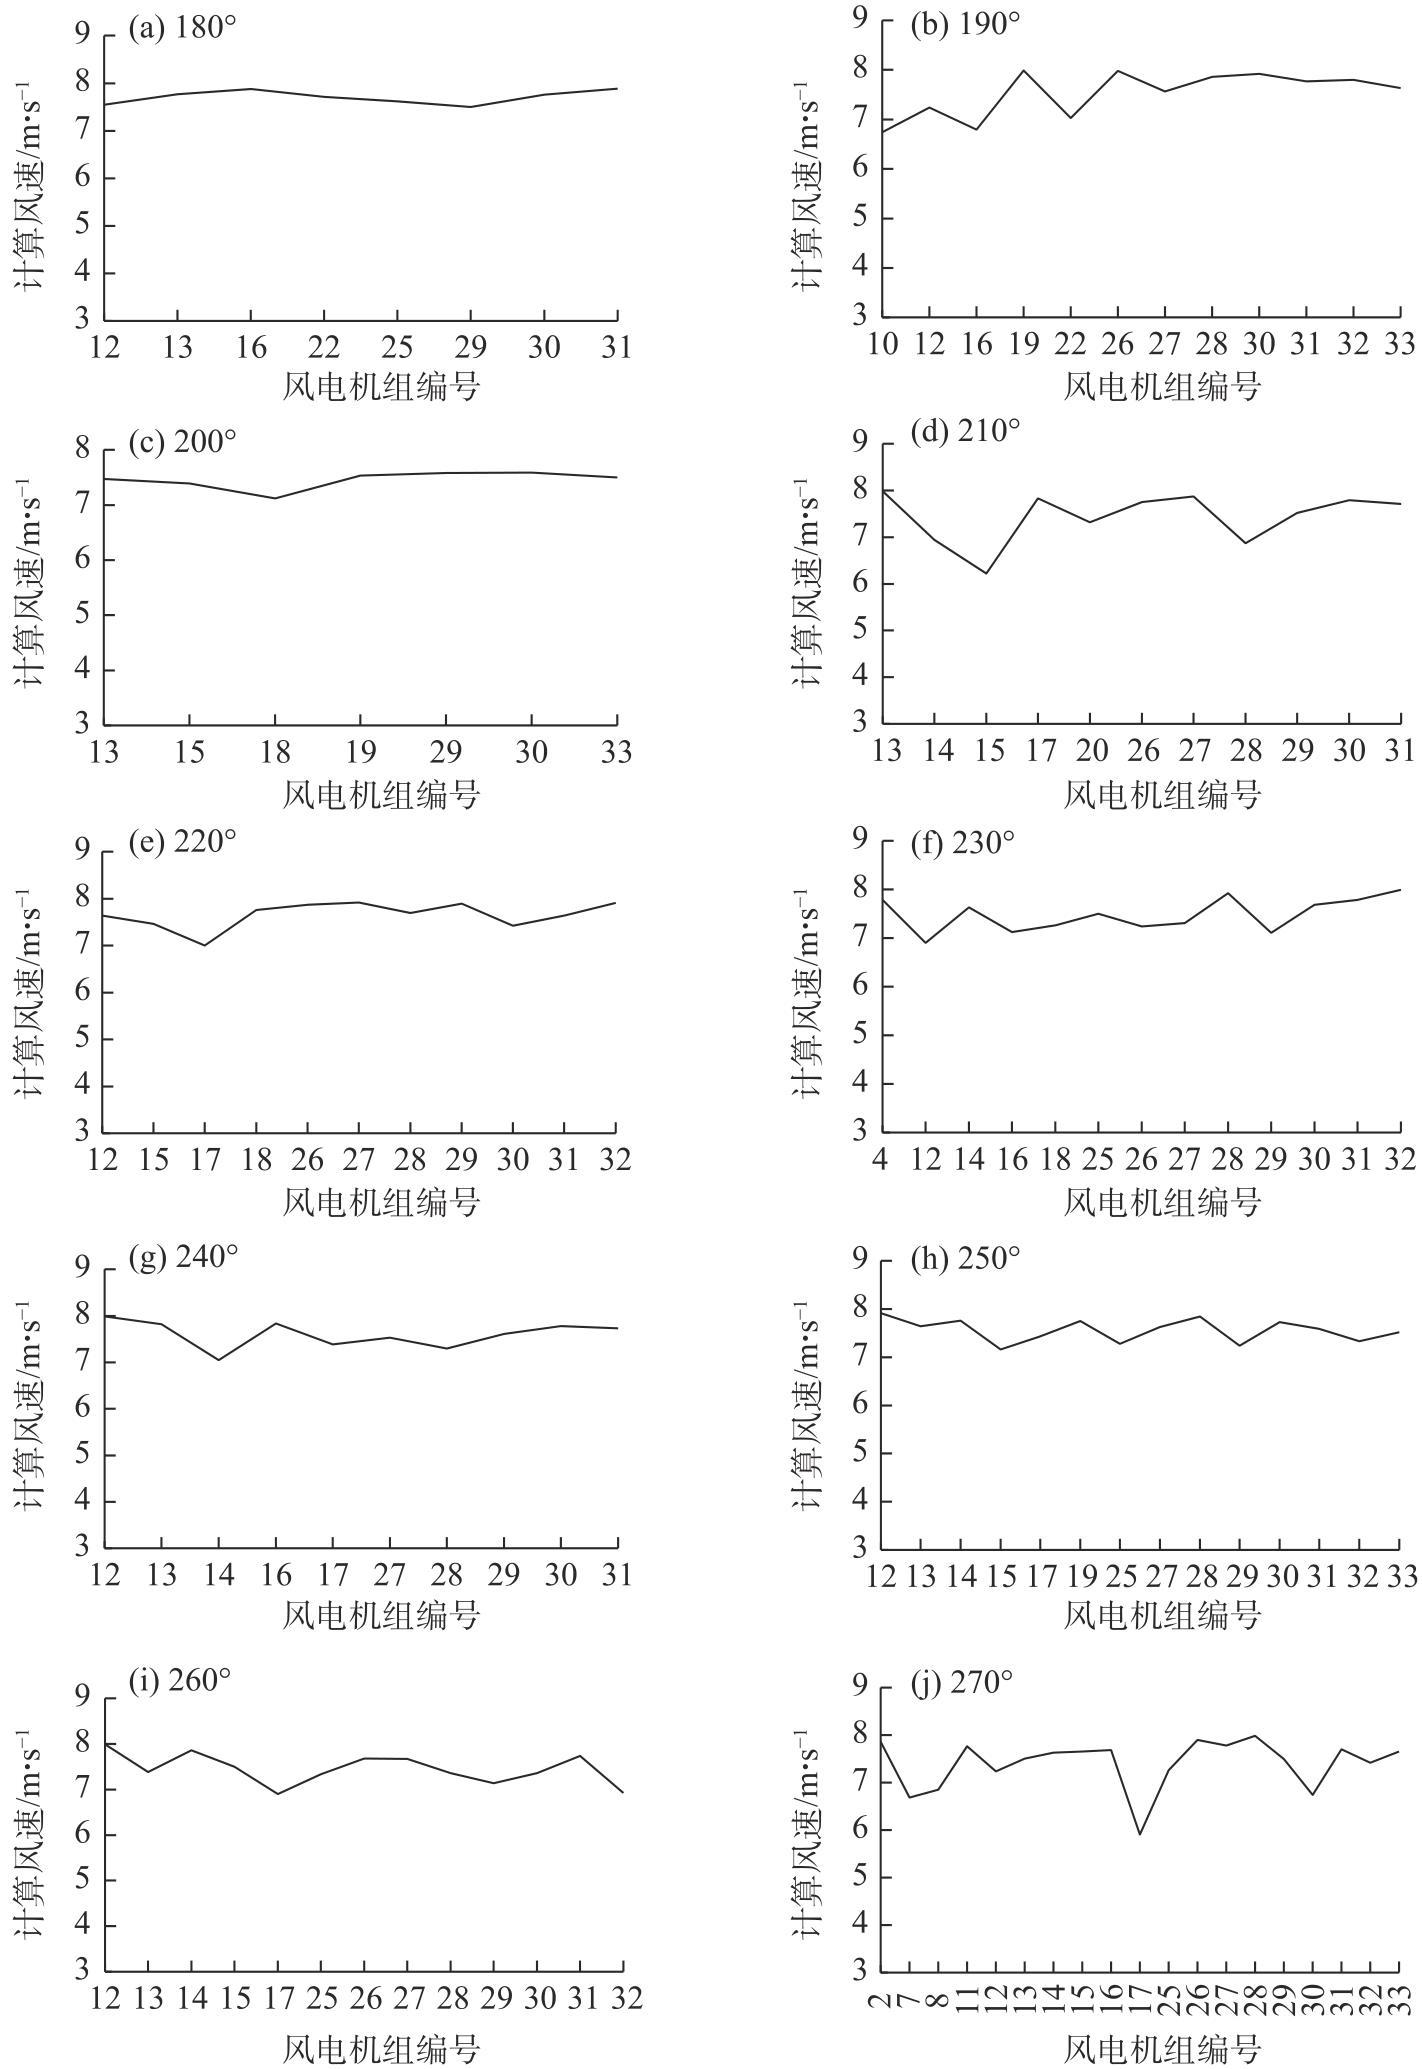
图8 5 m·s-1和8 m·s-1来流风速时不同风向各风电机组尾流模型计算风速Fig. 8 Calculated wind speeds of each wind turbine wake model for different wind directions at incoming wind speeds of 5 m·s-1 and 8 m·s-1 |
表1 5 m·s-1和8 m·s-1来流风速时不同风向风电机组风速最大损失率Tab. 1 Maximum loss rates of wind speed of wind turbines for different wind directions at incoming wind speeds of 5 m·s-1 and 8 m·s-1 |
| 风向 | 最大尾流损失 风电机组编号 | 5 m·s-1来流风速时最大损失率/% | 8 m·s-1来流风速时最大损失率/% |
|---|---|---|---|
| 西北(NW) | 31 | 17.4 | 16.9 |
| 西南(SW) | 12 | 14.2 | 13.8 |
| 东南(SE) | 32 | 17.4 | 16.9 |
| 东北(NE) | 11 | 14.2 | 13.8 |
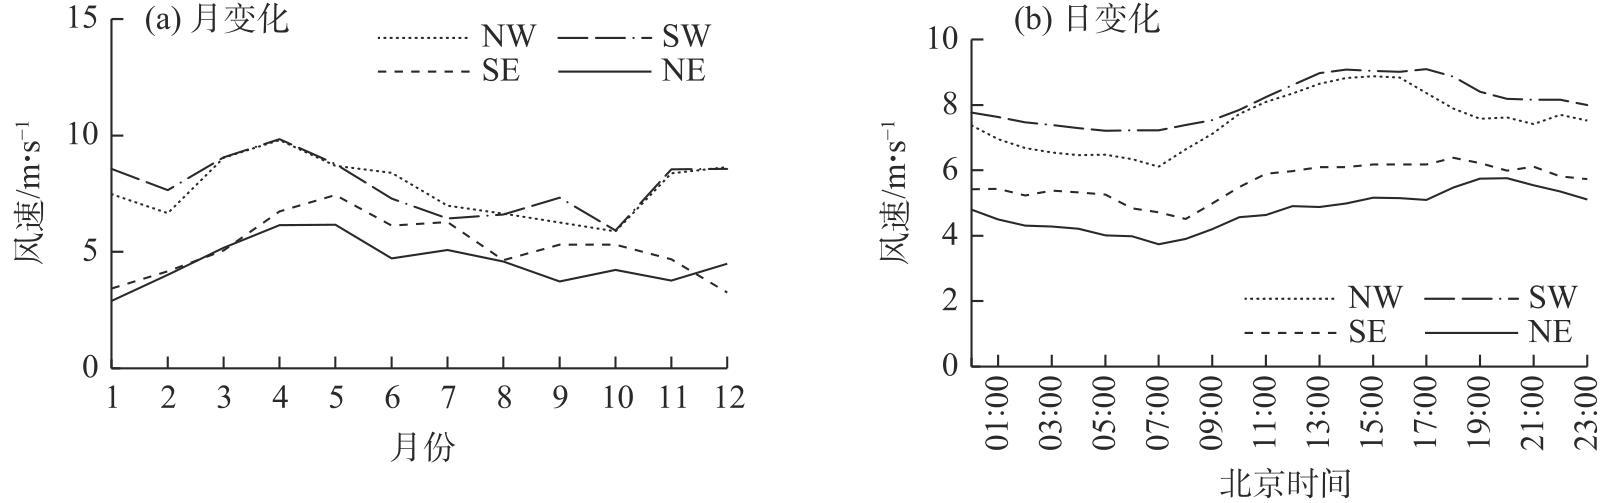
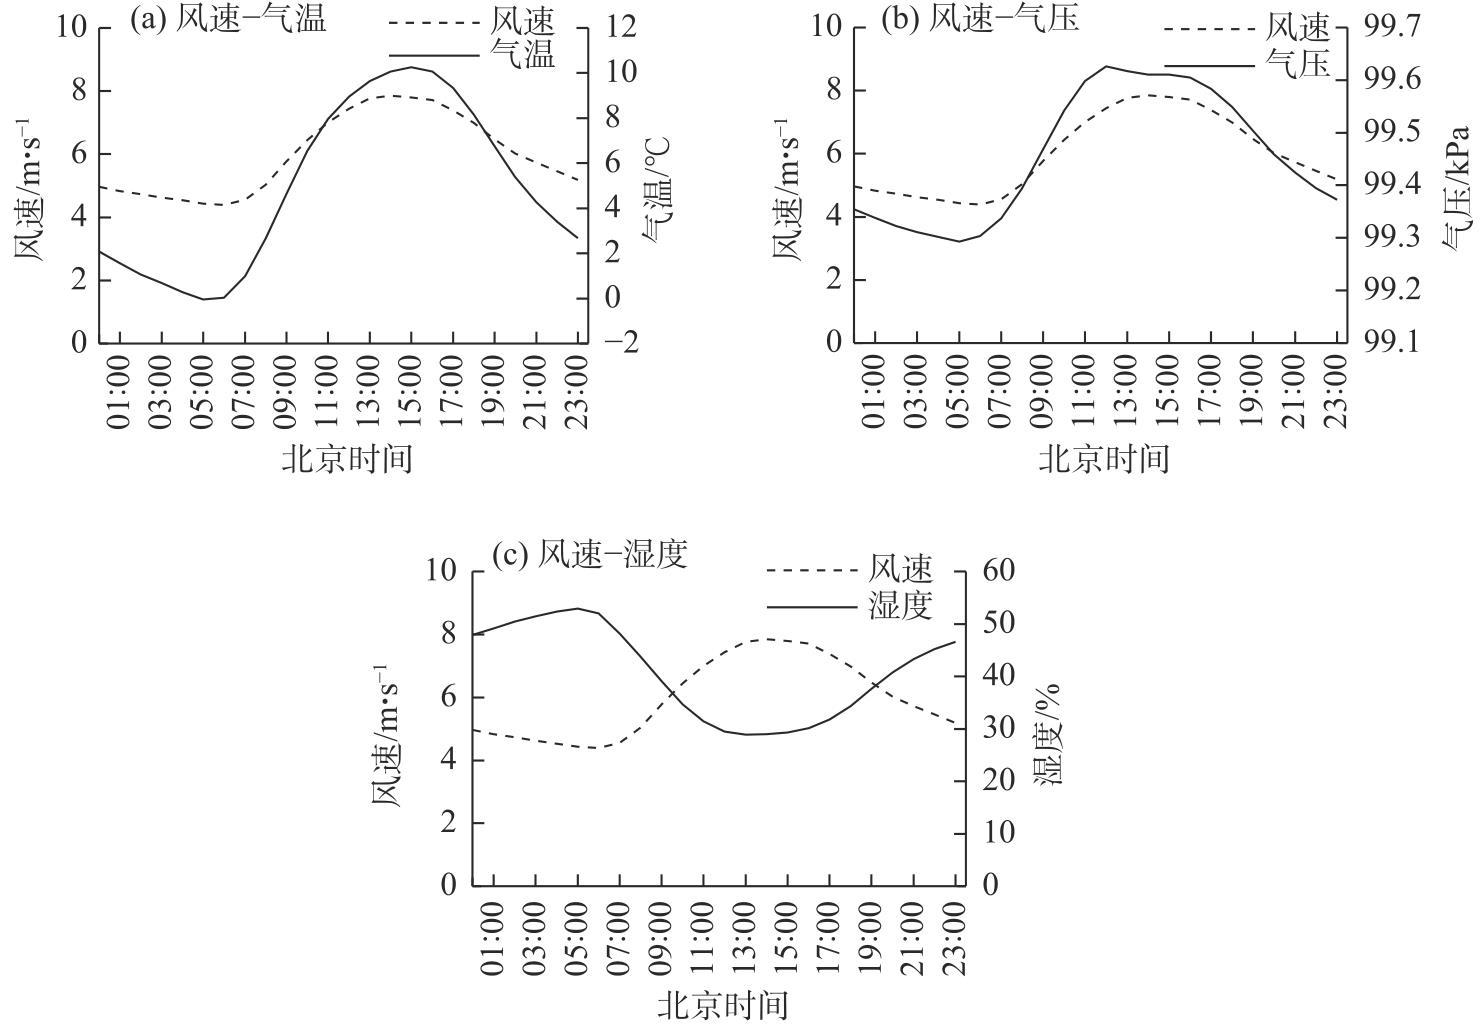
图10 测风塔风速与主要气象因子的日变化Fig. 10 Daily variations of wind speed and major meteorological factors in the anemometer tower |
表2 不同风向风速与主要气象因子日变化的相关性Tab. 2 Correlation of daily variations between wind speed and major meteorological factors in different wind directions |
| 气象因子 | NW风向 | SW风向 | SE风向 | NE风向 |
|---|---|---|---|---|
| 气压 | 0.86 | 0.96 | 0.91 | 0.90 |
| 气温 | 0.89 | 0.97 | 0.91 | 0.94 |
| 湿度 | -0.95 | -0.96 | -0.89 | -0.88 |
表3 SW、NW风向尾流模型风速与实测风速误差百分比和对应气象要素值Tab. 3 Error percentages between wake model and measured wind speeds and corresponding meteorological factor values for the SW and NW wind directions |
| 风速/m·s-1 | SW风向 | NW风向 | |||||||
|---|---|---|---|---|---|---|---|---|---|
| 误差/% | 气压/kPa | 气温/℃ | 湿度/% | 误差/% | 气压/kPa | 气温/℃ | 湿度/% | ||
| 4 | 5.27 | 99.41 | 2.81 | 44.88 | 6.07 | 99.64 | 10.34 | 31.94 | |
| 5 | 5.43 | 99.35 | 1.33 | 45.12 | 2.68 | 99.58 | 8.55 | 34.36 | |
| 6 | 10.06 | 99.28 | -1.54 | 45.65 | 1.58 | 99.52 | 6.50 | 39.90 | |
| 7 | 8.52 | 99.30 | -0.37 | 43.95 | 1.72 | 99.52 | 6.46 | 38.85 | |
| 8 | 8.49 | 99.33 | 0.53 | 44.49 | 1.69 | 99.55 | 7.54 | 36.00 | |
| 9 | 10.22 | 99.34 | 1.38 | 44.00 | 1.07 | 99.56 | 7.74 | 34.46 | |
| 10 | 9.76 | 99.39 | 3.17 | 42.54 | 0.46 | 99.56 | 8.32 | 34.21 | |
| 11 | 10.50 | 99.35 | 2.08 | 41.59 | 1.90 | 99.45 | 4.47 | 36.72 | |
| 12 | 11.25 | 99.36 | 2.37 | 42.26 | 0.96 | 99.46 | 5.46 | 34.54 | |
| 13 | 11.18 | 99.43 | 4.92 | 38.08 | 1.57 | 99.49 | 6.35 | 32.60 | |
| 14 | 10.39 | 99.40 | 4.01 | 37.16 | 1.79 | 99.54 | 8.17 | 30.45 | |
| 15 | 9.62 | 99.37 | 3.13 | 38.09 | 0.96 | 99.39 | 2.68 | 32.57 | |
| 16 | 10.76 | 99.40 | 4.30 | 36.98 | 1.19 | 99.38 | 2.79 | 32.26 | |
表4 SE、NE风向尾流模型风速与实测风速误差百分比和对应气象要素值Tab. 4 Error percentages between wake model and measured wind speeds and corresponding meteorological factor values for SE and NE wind directions |
| 风速/m·s-1 | SE风向 | NE风向 | |||||||
|---|---|---|---|---|---|---|---|---|---|
| 误差/% | 气压/kPa | 气温/℃ | 湿度/% | 误差/% | 气压/kPa | 气温/℃ | 湿度/% | ||
| 4 | 1.36 | 99.52 | 7.39 | 43.87 | 2.18 | 99.54 | 7.20 | 39.98 | |
| 5 | 6.77 | 99.55 | 8.63 | 44.09 | 0.89 | 99.54 | 7.47 | 42.00 | |
| 6 | 5.23 | 99.61 | 10.28 | 43.07 | 2.06 | 99.51 | 6.59 | 41.93 | |
| 7 | 4.88 | 99.64 | 12.17 | 41.67 | 0.45 | 99.55 | 8.32 | 42.54 | |
| 8 | 2.35 | 99.71 | 14.48 | 41.32 | 0.37 | 98.43 | 9.49 | 64.79 | |
| 9 | 1.73 | 99.70 | 14.62 | 37.58 | 2.11 | 99.48 | 5.70 | 42.95 | |
| 10 | 1.63 | 99.66 | 13.49 | 36.29 | 0.93 | 99.60 | 9.44 | 37.76 | |
| 11 | 4.64 | 99.64 | 12.66 | 42.96 | 2.14 | 99.64 | 10.99 | 41.75 | |
| 12 | 5.94 | 99.68 | 13.42 | 38.74 | 1.99 | 99.62 | 10.24 | 57.62 | |
| [1] |
张立栋, 石强, 姜铁骝, 等. 不同强度湍流风对风力机气动载荷的影响[J]. 分布式能源, 2023, 8(5): 61-68.
[
|
| [2] |
樊振兴, 张云飞, 程更建, 等. 测风激光雷达在智慧风电场的应用进展[J]. 物联网技术, 2024, 14(5): 151-155.
[
|
| [3] |
沈铖波. 基于半经验尾流模型的风机布置优化研究[D]. 杭州: 浙江大学, 2022.
[
|
| [4] |
张晓东, 张梦雨, 白鹤. 基于高斯分布的风电场尾流效应计算模型[J]. 华北电力大学学报, 2017, 44(5): 99-103.
[
|
| [5] |
田琳琳. 风力机尾流数值模拟及风电场机组布局优化研究[D]. 南京: 南京航空航天大学, 2014.
[
|
| [6] |
刘晴晴. 基于尾流效应的风电场三维微观选址研究[D]. 天津: 河北工业大学, 2018.
[
|
| [7] |
李胜, 葛文澎, 吴嘉诚, 等. 风力机组尾流模型适用性评价[J]. 南方能源建设, 2024, 11(1): 42-53.
[
|
| [8] |
|
| [9] |
|
| [10] |
刘南南, 关中杰. Gaussian与GA风电场尾流软测量建模与优化[J]. 中国测试, 2023, 49(6): 107-113.
[
|
| [11] |
袁飞, 夏德喜, 汪正军. 基于SCADA数据的风电机组群尾流效应计算与验证研究[J]. 智慧电力, 2023, 51(7): 23-30.
[
|
| [12] |
樊小朝, 陈景, 史瑞静, 等. 考虑尾流效应与载荷损耗的风电场优化控制[J]. 水力发电, 2021, 47(10): 89-94, 99.
[
|
| [13] |
|
| [14] |
张镇, 张晓东. 基于半经验公式的风力机尾流模型研究[J]. 现代电力, 2012, 29(2): 64-67.
[
|
| [15] |
李啸吟. 风电机组尾流影响和风电场功率提升研究[D]. 沈阳: 沈阳工业大学, 2022.
[
|
| [16] |
朱洁, 匡婵, 赵宜婵. 基于Jensen和Gaussian尾流模型的风电场布局优化的比较[J]. 河南科学, 2021, 39(3): 345-352.
[
|
| [17] |
苏中莹, 袁金库, 李诗峰. 风电场风速分布对机组发电量影响的研究[J]. 数码设计, 2017, 6(7): 102-104.
[
|
| [18] |
杨富程, 韩二红, 王彬滨, 等. 风电场风速概率Weibull分布的参数估计研究[J]. 江西科学, 2019, 37(2): 264-269, 299.
[
|
| [19] |
黄小佳. 基于机器学习的风能资源评估与风速预测的模型构建及研究[D]. 大连: 东北财经大学, 2021.
[
|
| [20] |
黄武枫. 风电场风速概率分布及其拟合模型研究[D]. 南宁: 广西大学, 2021.
[
|
| [21] |
牛怡莹, 李春兰, 王军, 等. 内蒙古ERA5再分析降水数据性能评估与极端降水时空特征分析[J]. 干旱区地理, 2023, 46(9): 1418-1431.
[
|
| [22] |
肖东升, 王宁, 刘志成. 干旱地区“代表性人口格网数据集”精度研究——以甘宁青地区为例[J]. 干旱区地理, 2023, 46(3): 505-514.
[
|
| [23] |
徐栋, 白雪峰, 孙静. 乌兰察布风电基地风能资源特征分析[J]. 西北水电, 2022(1): 87-89.
[
|
| [24] |
石岚, 徐丽娜, 郝玉珠. 基于风速高相关分区的风电场风速预报订正[J]. 应用气象学报, 2016, 27(4): 506-512.
[
|
| [25] |
章永辉, 楼俊伟, 张鑫, 等. 金华市风能资源分析[J]. 沙漠与绿洲气象, 2023, 17(2): 98-105.
[
|
| [26] |
陈小婷, 李培荣, 冯典, 等. 陕西省风的时空分布及ERA5风资料检验评估[J]. 陕西气象, 2023(3): 23-30.
[
|
| [27] |
王淼, 曾利华. 风速频率分布模型的研究[J]. 水力发电学报, 2011, 30(6): 204-209.
[
|
| [28] |
梁浩. 风电场风机尾流效应的分析与应用[D]. 成都: 电子科技大学, 2017.
[
|
| [29] |
杜博文. 大气稳定度对风力机尾流演化的影响机理研究[D]. 北京: 华北电力大学, 2022.
[
|
| [30] |
高晓清, 陈伯龙, 杨丽薇, 等. 大气湍流稳定度对风力机尾流影响的模拟研究[J]. 太阳能学报, 2020, 41(4): 145-152.
[
|
| [31] |
何仲阳, 宋梦譞, 张兴. 地表温度对风场模拟的影响[J]. 化工学报, 2012, 63(增刊1): 7-11.
[
|
| [32] |
陆艳艳, 袁建平, 张磊, 等. 1979—2019年内蒙古发电风速变化趋势分析[J]. 科技风, 2021(20): 193-196.
[
|
/
| 〈 |
|
〉 |