



2015—2023年“乌-昌-石”城市群PM2.5与PM10时空变化及潜在源分析
|
闫劲烨(1998-),男,硕士研究生,主要从事干旱区资源与环境监测及大气污染控制研究. E-mail: yanjinye1126@163.com |
收稿日期: 2024-04-21
修回日期: 2024-05-28
网络出版日期: 2026-03-11
基金资助
国家自然科学基金项目(21966029)
国家自然科学基金项目(21567028)
Spatiotemporal variations and potential sources of PM2.5 and PM10 in the “Urumqi-Changji-Shihezi” urban agglomeration from 2015 to 2023
Received date: 2024-04-21
Revised date: 2024-05-28
Online published: 2026-03-11
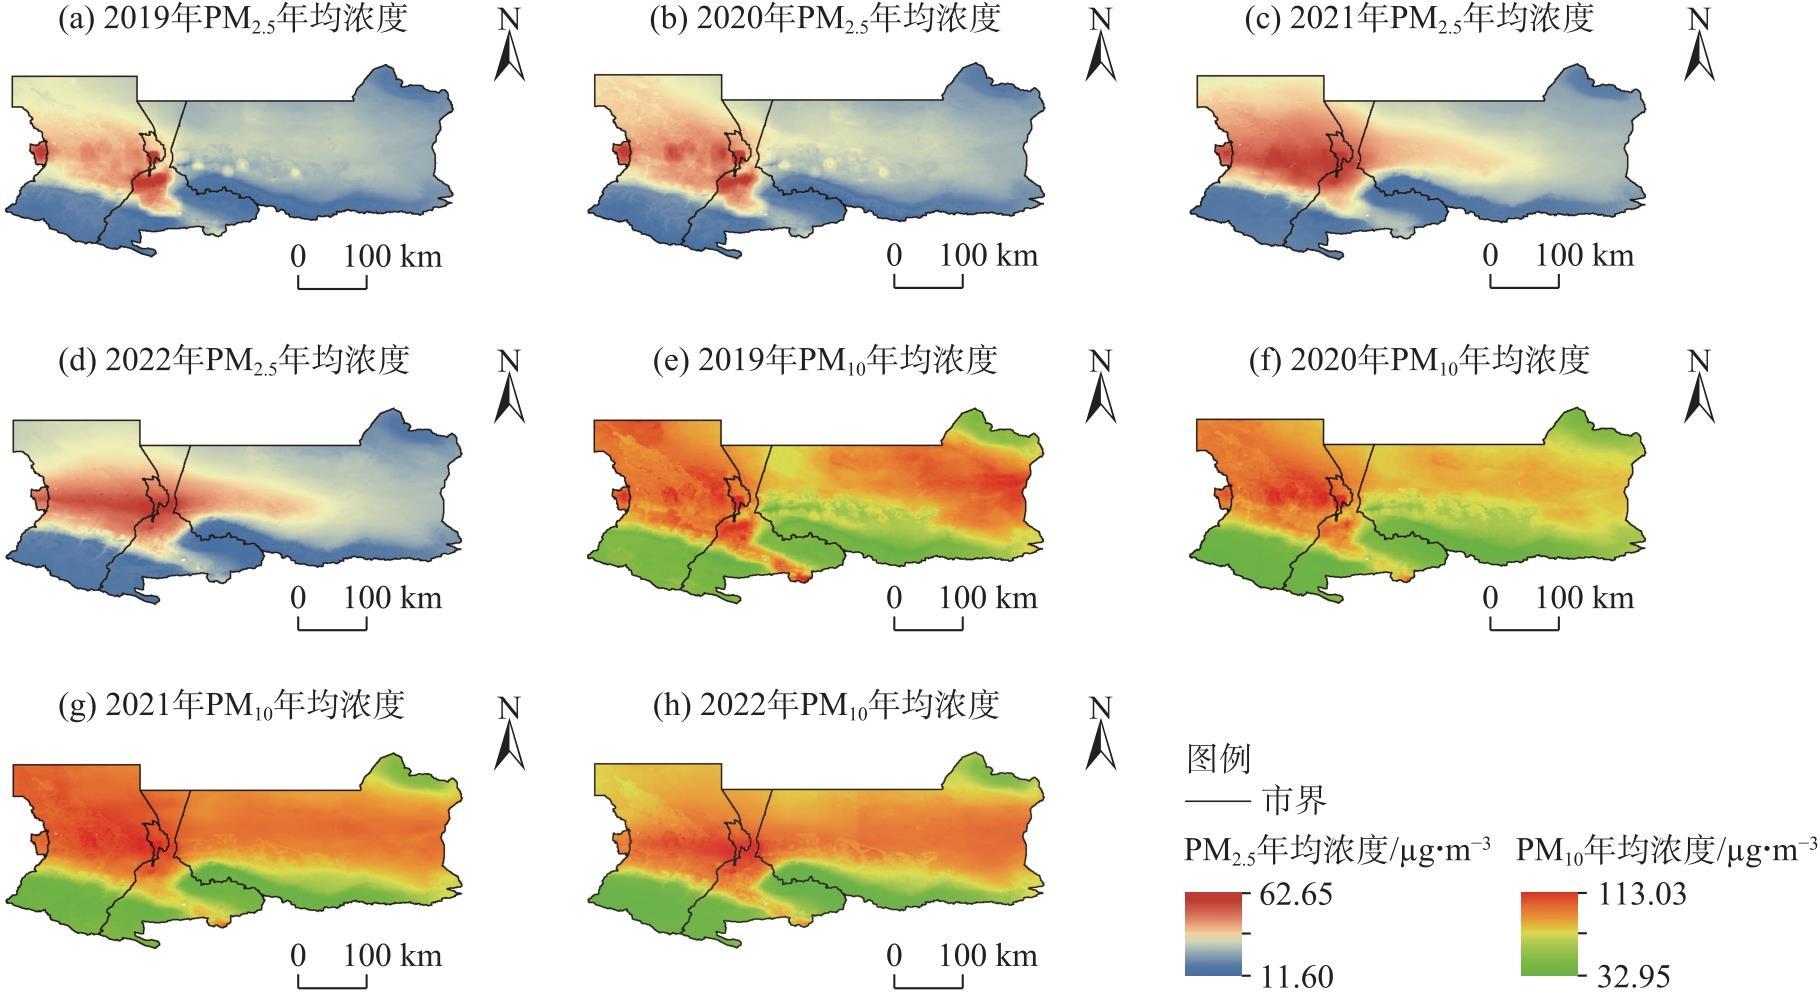
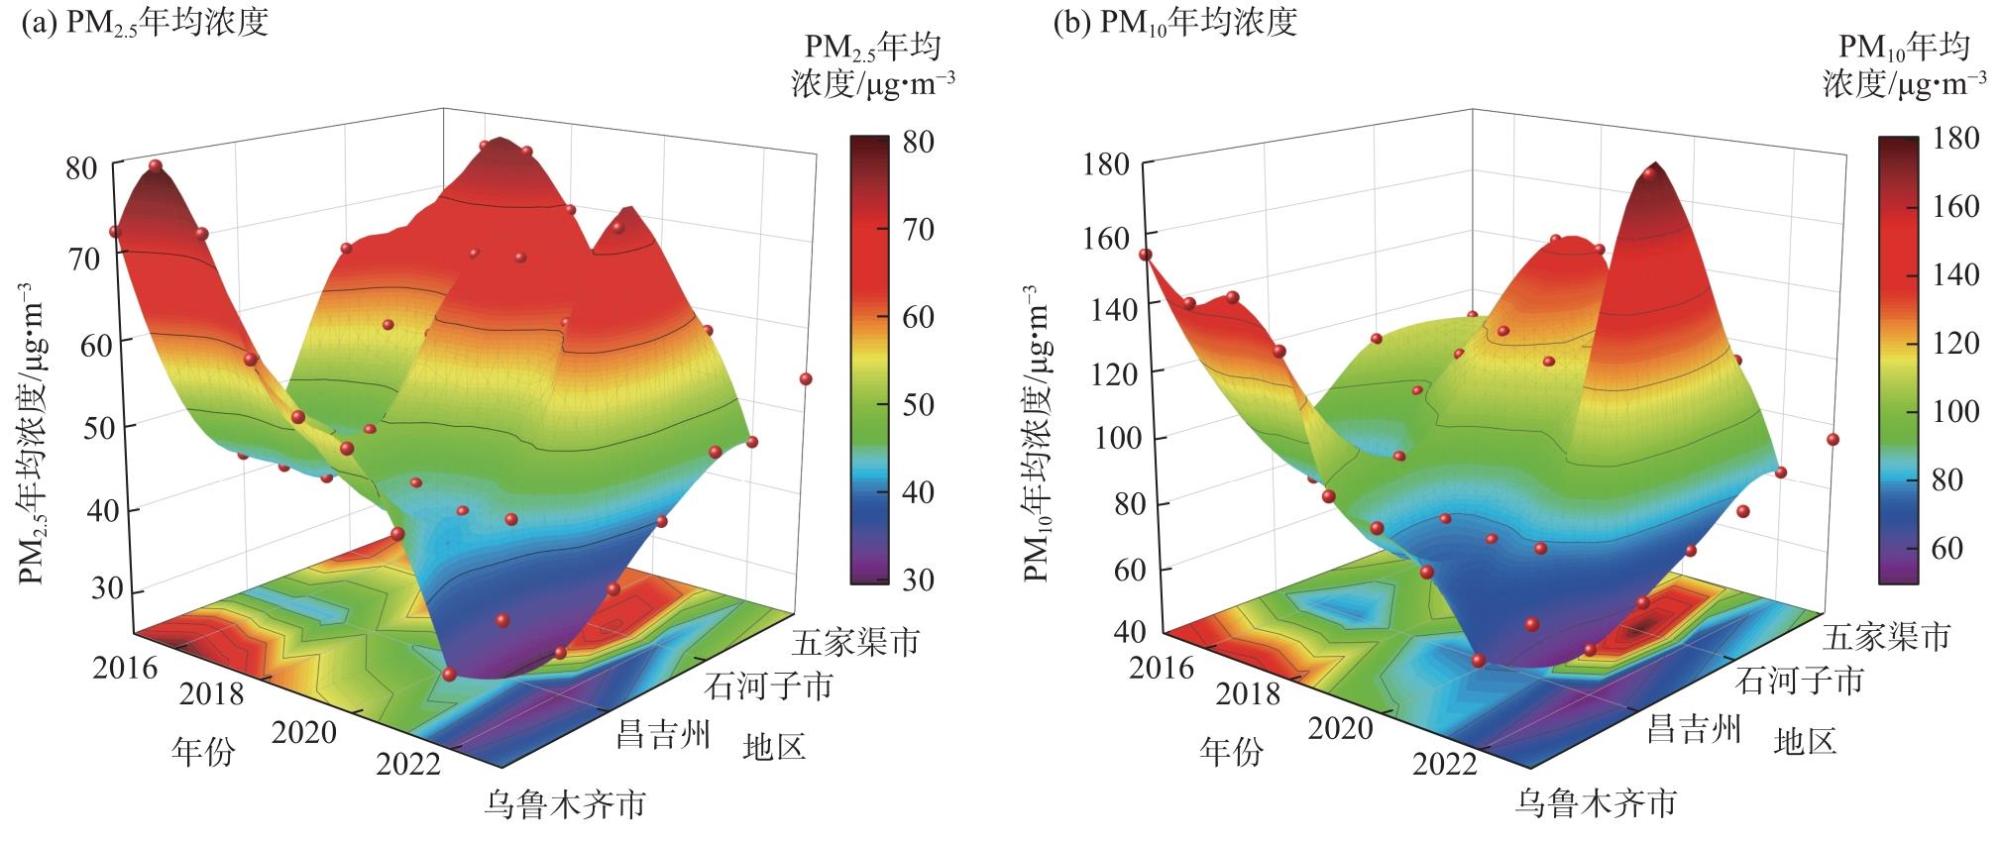
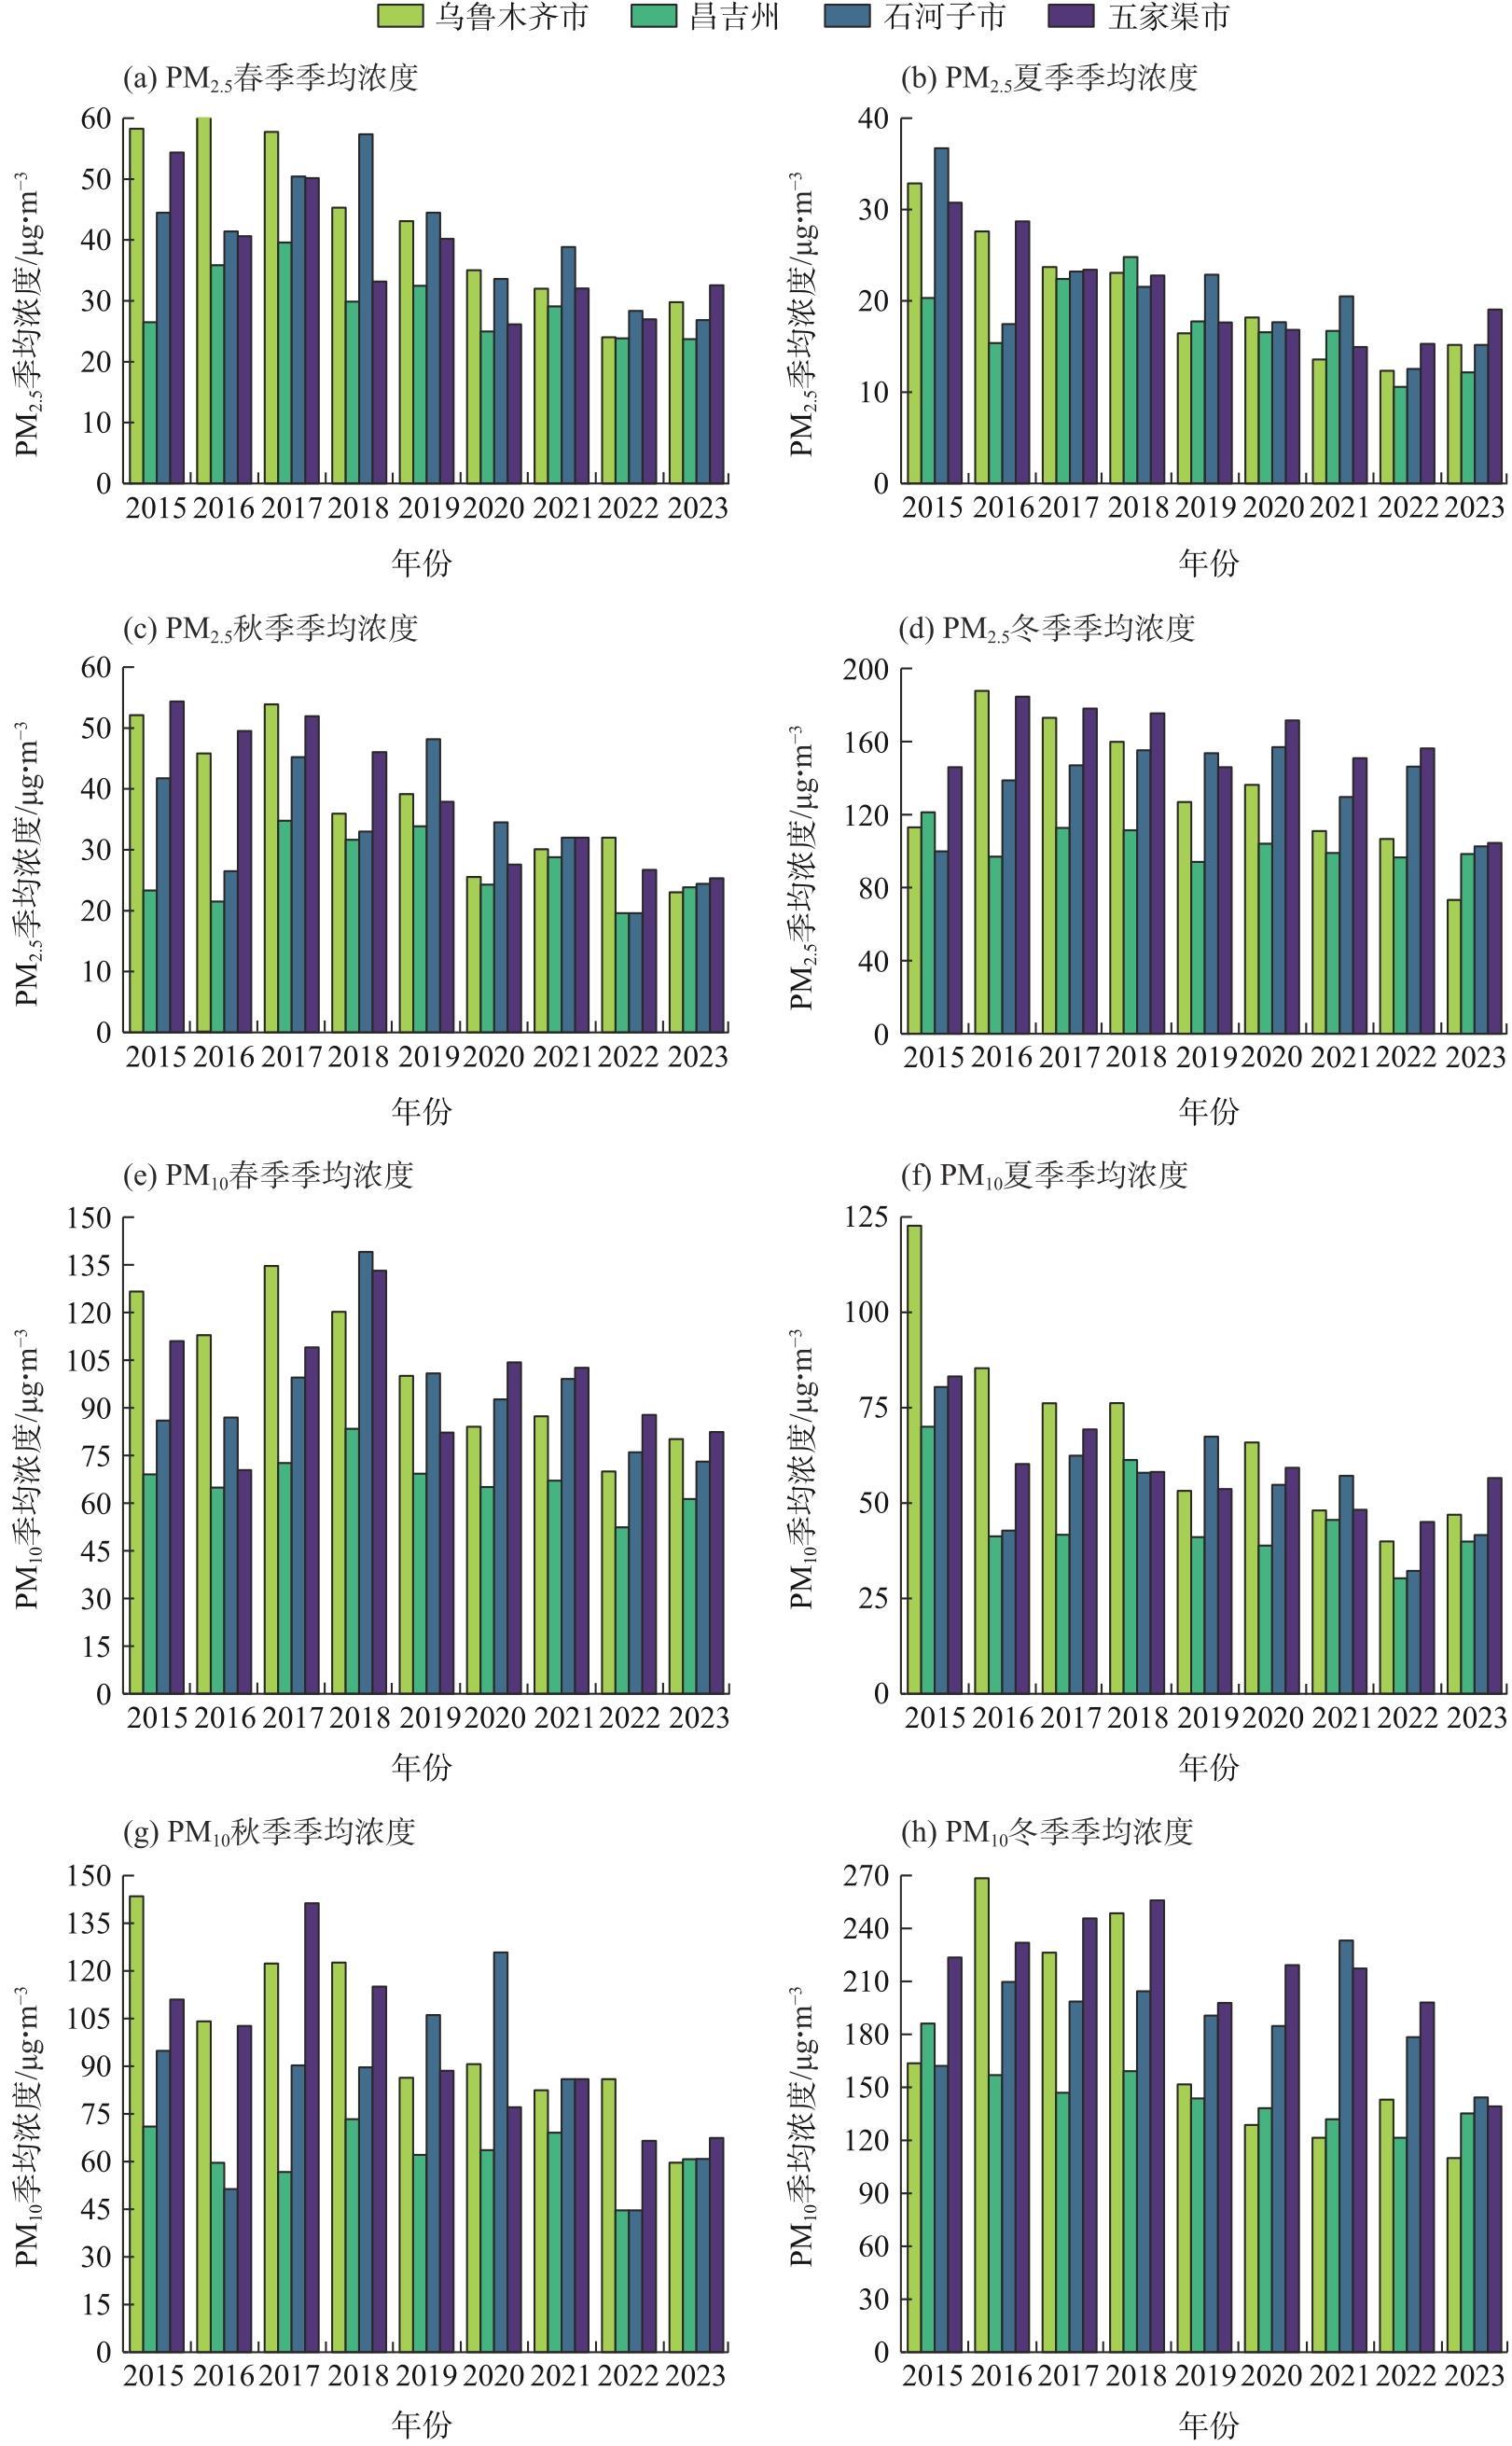
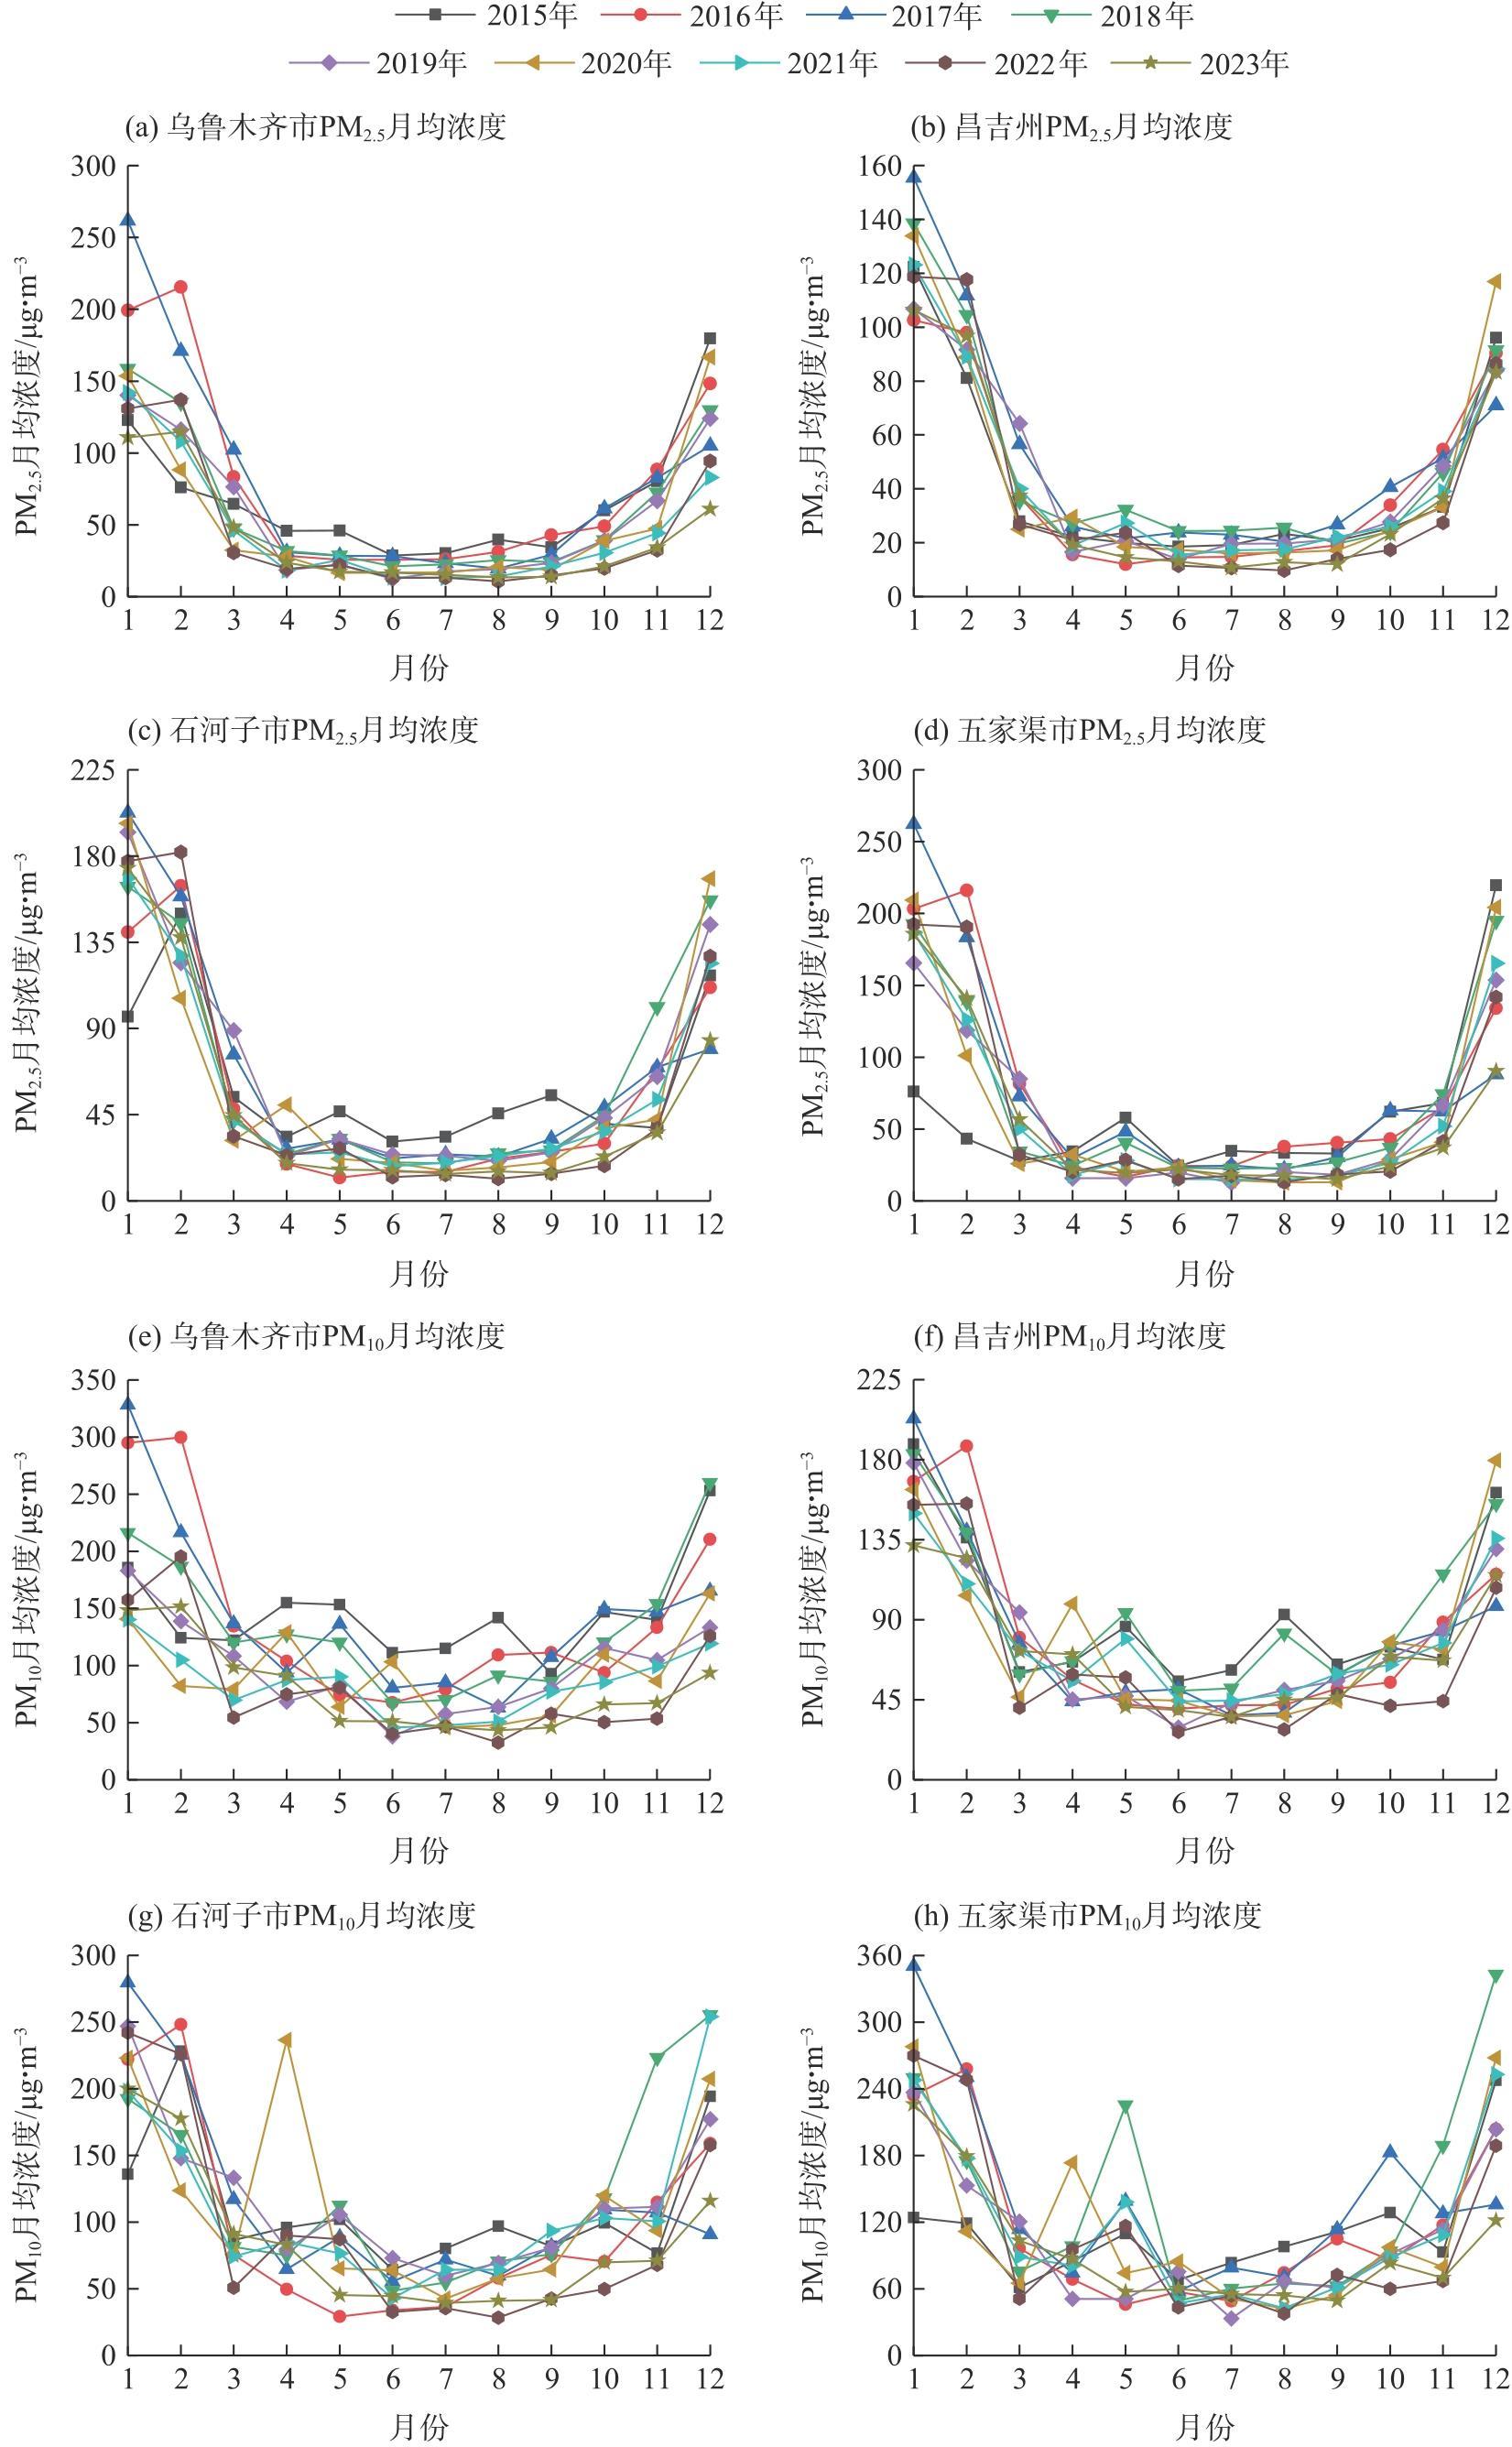
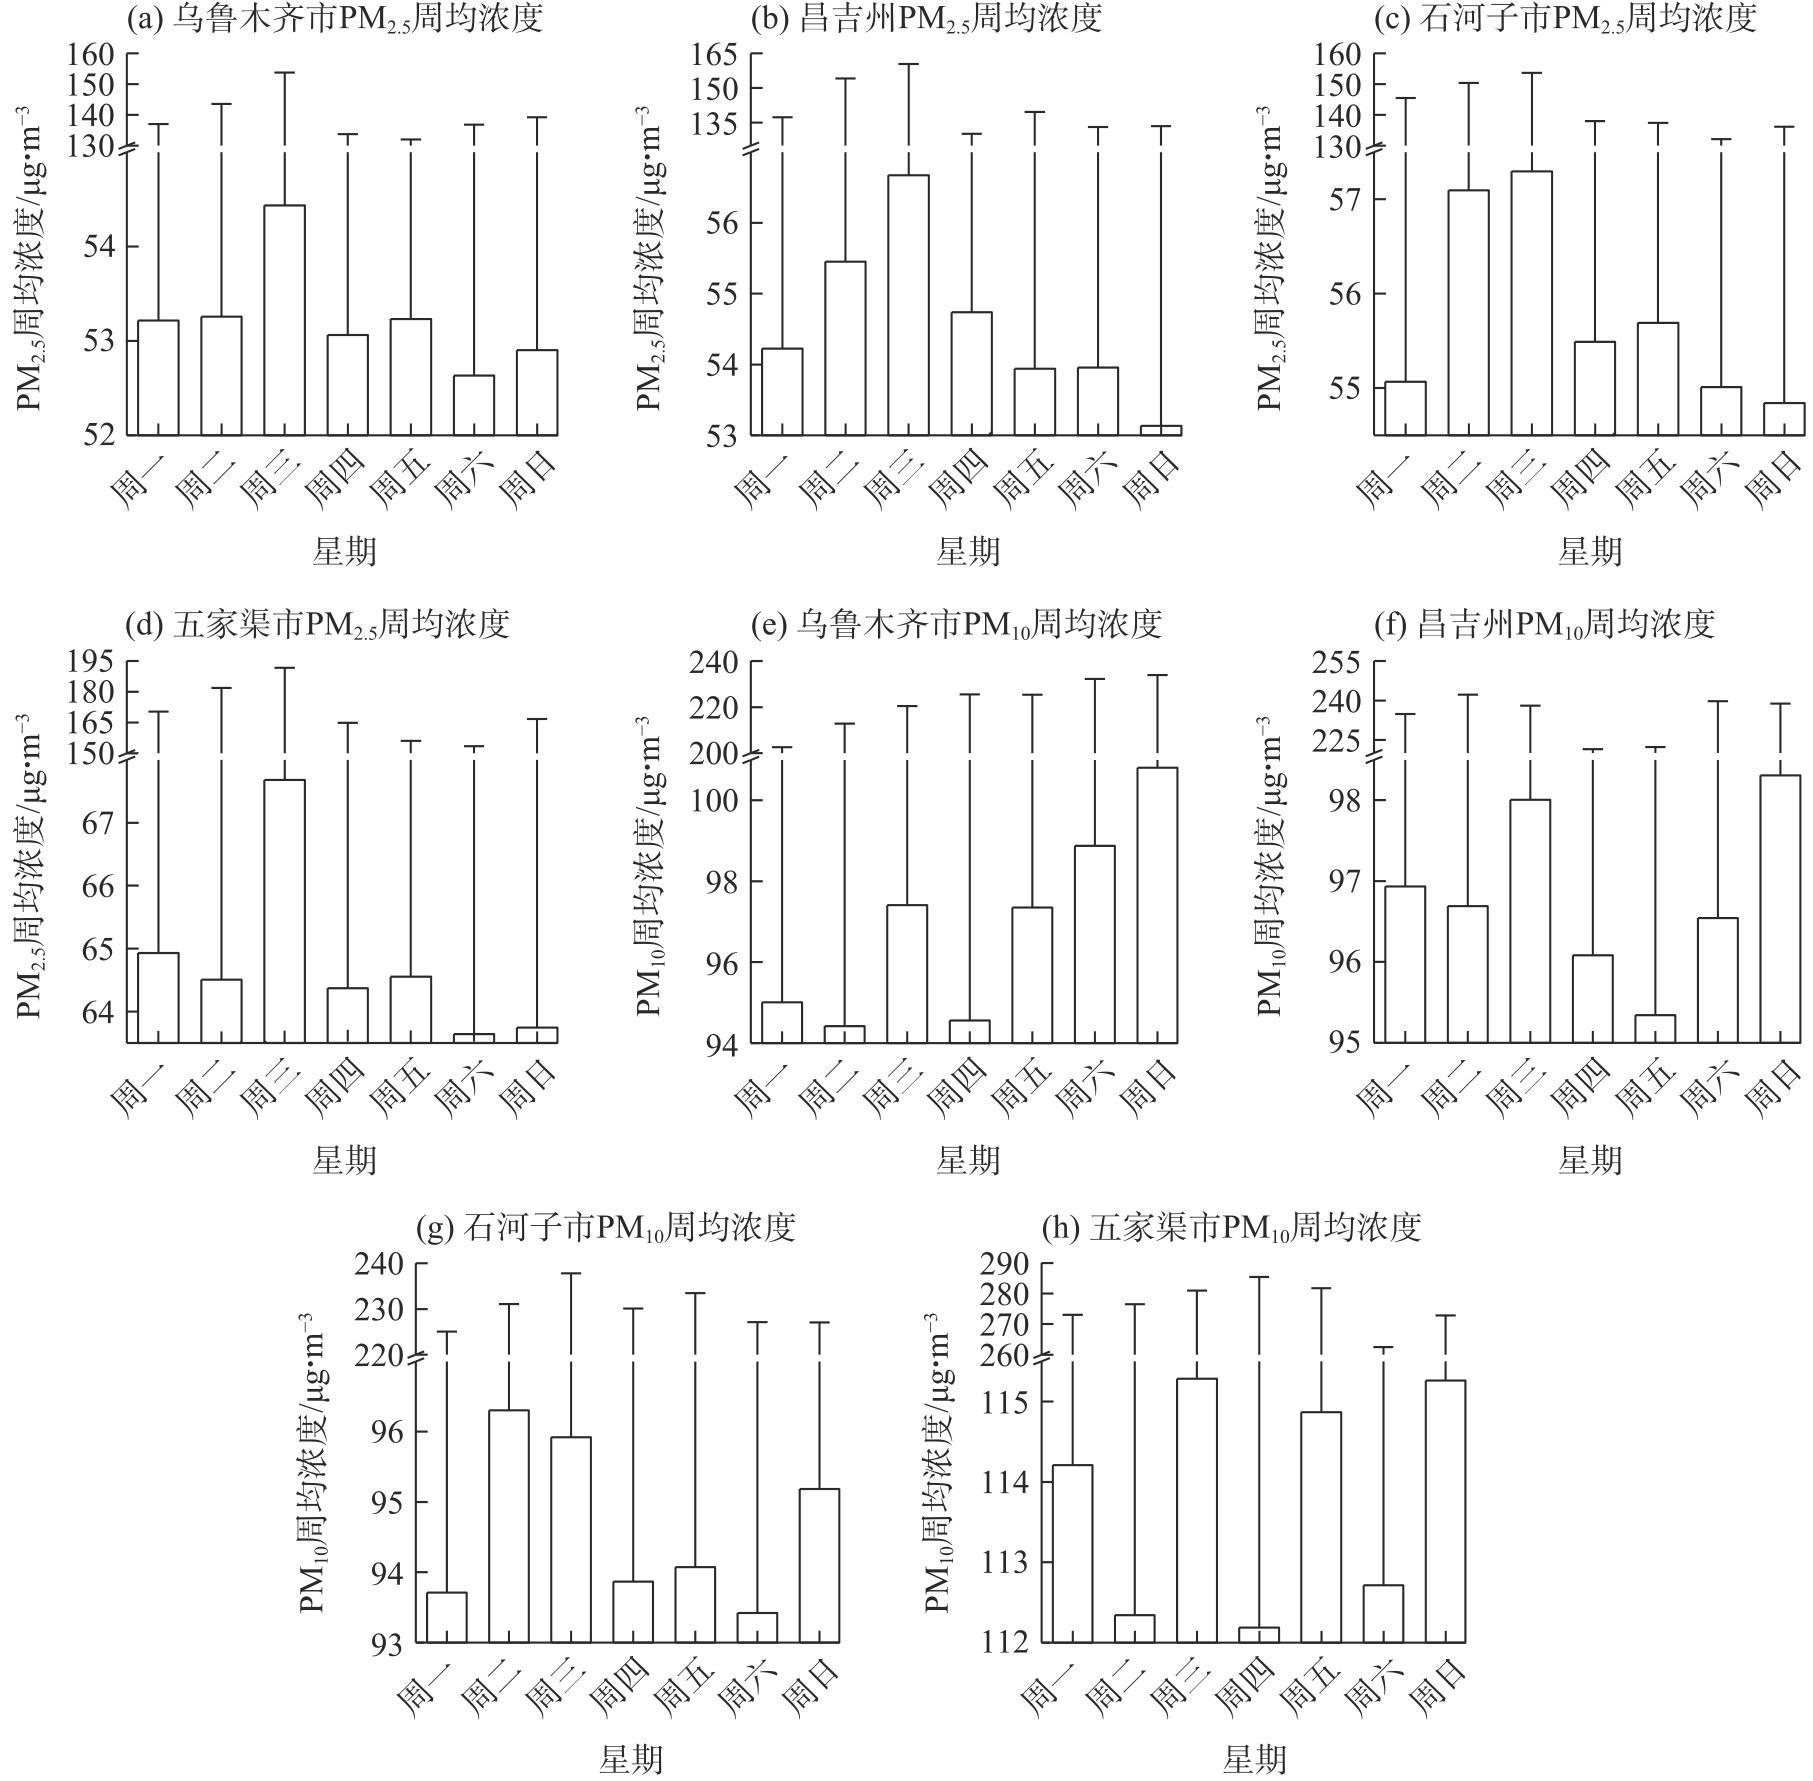
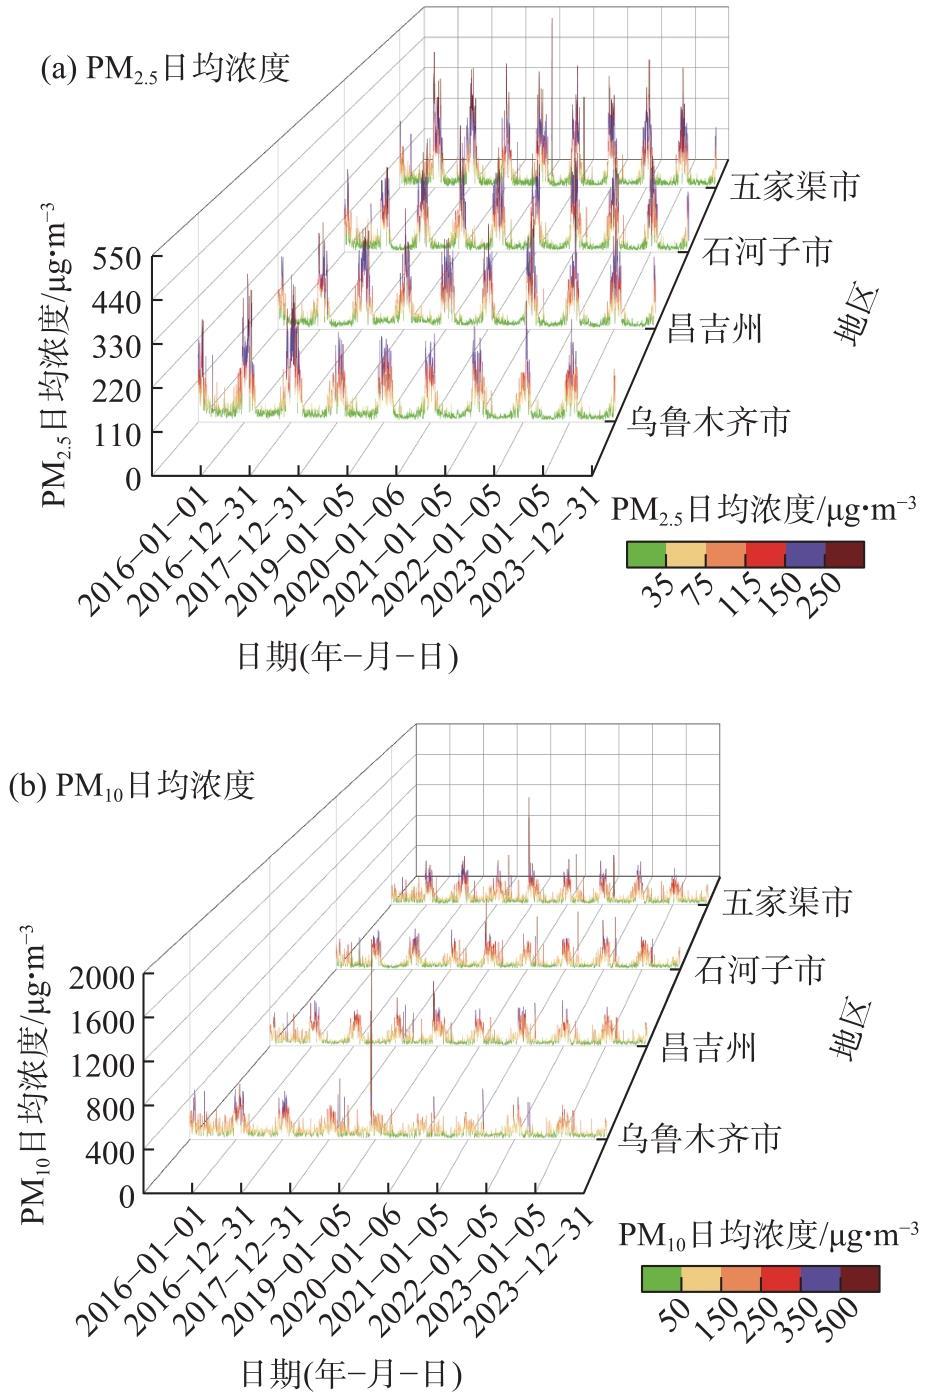
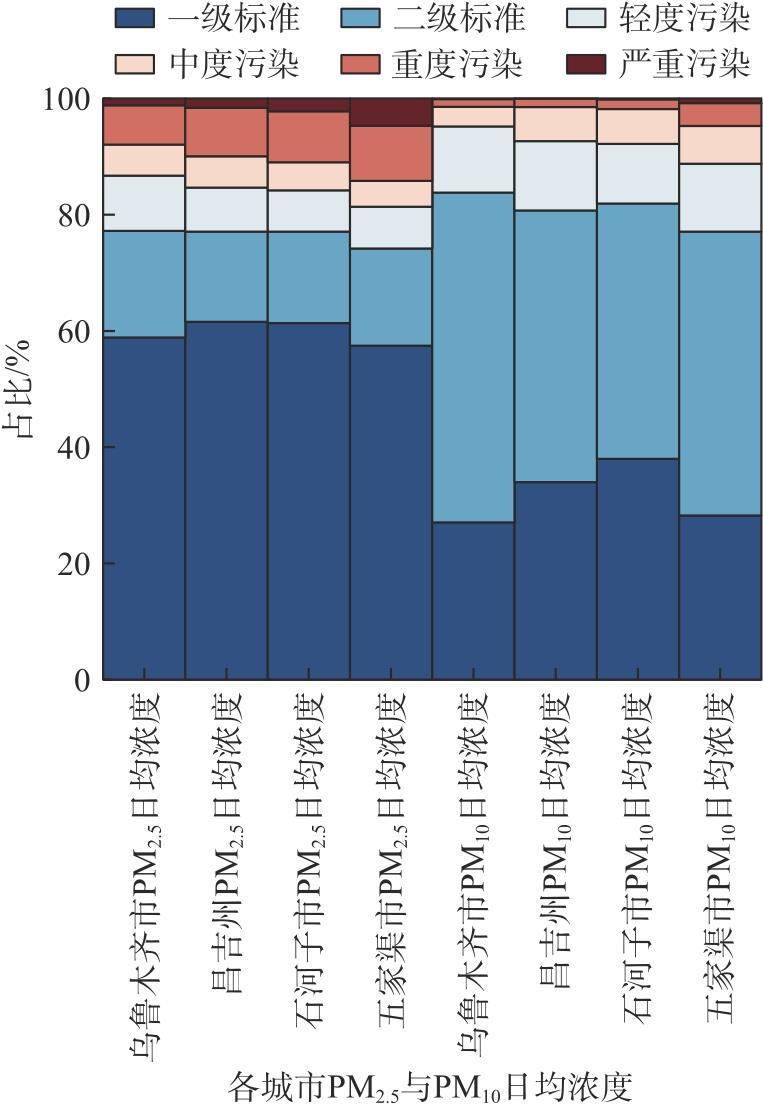
使用HYSPLIT模型等方法解析2015—2023年“乌鲁木齐-昌吉回族自治州-石河子(乌-昌-石)”城市群PM2.5与PM10的时空变化及来源。结果表明:(1) 在空间尺度上,2019—2022年“乌-昌-石”城市群PM2.5与PM10浓度在城市中心和西北部较高,PM10浓度与海拔成反比。(2) 从2015—2023年“乌-昌-石”城市群的时间尺度来看,在年际尺度上,乌鲁木齐市和昌吉回族自治州的PM2.5与PM10年均浓度呈现整体下降趋势,石河子市和五家渠市的PM2.5与PM10年均浓度直到2023年才显著下降。在季节尺度上,PM2.5与PM10季均浓度总体下降,相对下降幅度春季最大,夏秋次之,冬季最小。在月尺度上,PM2.5与PM10月均浓度呈现“U”型分布,其中1月降幅显著。在周尺度上,工作日大量堵车等原因使4个城市的PM2.5周均浓度呈现“负周末效应”,而PM10周均浓度只在乌鲁木齐市呈现“正周末效应”。在日尺度上,冬季PM2.5与PM10日均浓度远高于其他季节,PM2.5日均浓度整体下降,高浓度天数减少,PM10日均浓度受沙尘影响波动较大。(3) 2019—2021年“乌-昌-石”城市群的污染物来源表现为:2019年以本地源为主,污染源广泛且浓度高;2020年由于疫情防控措施的实施,本地排放减少,污染源向中亚地区转移;2021年污染源再次扩大并转向国内。研究可为“乌-昌-石”城市群的大气污染治理和环境政策优化提供数据支持,有助于推动该地区的生态环境保护和经济的高质量增长。
关键词: PM2.5与PM10; “乌-昌-石”城市群; 时空变化; 潜在源解析
闫劲烨 , 马正权 , 孙萱萱 , 阿力木·阿巴斯 , 帕丽达·牙合甫 . 2015—2023年“乌-昌-石”城市群PM2.5与PM10时空变化及潜在源分析[J]. 干旱区地理, 2025 , 48(3) : 405 -420 . DOI: 10.12118/j.issn.1000-6060.2024.249
Using the HYSPLIT model and other methods, we analyzed the spatiotemporal variations and sources of PM2.5 and PM10 in the Urumqi, Changji Hui Autonomous Prefecture, and Shihezi urban agglomeration from 2015 to 2023. The results indicate the following: (1) Spatial scale: From 2019 to 2022, PM2.5 and PM10 concentrations were higher in the central and northwestern parts of the urban agglomeration. PM10 concentrations showed an inverse relationship with elevation. (2) Temporal scale: From 2015 to 2023, on an interannual scale, the annual average concentrations of PM2.5 and PM10 in Urumqi City and Changji Hui Autonomous Prefecture showed an overall downward trend. In contrast, Shihezi City and Wujiaqu City experienced significant decreases in PM2.5 and PM10 concentrations only in 2023. On a seasonal scale, the average concentrations of PM2.5 and PM10 generally declined, with the largest relative reduction in spring, followed by summer and autumn, and the smallest reduction in winter. On a monthly scale, the average concentrations of PM2.5 and PM10 displayed a “U-shaped” distribution, with a significant reduction in January. On a weekly scale, heavy weekday traffic congestion led to a “negative weekend effect” for PM2.5 concentrations across all four cities, while PM10 concentrations exhibited a “positive weekend effect” only in Urumqi City. On a daily scale, PM2.5 and PM10 concentrations in winter were significantly higher than in other seasons. PM2.5 concentrations decreased overall, with fewer high-concentration days, while PM10 concentrations fluctuated more due to dust events. (3) Pollution sources (2019—2021): In 2019, pollution was predominantly from local sources, resulting in widespread and high concentrations. In 2020, pandemic-related restrictions reduced local emissions, shifting pollution sources toward Central Asia. In 2021, pollution sources expanded again, returning to domestic regions. This study provides essential data for air pollution control and environmental policy optimization in the Urumqi, Changji Hui Autonomous Prefecture, and Shihezi urban agglomeration, contributing to regional ecological protection and sustainable economic development.
表1 周末与工作日污染物各城市日均浓度相对偏差Tab. 1 Relative deviation of daily average pollutant concentrations among cities on weekends and weekdays |
| 城市 | PM2.5日均浓度偏差/% | PM10日均浓度偏差/% |
|---|---|---|
| 乌鲁木齐市 | -1.26 | 4.27 |
| 昌吉州 | -2.66 | 0.84 |
| 石河子市 | -2.14 | -0.50 |
| 五家渠市 | -2.32 | 0.18 |
注:昌吉州为昌吉回族自治州的简称。 |
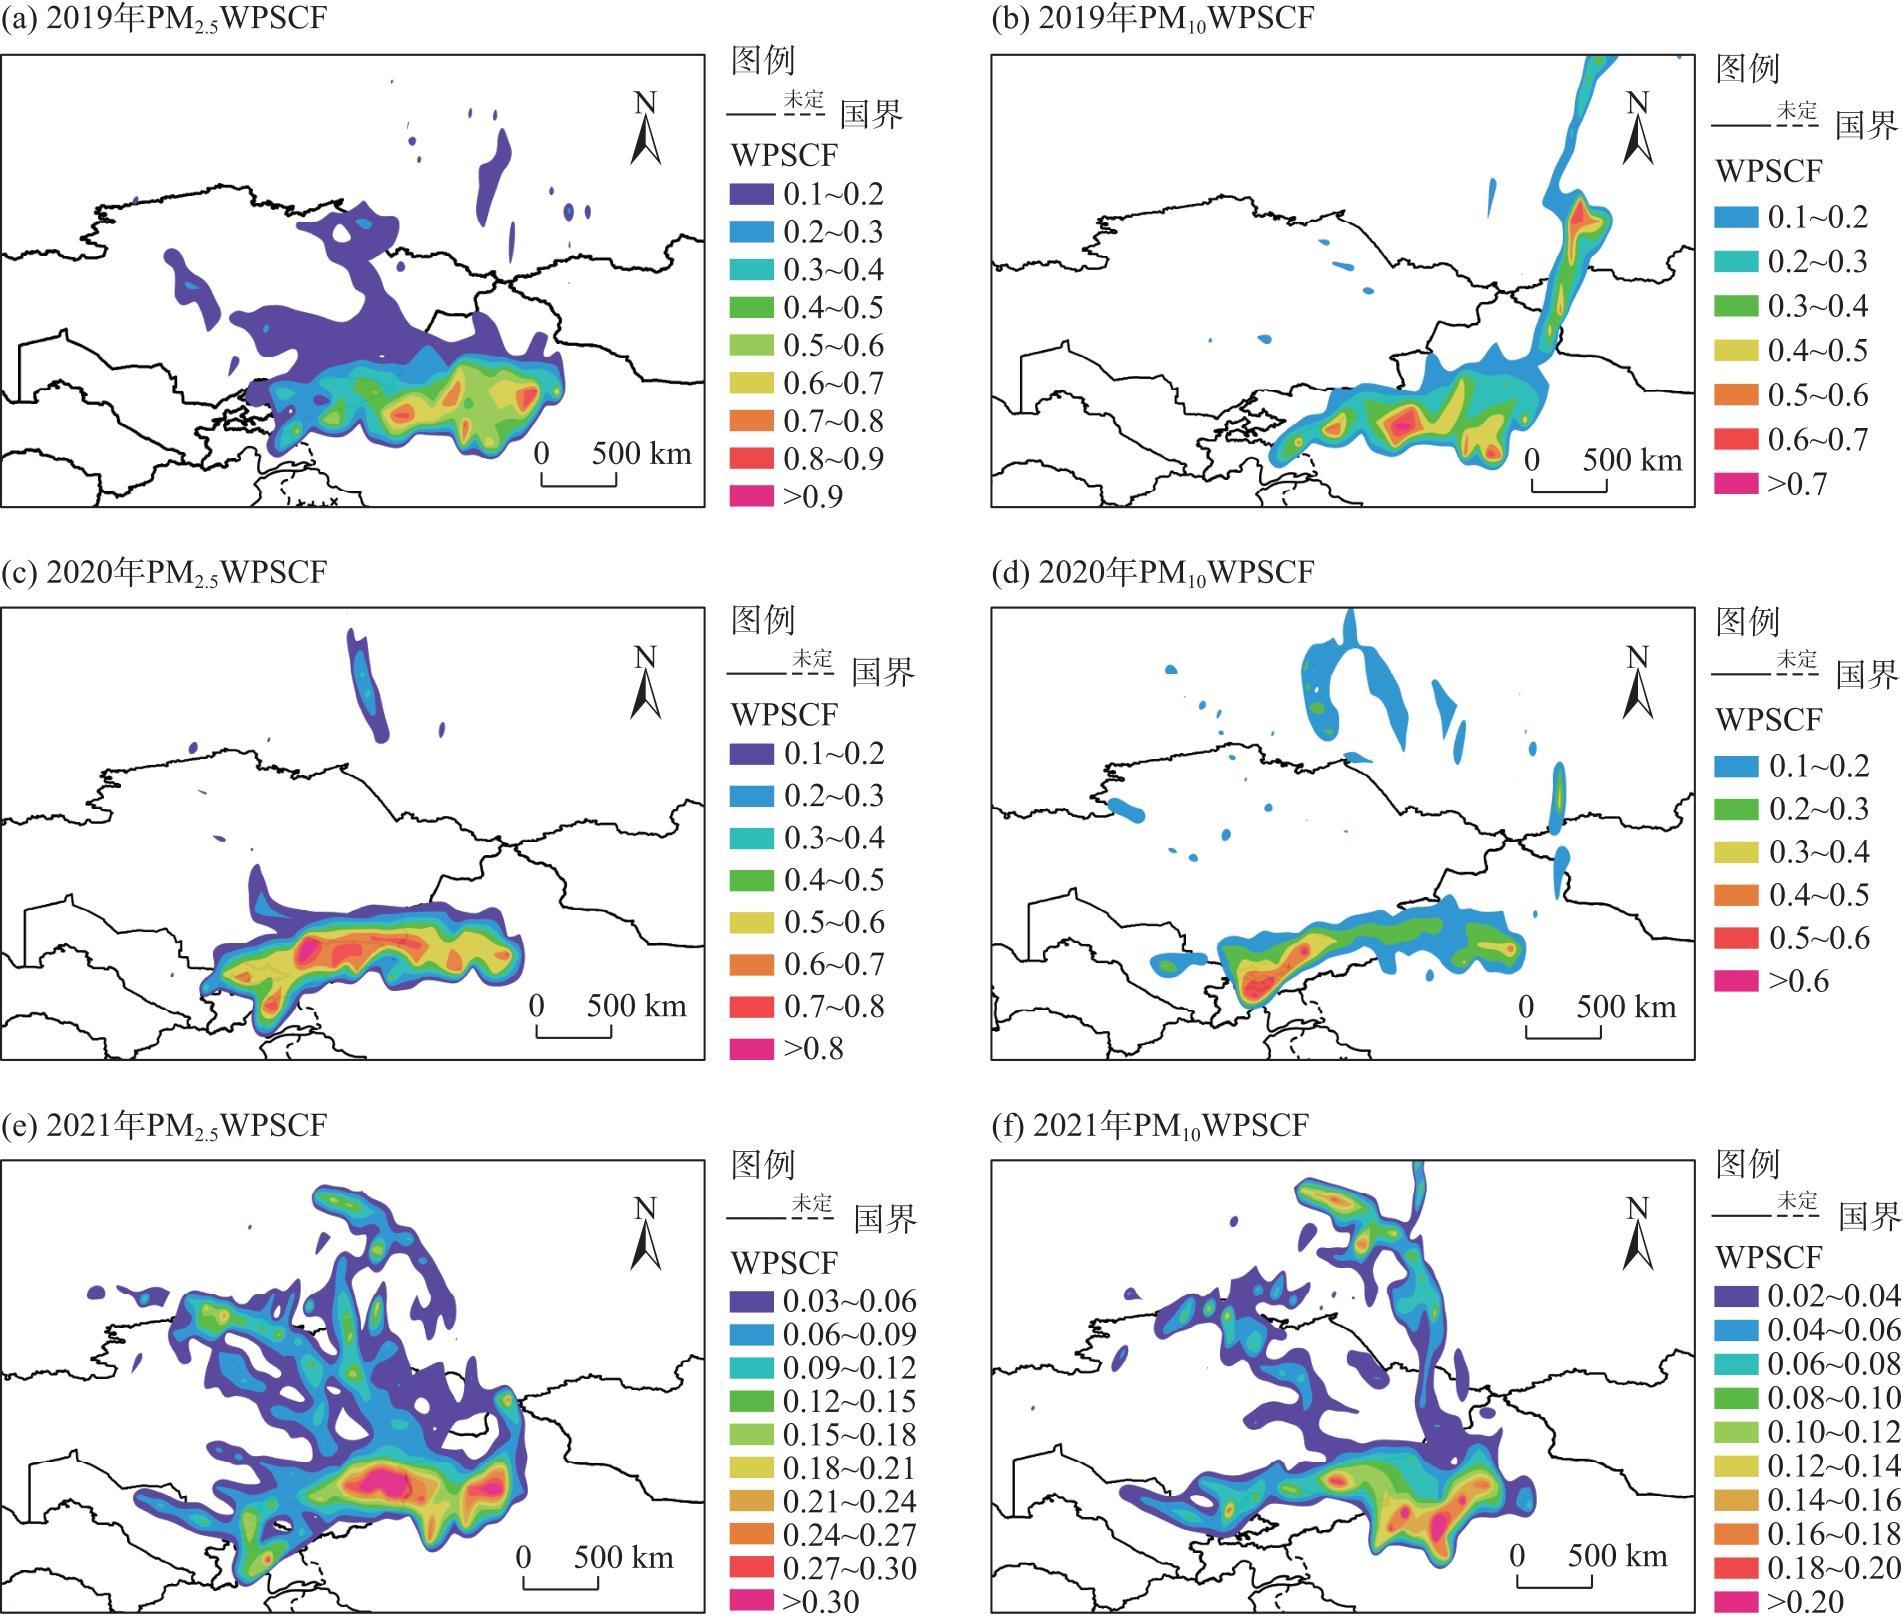
图9 2019—2021年“乌-昌-石”城市群PM2.5与PM10潜在源区贡献分布注:基于自然资源部标准地图服务网站审图号为GS(2016)1666号的标准地图制作,底图边界无修改。WPSCF为经过加权后的潜在源贡献函数值。下同。 Fig. 9 Contribution distributions of potential source areas for PM2.5 and PM10 in the Urumqi, Changji Hui Autonomous Prefecture, and Shihezi urban agglomeration from 2019 to 2021 |
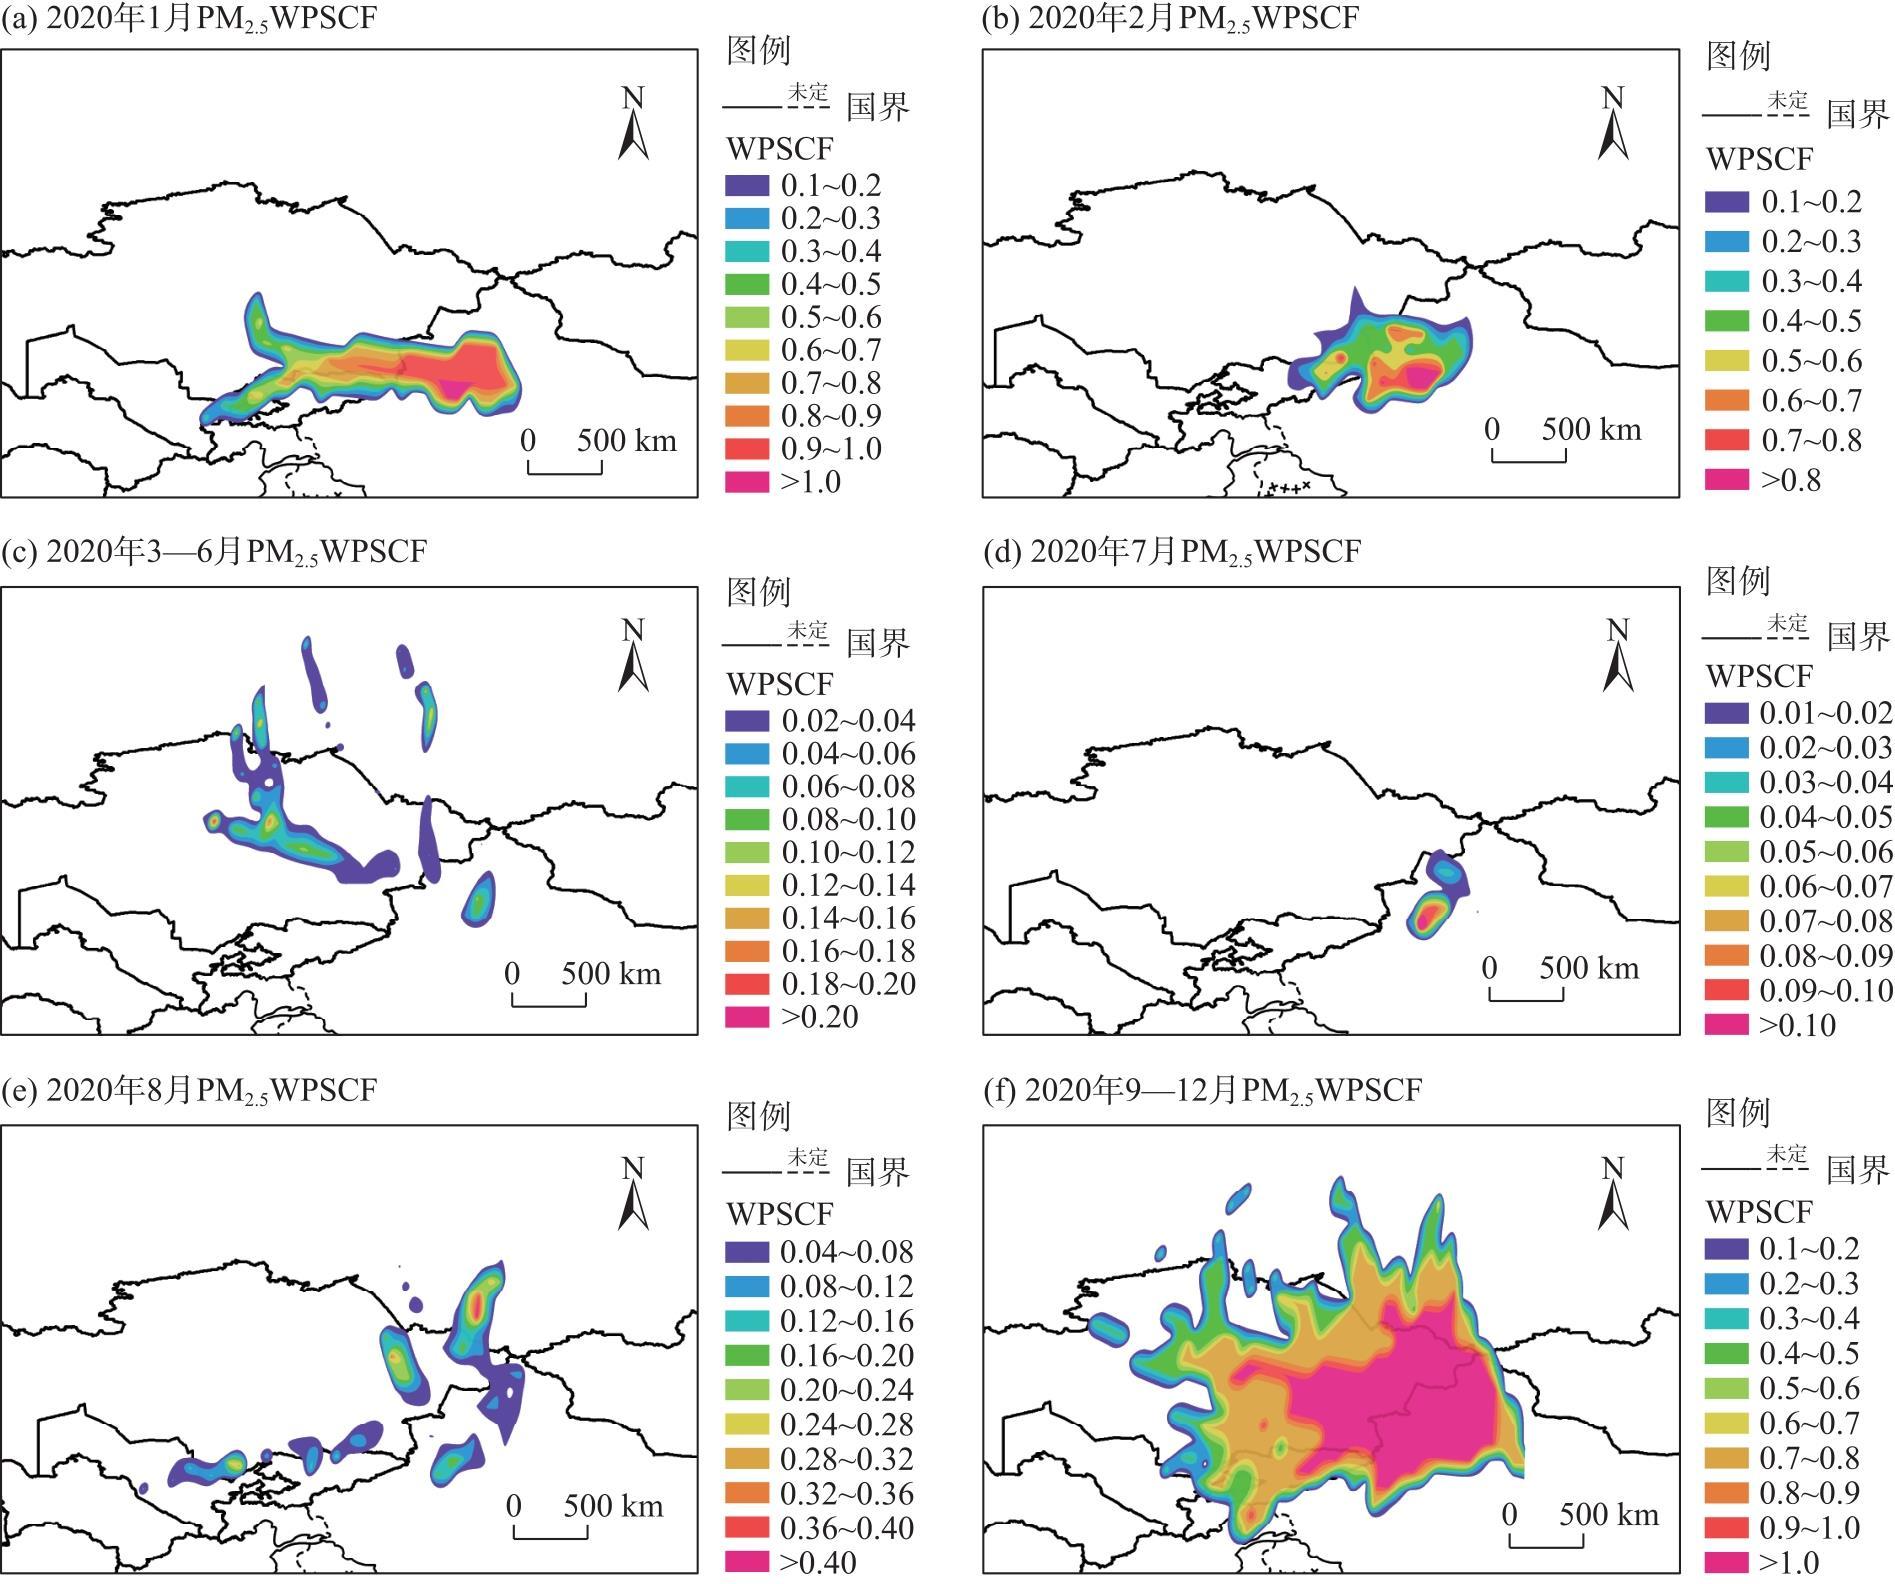
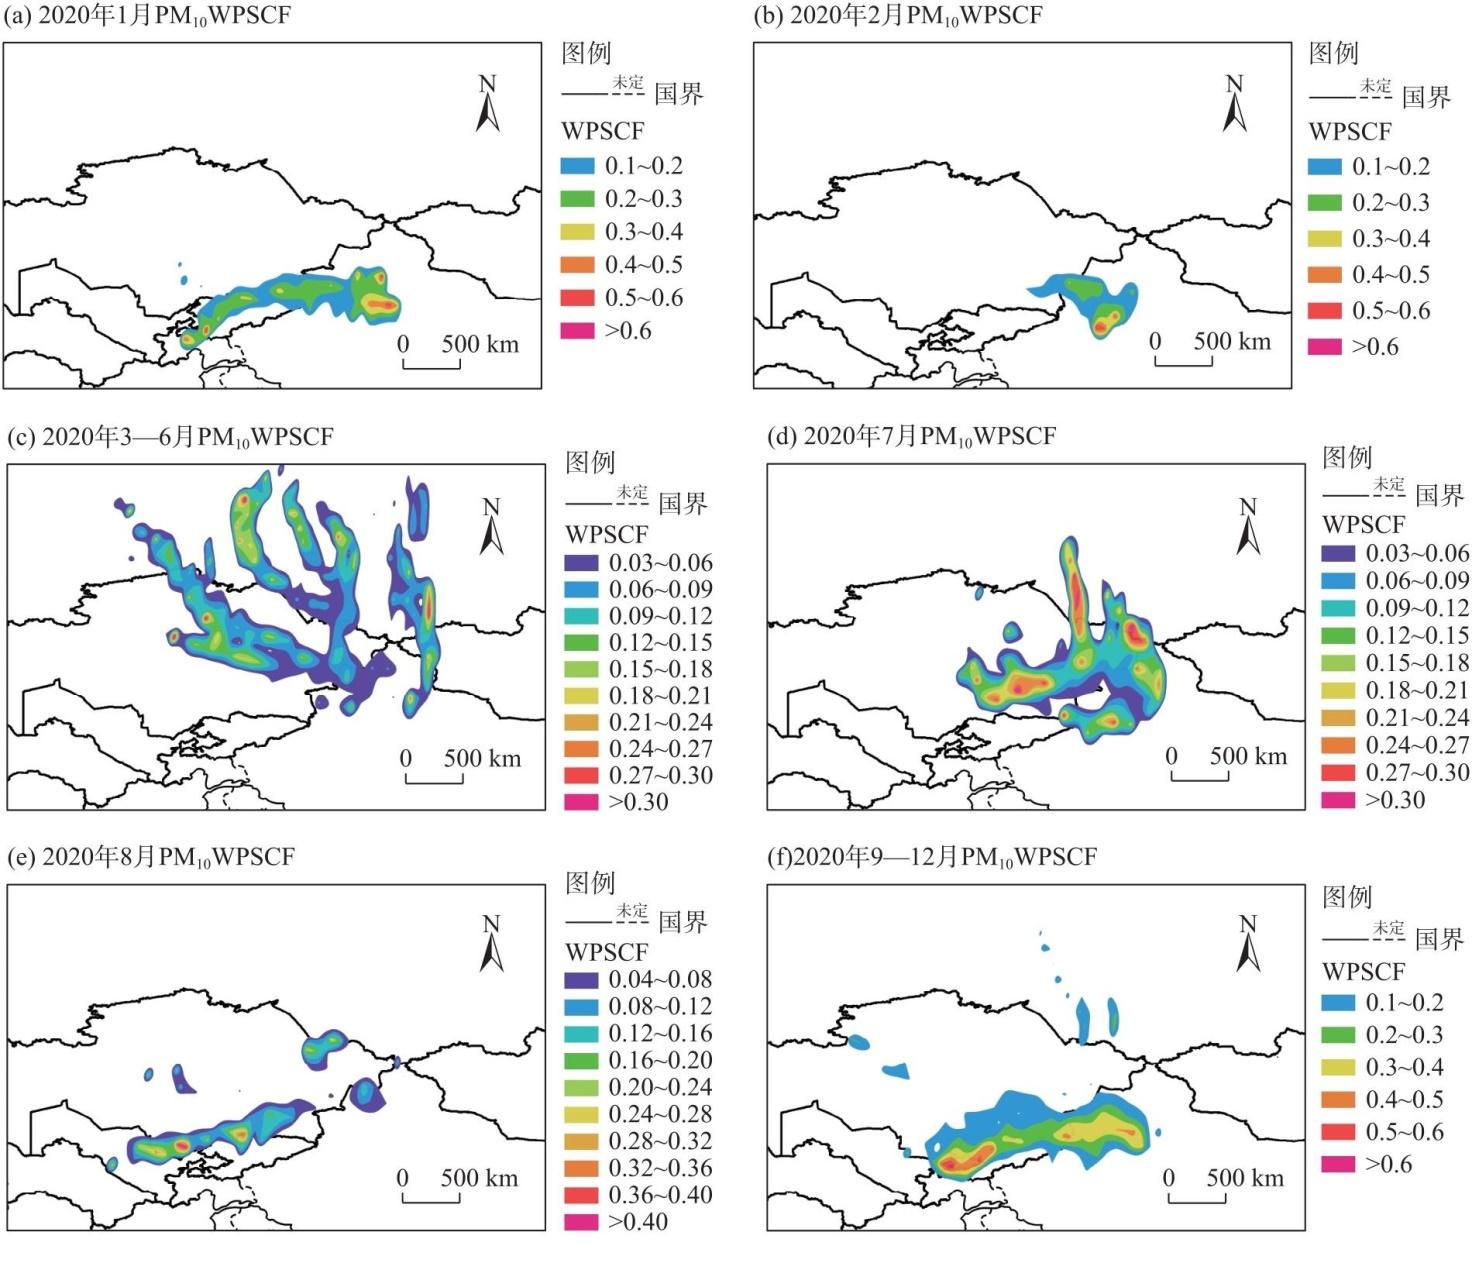
图10 2020年“乌-昌-石”城市群PM2.5潜在源区贡献月分布Fig. 10 Monthly distributions of potential source areas contribution for PM2.5 in the Urumqi, Changji Hui Autonomous Prefecture, and Shihezi urban agglomeration in 2020 |
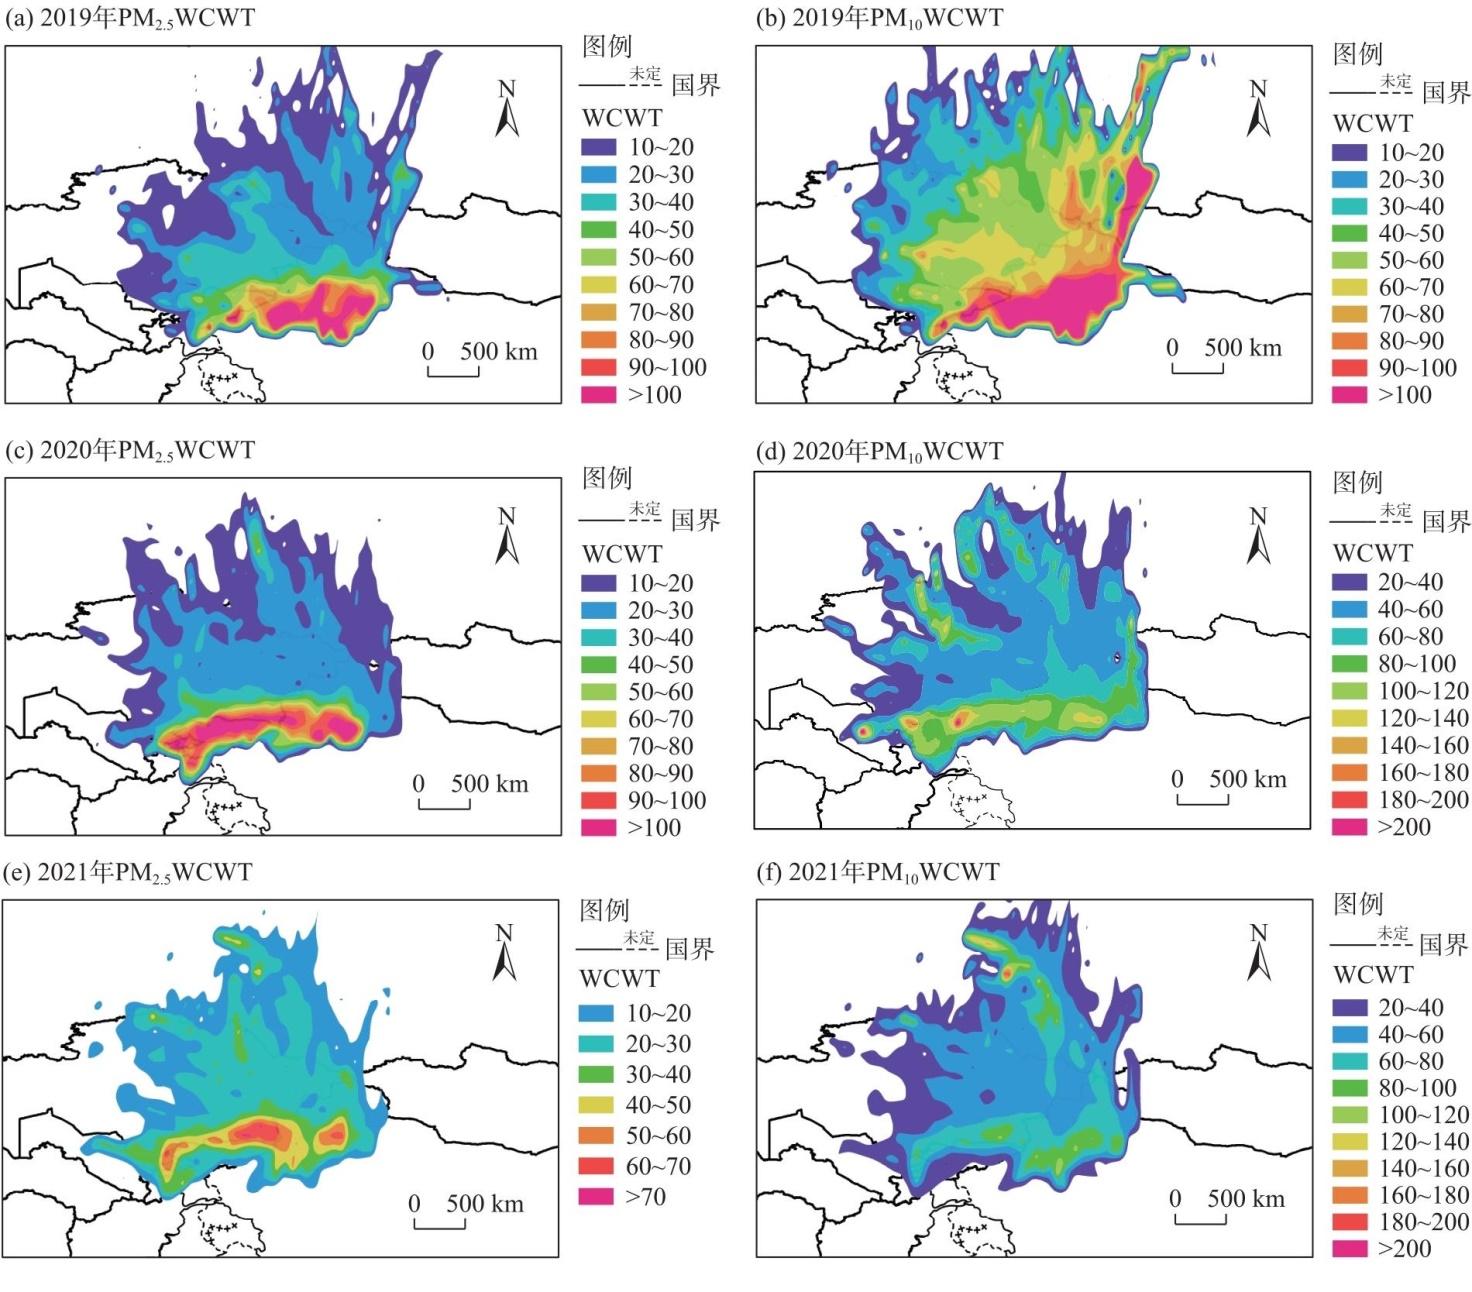
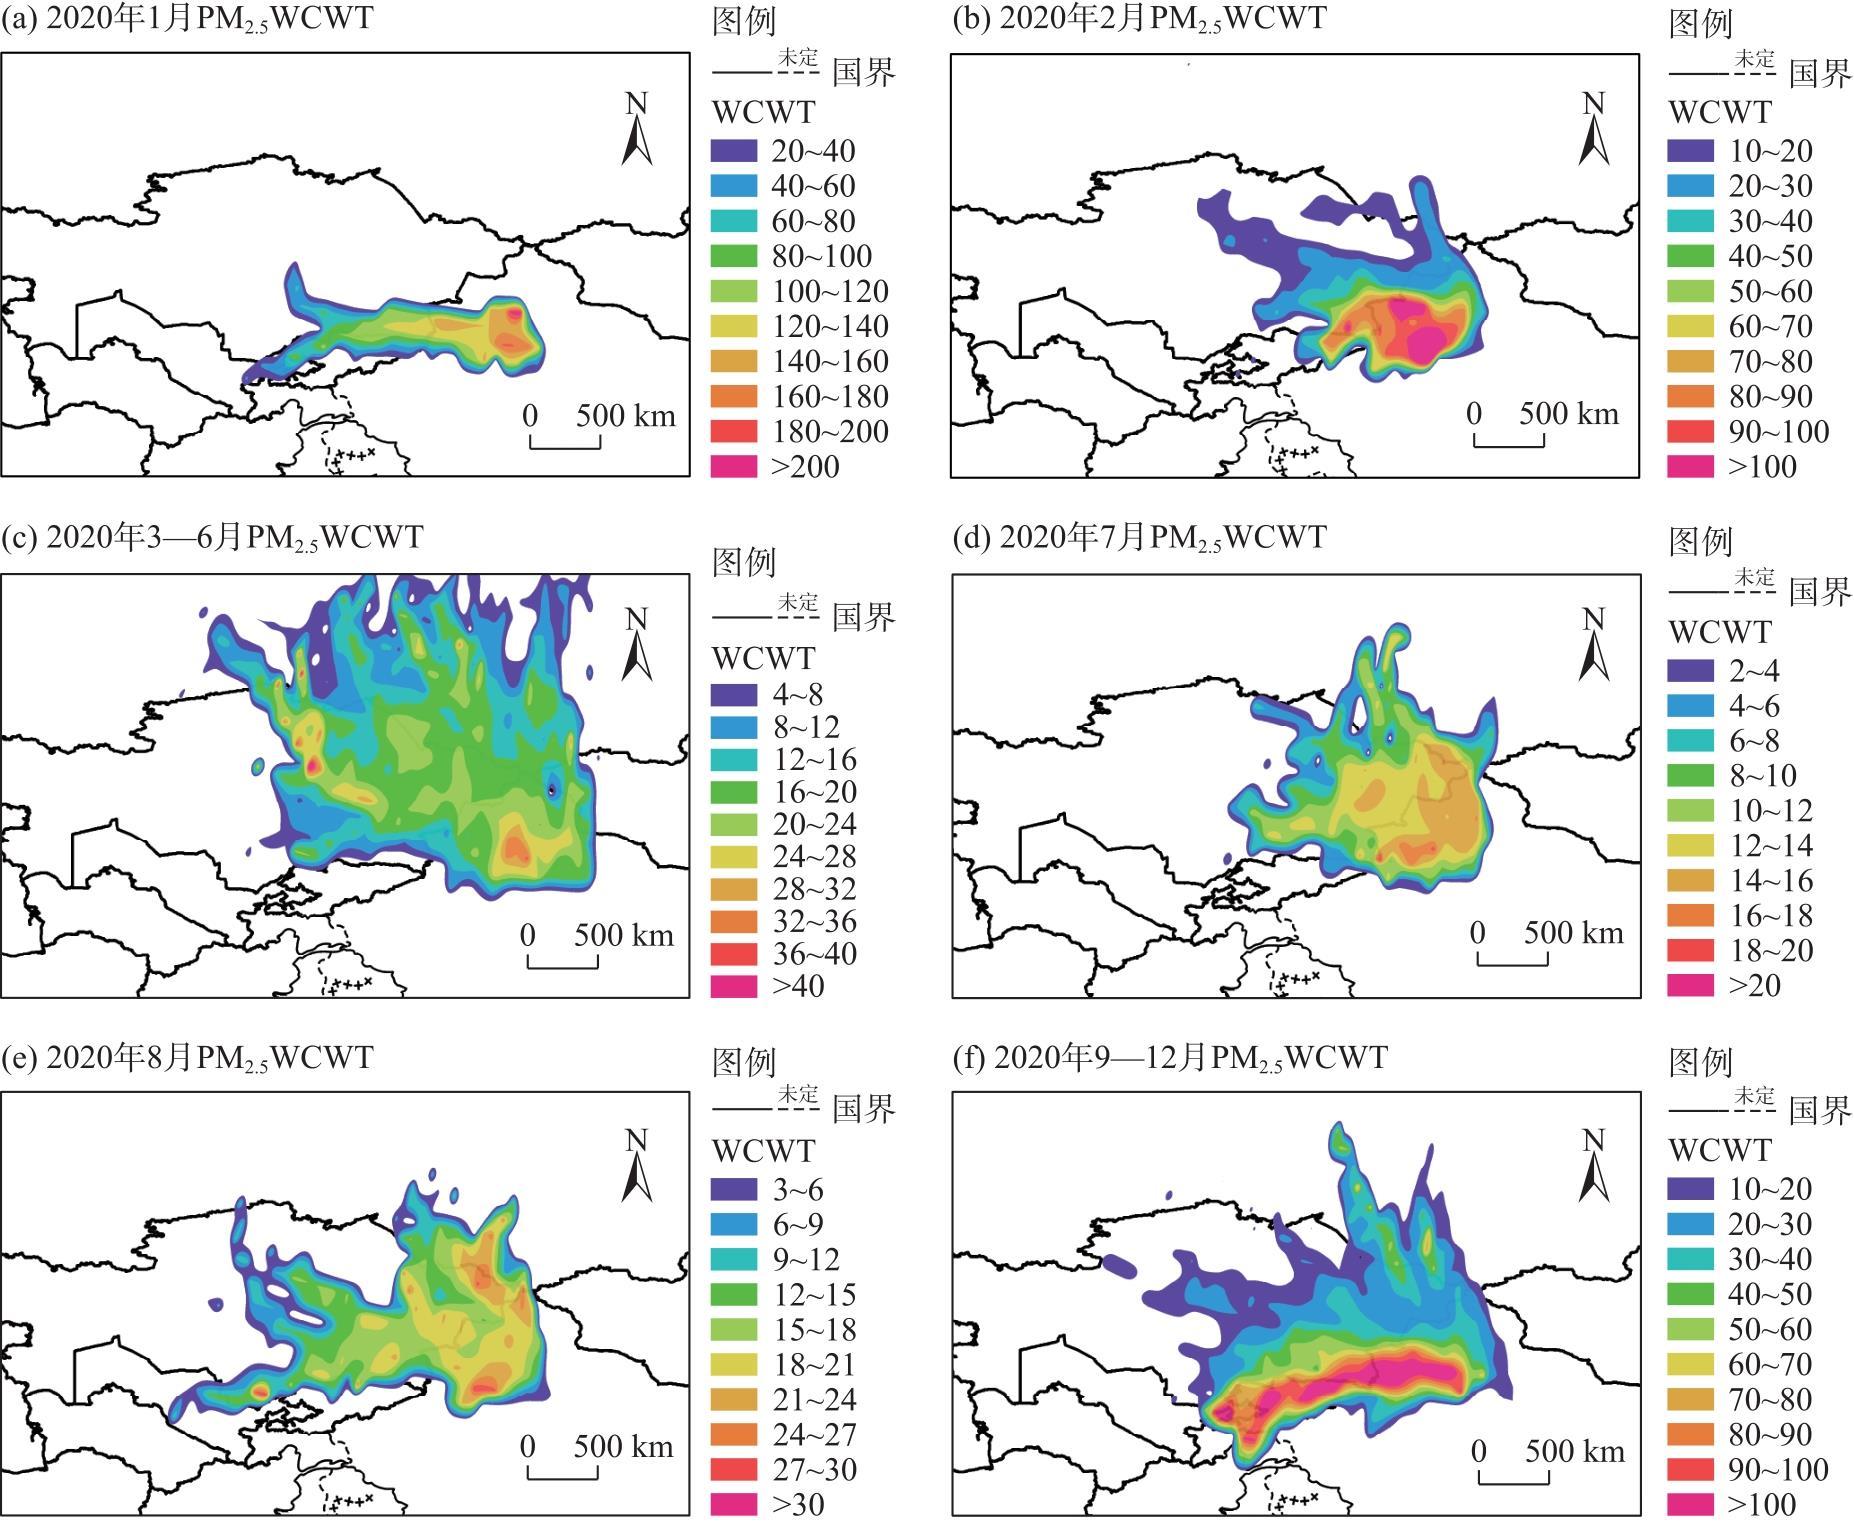
图13 2020年“乌-昌-石”城市群PM2.5浓度权重轨迹月分布Fig. 13 Monthly distributions of PM2.5 concentration weighted trajectory in the Urumqi, Changji Hui Autonomous Prefecture, and Shihezi urban agglomeration in 2020 |
| [1] |
|
| [2] |
|
| [3] |
慕石雷, 杨玉欢, 乌日陶克套胡. 黄河流域五大城市群PM2.5时空演变与影响因素探讨[J]. 干旱区地理, 2024, 47(4): 707-719.
[
|
| [4] |
|
| [5] |
|
| [6] |
|
| [7] |
刘稳, 詹庆明, 邱春迪, 等. 基于精细监测的襄阳冬夏季颗粒物污染时空变化研究[J]. 环境科学与技术, 2023, 46(增刊1): 8-18.
[
|
| [8] |
|
| [9] |
徐勇, 郭振东, 郑志威, 等. 2000—2021年成渝城市群PM2.5时空变化及驱动机制多维探测[J]. 环境科学, 2023, 44(7): 3724-3737.
[
|
| [10] |
肖致美, 李亚菲, 高璟赟, 等. 2013—2020年天津市PM2.5-O3污染变化趋势和影响因素分析[J]. 环境科学, 2023, 44(8): 4211-4219.
[
|
| [11] |
|
| [12] |
李乐, 刘旻霞, 肖仕锐, 等. 山东半岛近地面O3浓度时空变化及潜在源区解析[J]. 环境科学, 2022, 43(3): 1256-1267.
[
|
| [13] |
石小翠. 乌鲁木齐市大气PM2.5的化学组分特征及来源分析[D]. 乌鲁木齐: 新疆农业大学, 2021.
[
|
| [14] |
苗云阁. 新疆南缘沙尘季与非沙尘季大气颗粒物组分特征分析[D]. 天津: 天津师范大学, 2017.
[
|
| [15] |
|
| [16] |
|
| [17] |
|
| [18] |
易唯. 2018年天山北坡经济带PM2.5浓度时空分布特征及其气象影响因素[D]. 兰州: 西北师范大学, 2021.
[
|
| [19] |
付正辉, 刘婷, 汤烨, 等. 乌昌地区大气污染成因分析及应对措施研究[J]. 环境科学与管理, 2013, 38(12): 35-39.
[
|
| [20] |
安欣欣, 曹阳, 王琴, 等. 北京城区PM2.5各组分污染特征及来源分析[J]. 环境科学, 2022, 43(5): 2251-2261.
[
|
| [21] |
|
| [22] |
|
| [23] |
范圣虎, 刘宁, 张飞云. 乌鲁木齐大气污染“周末效应”特征及其变化趋势分析[J]. 新疆环境保护, 2021, 43(2): 1-7.
[
|
| [24] |
李志鹏, 陈健. 基于GOCI卫星的大气细颗粒物PM2.5的遥感反演及其时空分布规律研究[J]. 遥感技术与应用, 2020, 35(1): 163-173.
[
|
| [25] |
刁春娜. 乌昌地区大气颗粒物中主要污染物的监测与其污染特征的探讨[D]. 乌鲁木齐: 新疆大学, 2006.
[
|
| [26] |
郝巨飞, 齐佳慧, 李永占, 等. 邢台市颗粒污染物变化特征和后向轨迹分析[J]. 中国环境监测, 2018, 34(5): 46-53.
[
|
| [27] |
张芊, 庞可, 马彩云, 等. 甘肃地区春冬季颗粒物输送路径及潜在源分析——基于HYSPLIT4模式及TraPSA分析平台[J]. 中国环境科学, 2022, 42(2): 509-518.
[
|
| [28] |
|
| [29] |
符传博, 丹利, 唐家翔, 等. 基于轨迹模式分析海口市大气污染的输送及潜在源区[J]. 环境科学学报, 2020, 40(1): 36-42.
[
|
| [30] |
任浦慧, 解静芳, 姜洪进, 等. 太原市大气PM2.5季节传输路径和潜在源分析[J]. 中国环境科学, 2019, 39(8): 3144-3151.
[
|
| [31] |
王郭臣, 王珏, 信玉洁, 等. 天津PM10和NO2输送路径及潜在源区研究[J]. 中国环境科学, 2014, 34(12): 3009-3016.
[
|
| [32] |
|
| [33] |
|
| [34] |
|
| [35] |
|
| [36] |
孙明霞. 五家渠市空气质量的影响因素及预测研究[D]. 石河子: 石河子大学, 2016.
[
|
| [37] |
冯海英. 疫情防控措施对乌鲁木齐市大气颗粒物浓度及分布影响分析[J]. 环境污染与防治, 2021, 43(5): 606-610.
[
|
| [38] |
李淑婷, 李霞, 毛列尼·阿依提看, 等. 2017—2019年中天山北坡城市群大气污染及污染天气类型特征[J]. 干旱区地理, 2022, 45(4): 1082-1092.
[
|
| [39] |
雷瑜, 张小玲, 唐宜西, 等. 北京城区PM2.5及主要污染气体“周末效应”和“假日效应”研究[J]. 环境科学学报, 2015, 35(5): 1520-1528.
[
|
| [40] |
刘宁, 张飞云, 范圣虎. 乌鲁木齐市“十三五”期间环境空气质量变化及污染原因分析[J]. 新疆环境保护, 2021, 43(3): 17-25.
[
|
/
| 〈 |
|
〉 |