
|
邓文彬(1977-),男,博士,教授,主要从事变形监测与灾害预警、摄影测量与遥感等方面的教学与研究. E-mail: dengwenbin@xju.edu.cn |
收稿日期: 2025-04-28
修回日期: 2025-07-22
网络出版日期: 2026-03-11
基金资助
国家自然科学基金项目(52404188)
新疆维吾尔自治区自然科学基金项目(2024D01C244)
新疆重点研发项目(2022B03033-1)
新疆维吾尔自治区天池英才项目资助
Spatiotemporal dynamics of ecological quality in the Zhundong region based on an arid modified remote sensing ecological index model
Received date: 2025-04-28
Revised date: 2025-07-22
Online published: 2026-03-11
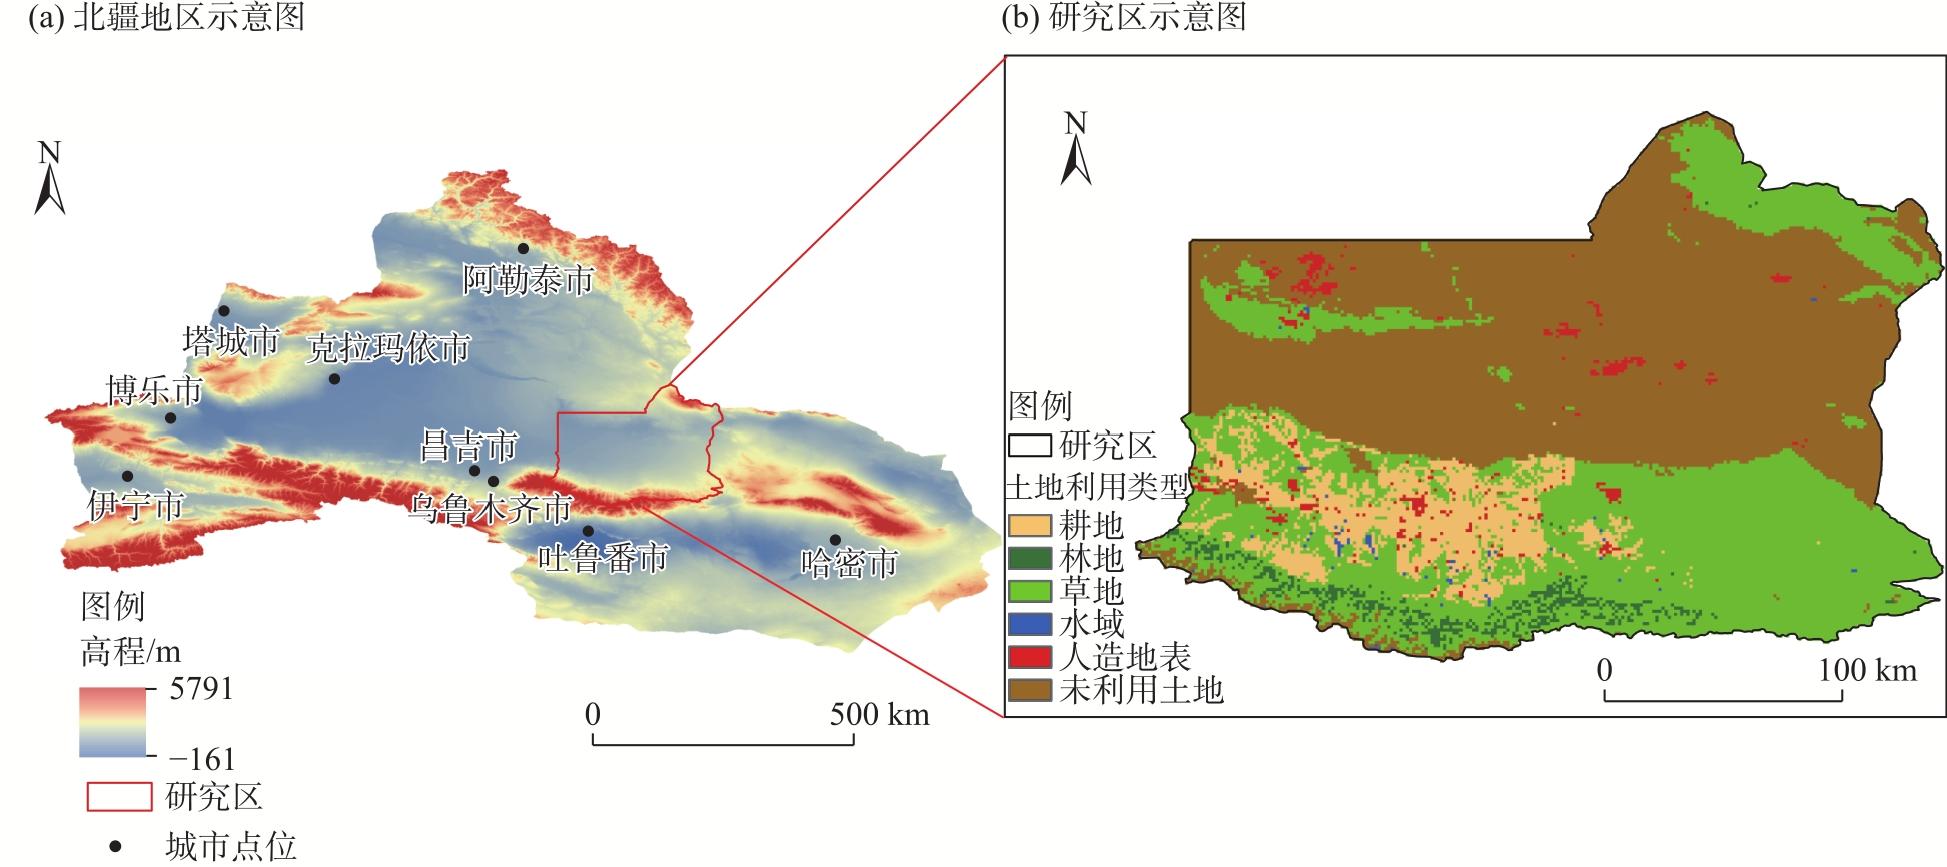
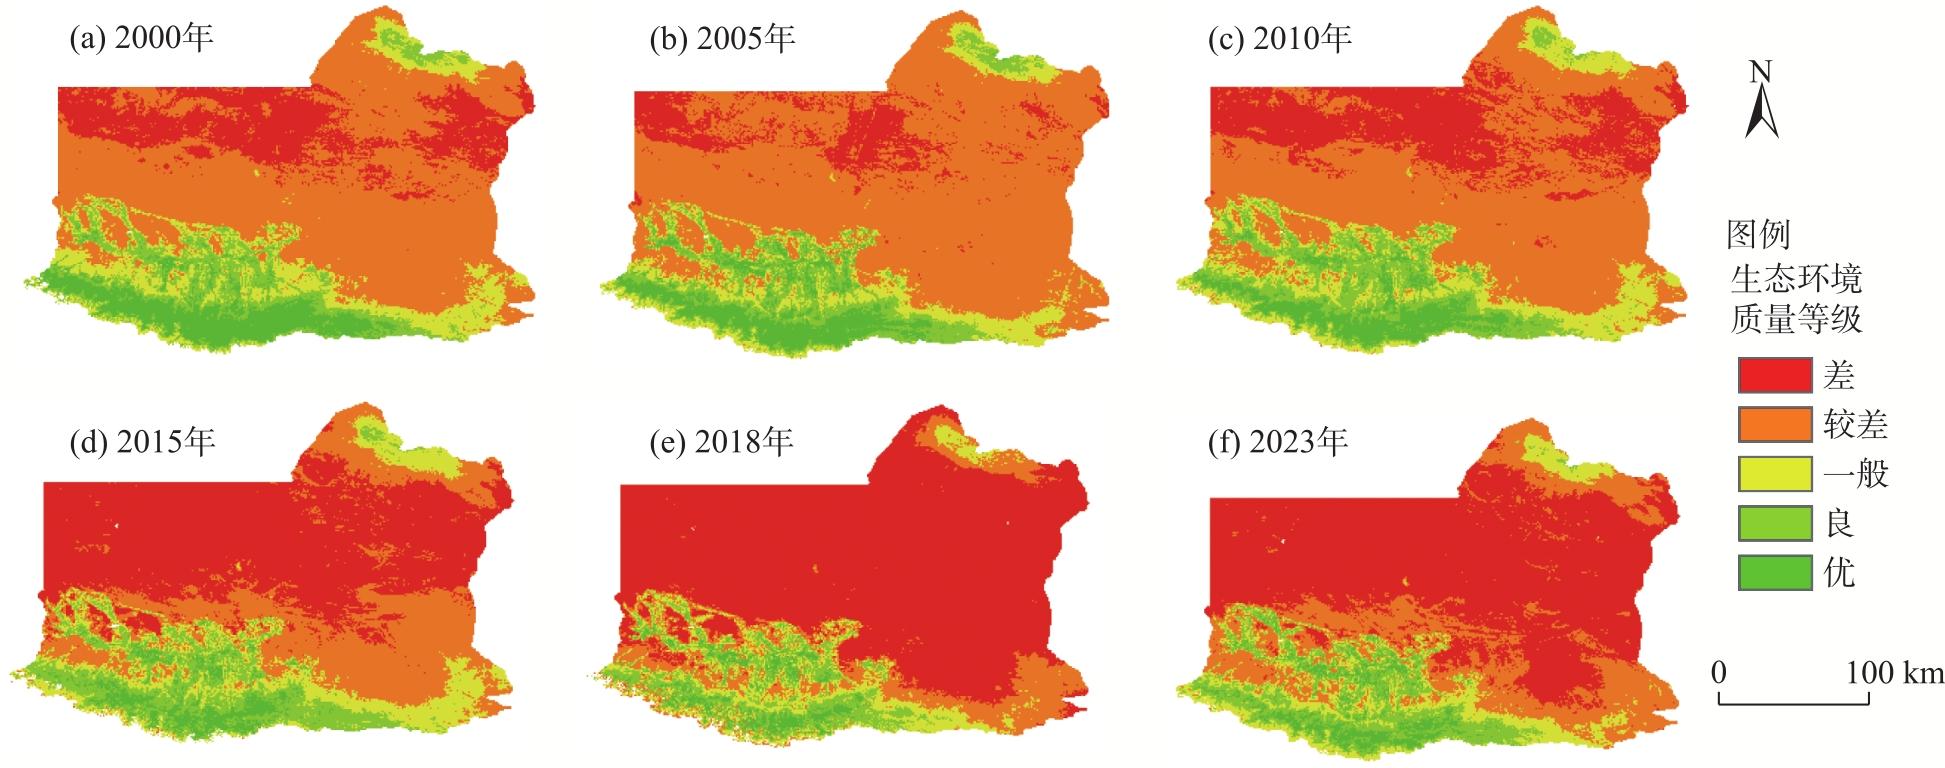
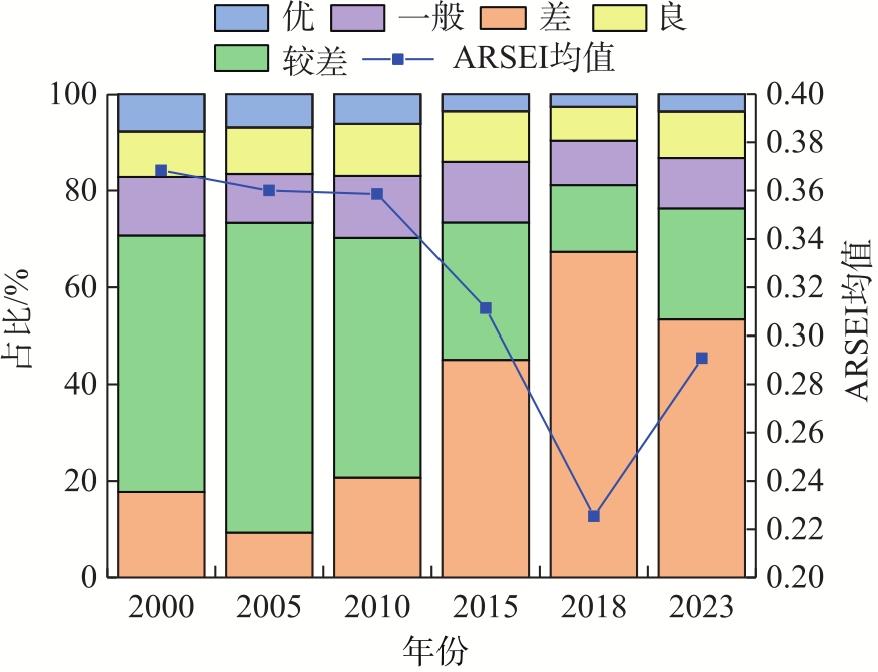
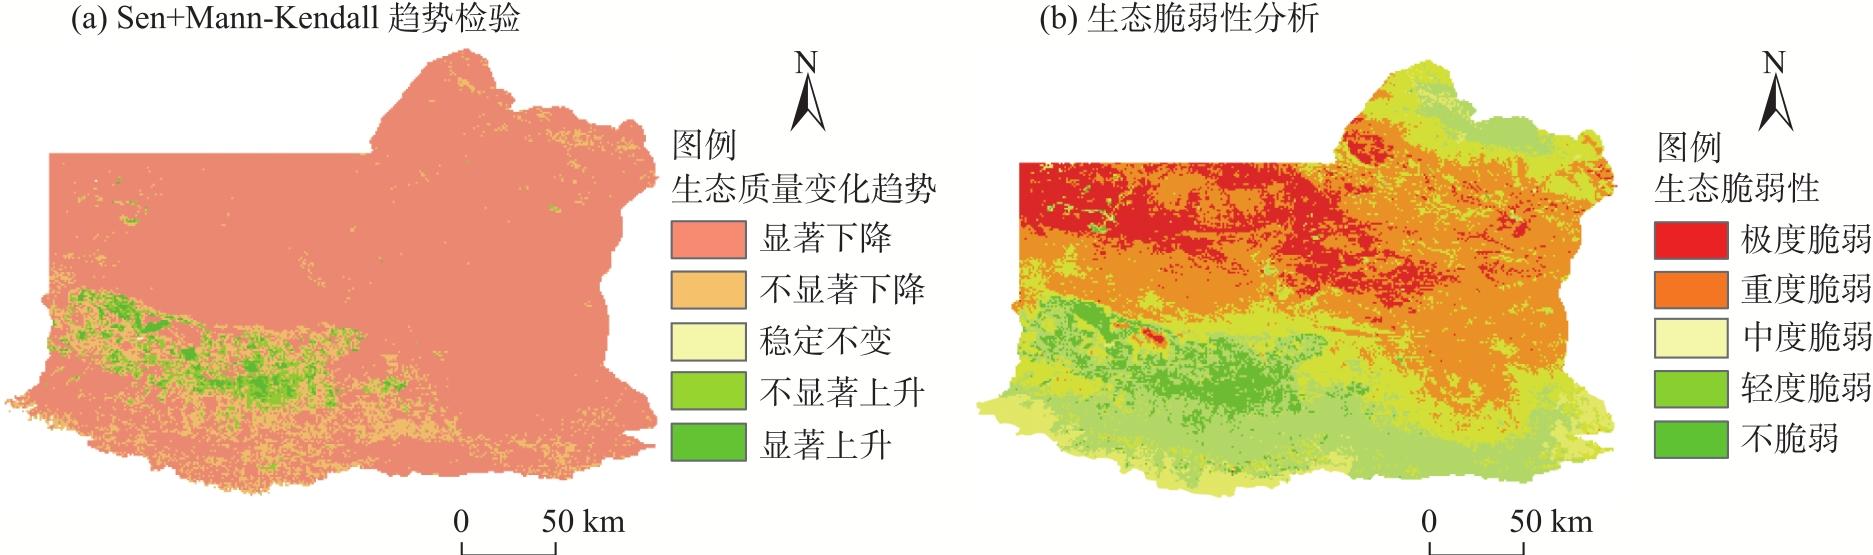
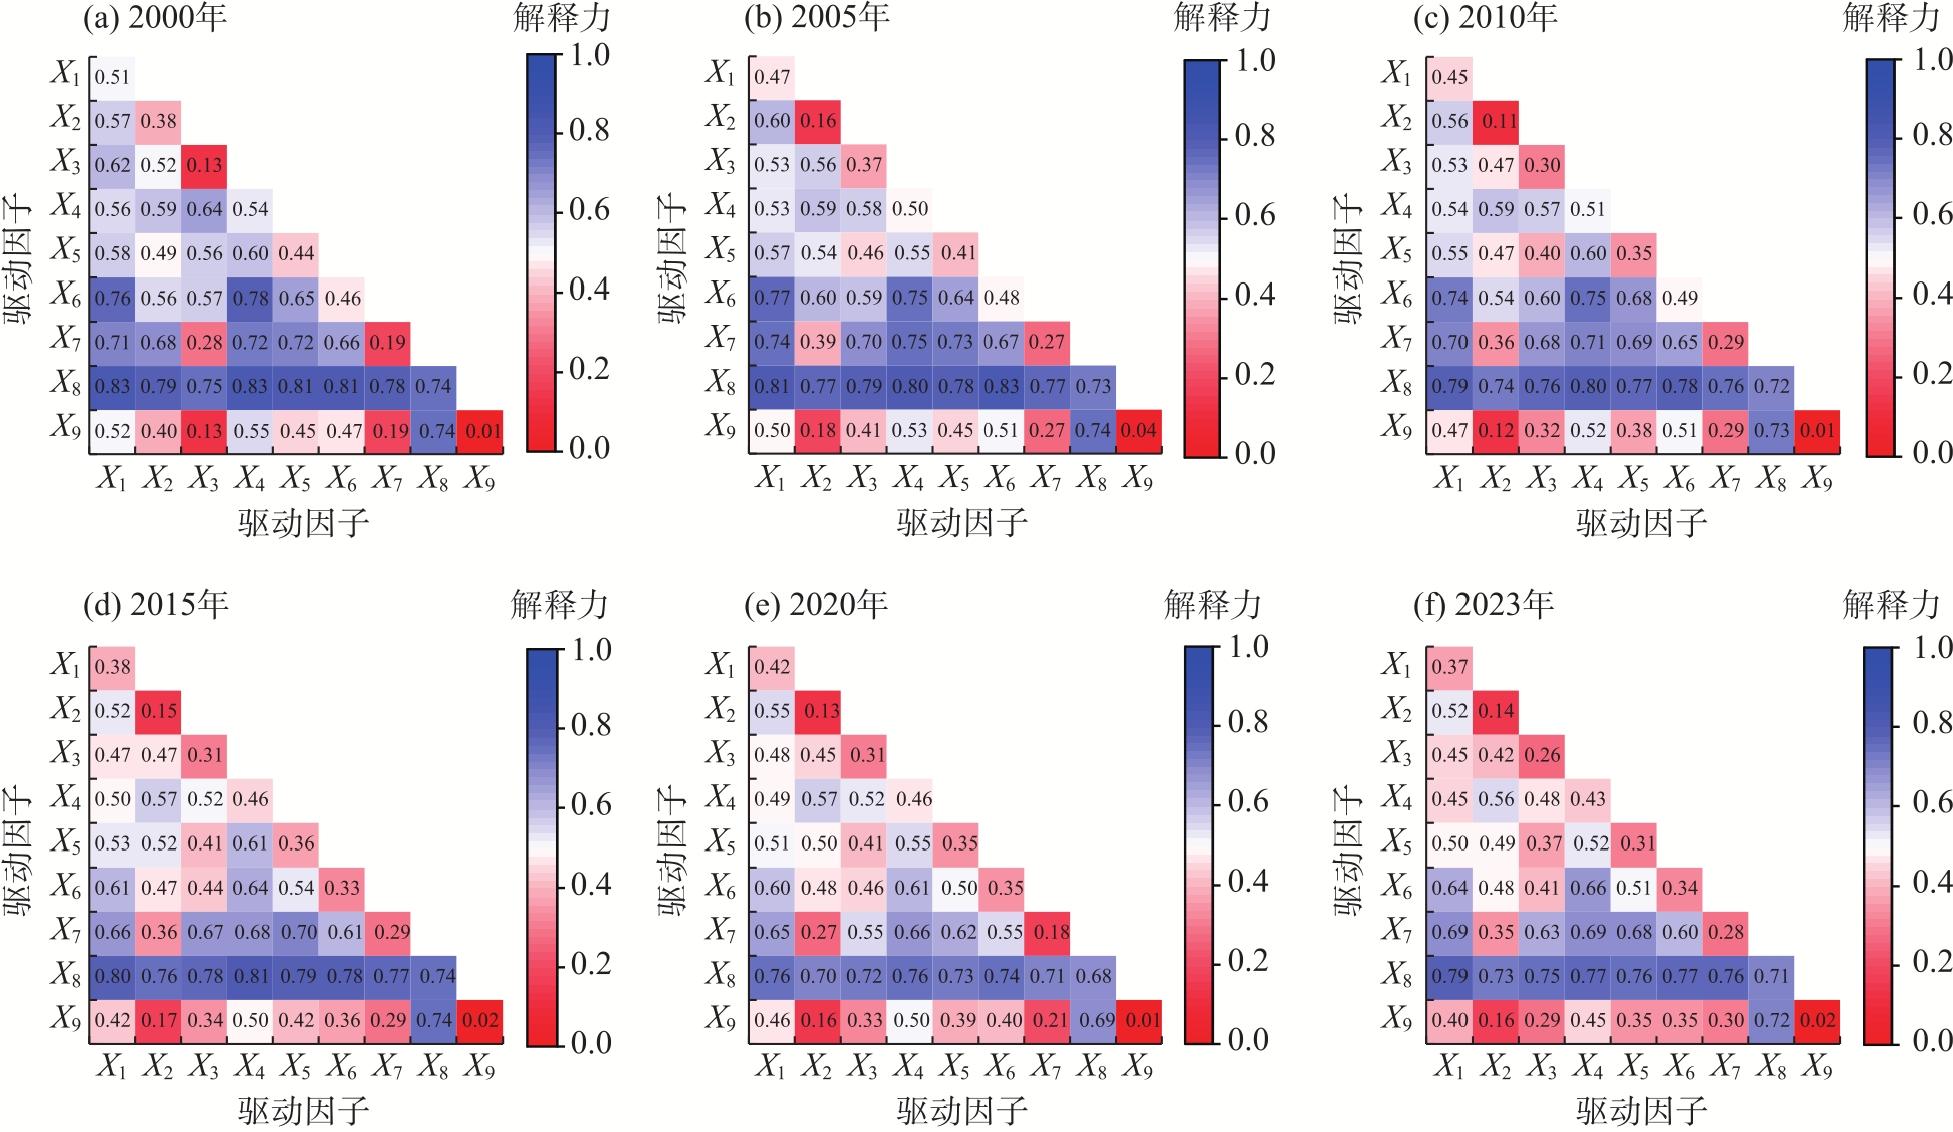
干旱区资源开发与生态保护的矛盾日益突出,科学量化新疆准东煤炭基地生态损伤机制,对破解干旱区资源开发与保护矛盾、保障国家能源安全与区域可持续发展具有关键意义。在此背景下以煤炭资源富集的新疆准东地区为对象,针对其煤炭开发引发的土地沙化、盐渍化及PM2.5污染等生态问题,提出改进型遥感生态指数(Arid modified remote sensing ecological index,ARSEI),通过谷歌地球引擎,使用Landsat时序数据生成了ARSEI,并利用最优参数地理探测器等工具,揭示了2000—2023年准东地区生态环境质量的时空演化特征。结果表明:(1) 2000—2023年准东地区ARSEI整体呈“先降后升”趋势:2000年为峰值0.368,2018年下降至谷底0.225,2023年回升至0.289;空间分布上,生态环境质量等级以“差”与“较差”为主,整体表现为南优北劣。(2) 生态环境质量普遍下降,其中显著下降区域占83.5%,与中北部地区、中度及以上生态脆弱区高度重合;而生态环境质量上升区仅占4.6%,且集中于南部生态非脆弱区的农田与城镇周边。(3) 驱动力分析表明,人类活动强度、蒸散发量与气温为主导单因子,解释力均大于0.35;交互作用后,气温∩人类活动强度的解释力最强,解释力均大于0.7,是生态环境变化的关键驱动因素。
邓文彬 , 宋森 , 易红梅 . 基于改进遥感生态指数的准东地区生态环境质量时空变化分析[J]. 干旱区地理, 2025 , 48(12) : 2073 -2086 . DOI: 10.12118/j.issn.1000-6060.2025.236
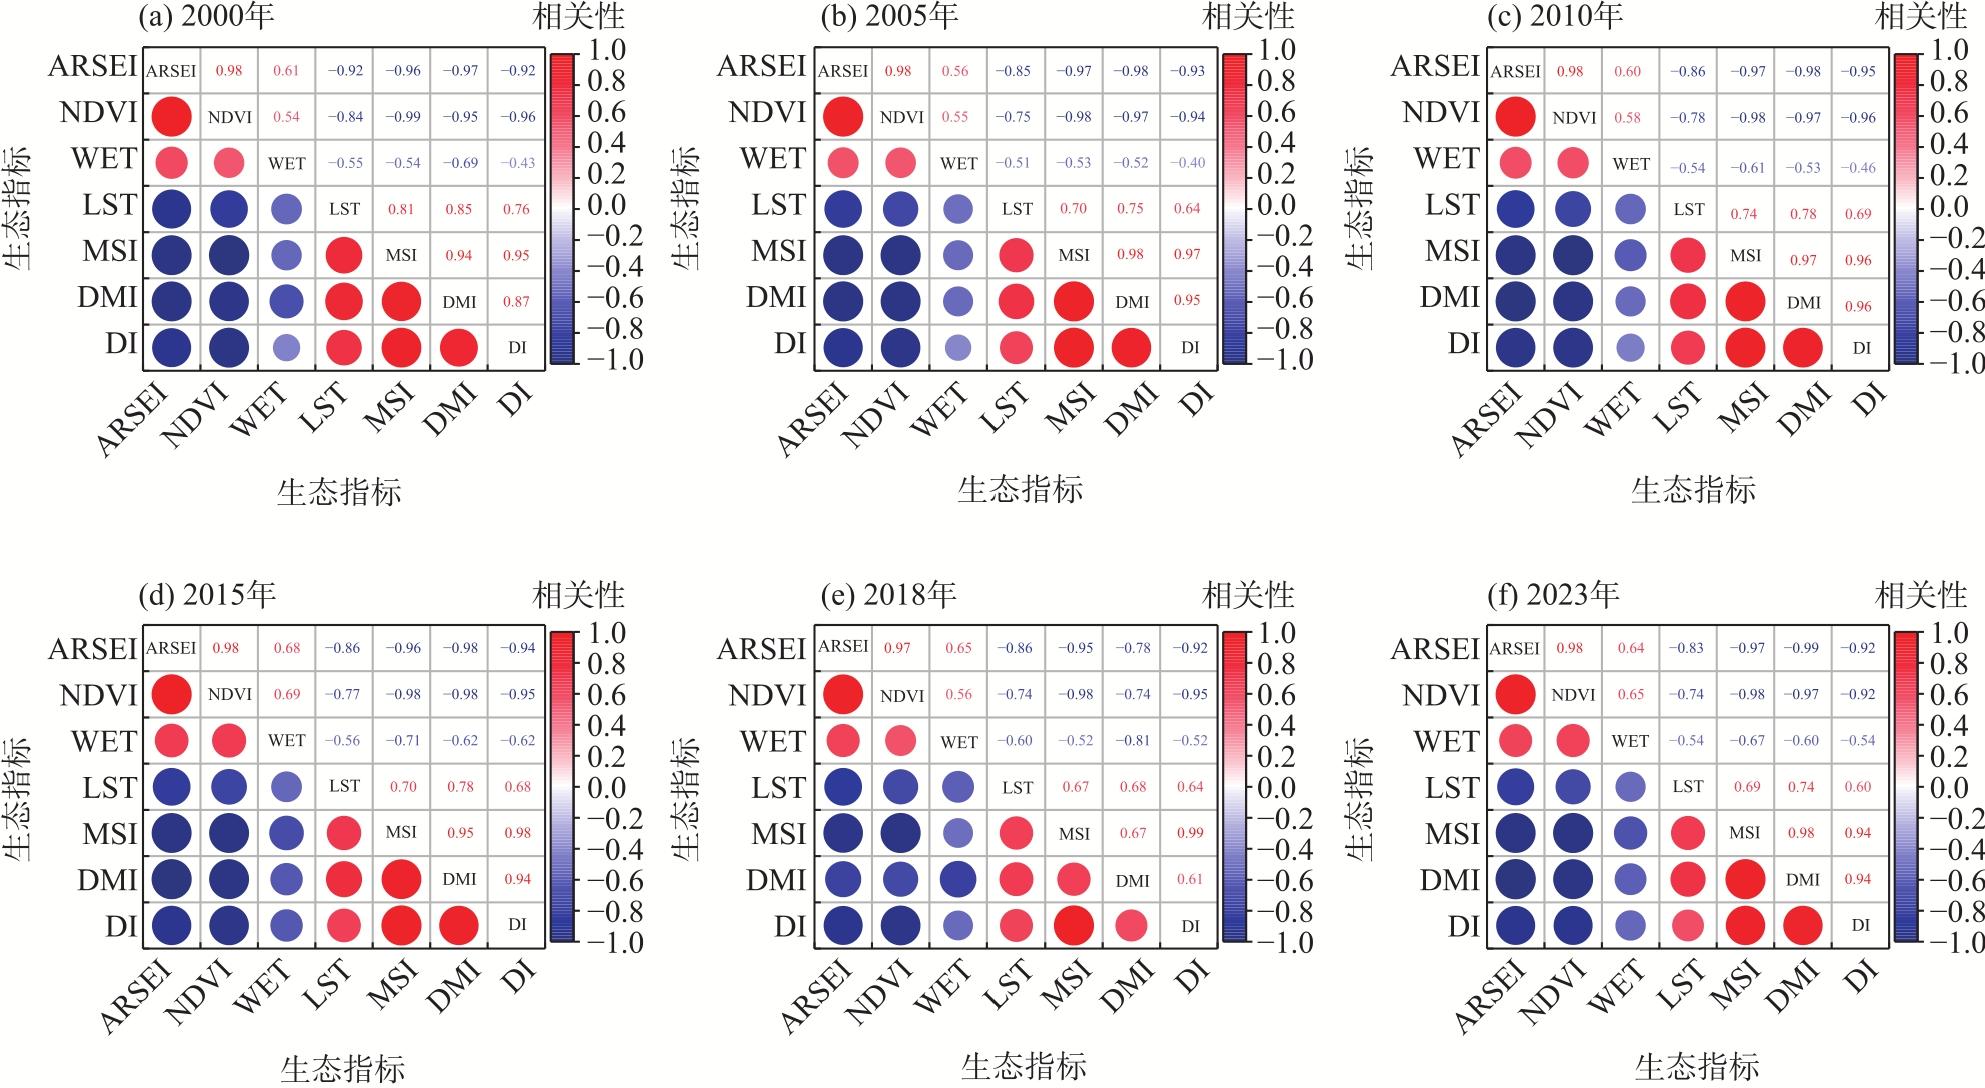
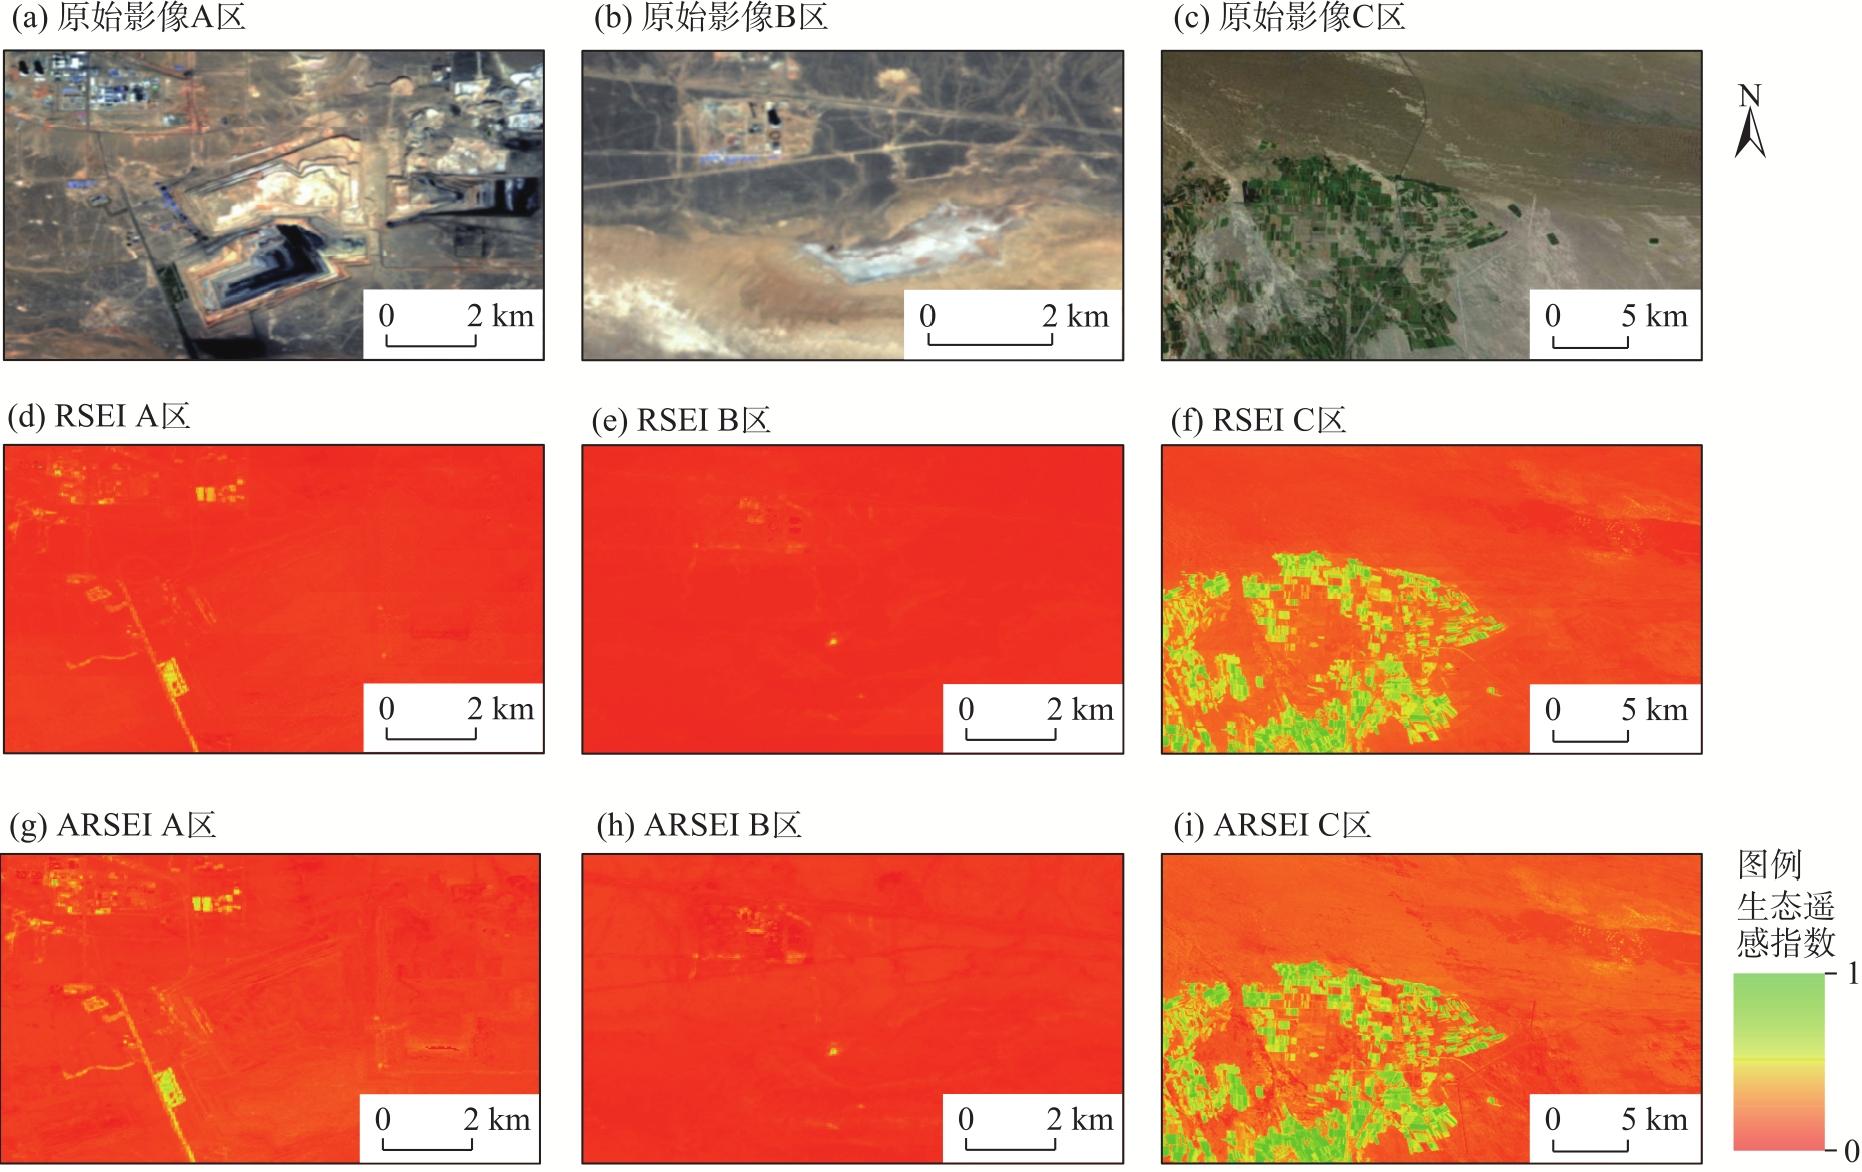
The Zhundong region in Xinjiang, a typical arid and semi-arid area, is a vital national energy base with abundant coal resources. However, intensive coal mining and related industrial activities have caused severe ecological issues, including land desertification, salinization, and PM2.5 pollution, intensifying the conflict between resource exploitation and ecological preservation. To accurately evaluate the ecological environment quality (EEQ) of this region, an arid modified remote sensing ecological index (ARSEI) is proposed herein. The ARSEI improves upon the traditional remote sensing ecological index by incorporating indicators for salinity, desertification, and air pollution, besides greenness, wetness, and heat. Using the Google Earth Engine platform, Landsat 5/8 images from 2000 to 2023 were processed to generate the ARSEI. The first principal component derived via principal component analysis was used to construct the ARSEI, with the direction of the wetness component applied to resolve the eigenvector ambiguity. Temporal trends were analyzed using Sen’s slope estimator and Mann-Kendall trend test, and ecological vulnerability was assessed based on the sensitivity and adaptability of the ARSEI. The optimal parameter-based geographical detector was employed to identify key driving factors and their interactions. Results indicated that the ARSEI of the Zhundong region showed a trend of initial decline followed by a partial recovery from 2000 to 2023, with its mean value decreasing from 0.368 in 2000 to 0.225 in 2018, before increasing to 0.289 in 2023. Spatially, the EEQ was generally poor, with over 60% of the area classified as “poor” or “relatively poor”, exhibiting a clear north-south gradient where the southern part exhibited better ecological conditions. Trend analysis revealed that 83.5% of the region experienced significant ecological degradation, whereas only 4.6% showed improvement, mainly in the southern agricultural and urban areas with low ecological vulnerability. Single-factor detection identified human activity intensity (q>0.6) and evapotranspiration (q>0.35) as the primary drivers. The interaction between temperature and human activity intensity had the strongest explanatory power (q>0.7), indicating nonlinear enhancement effects. In summary, large-scale resource development has exerted considerable pressure on the already fragile ecosystem. Although ecological restoration measures since 2019 have led to a partial recovery, the northern mining areas remain highly vulnerable due to water scarcity and soil degradation. The ARSEI model demonstrates enhanced applicability in arid resource-based regions and offers a scientific basis for ecological protection and sustainable development strategies.
表 1 数据信息与来源Tab. 1 Data information and source |
| 数据类型 | 数据名称 | 分辨率 | 来源 |
|---|---|---|---|
| 遥感影像 | Landsat 5 | 30 m | GEE(LANDSAT/LT05/C02/T1_L2) |
| Landsat 8 | 30 m | GEE(LANDSAT/LC08/C02/T1_L2) | |
| 自然数据 | 高程 | 90 m | 地理空间数据云(https://www.gscloud.cn/) |
| 坡度 | 90 m | 地理空间数据云(https://www.gscloud.cn/) | |
| 坡向 | 90 m | 地理空间数据云(https://www.gscloud.cn/) | |
| 气温 | 1 km | NOAA(https://www.ncei.noaa.gov) | |
| 降水 | 1 km | 国家青藏高原科学数据中心(https://data.tpdc.ac.cn/home) | |
| 蒸散发量 | 1 km | 国家青藏高原科学数据中心(https://data.tpdc.ac.cn/home) | |
| 经济数据 | 人口密度 | 1 km | LandScan Global数据集(https://landscan.ornl.gov/) |
| 夜间灯光 | 500 m | 国家地球系统科学数据中心(http://www.geodata.cn) | |
| 土地利用类型 | 1 km | 中国科学院地理科学与资源研究所(http://www.resdc.cn) |
表 2 ARSEI模型生态指标计算公式Tab. 2 Calculation formula for ARSEI model ecological indicators |
| 遥感参数 | 计算公式 | 参数解释 |
|---|---|---|
| NDVI[17] | $\mathrm{N}\mathrm{D}\mathrm{V}\mathrm{I}=\left({\rho }_{\mathrm{N}\mathrm{I}\mathrm{R}}-{\rho }_{\mathrm{R}\mathrm{e}\mathrm{d}}\right)/\left({\rho }_{\mathrm{N}\mathrm{I}\mathrm{R}}+{\rho }_{\mathrm{R}\mathrm{e}\mathrm{d}}\right)$ | NDVI为归一化植被指数;${\rho }_{\mathrm{N}\mathrm{I}\mathrm{R}}$、${\rho }_{\mathrm{R}\mathrm{e}\mathrm{d}}$分别为近红外、红波段的反射率 |
| WET[18] | $\begin{array}{l}\mathrm{W}\mathrm{E}{\mathrm{T}}_{5}=0.0315{\rho }_{\mathrm{B}\mathrm{l}\mathrm{u}\mathrm{e}}+0.2021{\rho }_{\mathrm{G}\mathrm{r}\mathrm{e}\mathrm{e}\mathrm{n}}+0.3102{\rho }_{\mathrm{R}\mathrm{e}\mathrm{d}}+0.1594{\rho }_{\mathrm{N}\mathrm{I}\mathrm{R}}-\\ 0.6806{\rho }_{\mathrm{S}\mathrm{W}\mathrm{I}\mathrm{R}1}-0.6109{\rho }_{\mathrm{S}\mathrm{W}\mathrm{I}\mathrm{R}2}\end{array}$ $\begin{array}{l}\mathrm{W}\mathrm{E}{\mathrm{T}}_{8}=0.1511{\rho }_{\mathrm{B}\mathrm{l}\mathrm{u}\mathrm{e}}+0.1972{\rho }_{\mathrm{G}\mathrm{r}\mathrm{e}\mathrm{e}\mathrm{n}}+0.3283{\rho }_{\mathrm{R}\mathrm{e}\mathrm{d}}+0.3407{\rho }_{\mathrm{N}\mathrm{I}\mathrm{R}}-\\ 0.7117{\rho }_{\mathrm{S}\mathrm{W}\mathrm{I}\mathrm{R}1}-0.4559{\rho }_{\mathrm{S}\mathrm{W}\mathrm{I}\mathrm{R}2}\end{array}$ | WET为湿度指数;$\mathrm{W}\mathrm{E}{\mathrm{T}}_{5}$与$\mathrm{W}\mathrm{E}{\mathrm{T}}_{8}$分别为Landsat 5与Landsat 8影像下的湿度计算方法;${\rho }_{\mathrm{B}\mathrm{l}\mathrm{u}\mathrm{e}}$、${\rho }_{\mathrm{G}\mathrm{r}\mathrm{e}\mathrm{e}\mathrm{n}}$、${\rho }_{\mathrm{S}\mathrm{W}\mathrm{I}\mathrm{R}1}$、${\rho }_{\mathrm{S}\mathrm{W}\mathrm{I}\mathrm{R}2}$分别为蓝、绿、短波红外1、短波红外2波段的反射率 |
| LST[19] | $\mathrm{L}\mathrm{S}\mathrm{T}={K}_{2}/\left(\frac{{K}_{1}}{T}+1\right)$ ${L}_{\lambda }=\left[\epsilon T+\left(1-\epsilon \right){L}_{\mathrm{d}\mathrm{o}\mathrm{w}\mathrm{n}}\right]+{L}_{\mathrm{u}\mathrm{p}}$ $T=\left[{L}_{\lambda }-{L}_{\mathrm{u}\mathrm{p}}-\tau \left(1-\epsilon \right){L}_{\mathrm{d}\mathrm{o}\mathrm{w}\mathrm{n}}\right]/\tau \epsilon $ | LST为地表温度;${L}_{\lambda }$、T分别为热红外、黑体热辐射亮度值;$\epsilon $为地表比辐射率;$\tau $为大气透过率;Lup、${L}_{\mathrm{d}\mathrm{o}\mathrm{w}\mathrm{n}}$为大气上行、下行辐射亮度;K1、K2为传感器定标参数 |
| MSI[20] | $\mathrm{S}\mathrm{I}=\left({\rho }_{\mathrm{B}\mathrm{l}\mathrm{u}\mathrm{e}}\times {\rho }_{\mathrm{R}\mathrm{e}\mathrm{d}}\right)/2$ $\mathrm{M}\mathrm{S}\mathrm{A}\mathrm{V}\mathrm{I}=\frac{(2{\rho }_{\mathrm{N}\mathrm{I}\mathrm{R}}+1)-\sqrt{(2{\rho }_{\mathrm{N}\mathrm{I}\mathrm{R}}{+1)}^{2}-8({\rho }_{\mathrm{N}\mathrm{I}\mathrm{R}}-{\rho }_{\mathrm{R}\mathrm{e}\mathrm{d}})}}{2}$ $\mathrm{M}\mathrm{S}\mathrm{I}=\sqrt{{\left({M}_{\mathrm{N}\mathrm{I}}-{M}_{\mathrm{m}\mathrm{a}\mathrm{x}}\right)}^{2}+\mathrm{S}{\mathrm{I}}_{\mathrm{N}\mathrm{I}}^{2}}$ | MSI为土壤盐渍化指数;MSAVI为修改型土壤调整植被指数;SI为盐分指数;MNI、${M}_{\mathrm{m}\mathrm{a}\mathrm{x}}$分别为MSAVI的归一化与最大值;$\mathrm{S}{\mathrm{I}}_{\mathrm{N}\mathrm{I}}$为SI的归一化 |
| DMI[11] | $\mathrm{a}\mathrm{l}\mathrm{b}\mathrm{e}\mathrm{d}\mathrm{o}=0.356\times {\rho }_{\mathrm{B}\mathrm{l}\mathrm{u}\mathrm{e}}+0.130{\rho }_{\mathrm{R}\mathrm{e}\mathrm{d}}+0.085{\rho }_{\mathrm{S}\mathrm{W}\mathrm{I}\mathrm{R}1}+0.072{\rho }_{\mathrm{S}\mathrm{W}\mathrm{I}\mathrm{R}2}-0.0018$ $\mathrm{S}\mathrm{F}\mathrm{I}=\left({\rho }_{\mathrm{S}\mathrm{W}\mathrm{I}\mathrm{R}1}-{\rho }_{\mathrm{B}\mathrm{l}\mathrm{u}\mathrm{e}}\right)/\left(200-{\rho }_{\mathrm{S}\mathrm{W}\mathrm{I}\mathrm{R}1}-{\rho }_{\mathrm{S}\mathrm{W}\mathrm{I}\mathrm{R}2}\right)$ $\mathrm{D}\mathrm{M}\mathrm{I}=\sqrt{{\left({M}_{\mathrm{N}\mathrm{I}}-{M}_{\mathrm{m}\mathrm{a}\mathrm{x}}\right)}^{2}+({a}_{\mathrm{N}\mathrm{I}}-{a}_{\mathrm{m}\mathrm{i}\mathrm{n}}{)}^{2}+({S}_{\mathrm{N}\mathrm{I}}-{S}_{\mathrm{m}\mathrm{i}\mathrm{n}}{)}^{2}}$ | albedo为地表反射率;SFI为土壤肥力指数;DMI为土壤沙化指数;SNI、${S}_{\mathrm{m}\mathrm{i}\mathrm{n}}$分别为SI的归一化与最小值;aNI、${a}_{\mathrm{m}\mathrm{i}\mathrm{n}}$分别为albedo的归一化与最小值 |
| DI[21] | $\mathrm{D}\mathrm{I}={\rho }_{\mathrm{R}\mathrm{e}\mathrm{d}}-{\rho }_{\mathrm{N}\mathrm{I}\mathrm{R}}$ | DI为PM2.5差值指数 |
表3 Sen+Mann-Kendall 趋势等级划分Tab. 3 Sen+Mann-Kendall trend classification criteria |
| ${Q}_{\mathrm{A}\mathrm{R}\mathrm{S}\mathrm{E}\mathrm{I}}$ | Z | 趋势特征 |
|---|---|---|
| ${Q}_{\mathrm{A}\mathrm{R}\mathrm{S}\mathrm{E}\mathrm{I}}>0$ | 1.96<Z | 显著上升 |
| Z<1.96 | 不显著上升 | |
| ${Q}_{\mathrm{A}\mathrm{R}\mathrm{S}\mathrm{E}\mathrm{I}}=0$ | Z | 稳定不变 |
| ${Q}_{\mathrm{A}\mathrm{R}\mathrm{S}\mathrm{E}\mathrm{I}}<0$ | Z<1.96 | 不显著下降 |
| 1.96<Z | 显著下降 |
注:${Q}_{\mathrm{A}\mathrm{R}\mathrm{S}\mathrm{E}\mathrm{I}}$为ARSEI的变化趋势;Z为ARSEI变化的显著性水平。 |
表4 地理探测器交互作用探测类型Tab. 4 Types of Geodetector interactions |
| 判断依据 | 交互作用类型 |
|---|---|
| $q\left({X}_{1}\bigcap {X}_{2}\right)<\mathrm{m}\mathrm{i}\mathrm{n}\left[q\left({X}_{1}\right),q\left({X}_{2}\right)\right]$ | 非线性减弱 |
| $\mathrm{m}\mathrm{i}\mathrm{n}\left[q\left({X}_{1}\right),q\left({X}_{2}\right)\right]<q\left({X}_{1}\bigcap {X}_{2}\right)<\mathrm{m}\mathrm{a}\mathrm{x}\left[q\left({X}_{1}\right),q\left({X}_{2}\right)\right]$ | 单因子非线性减弱 |
| $q\left({X}_{1}\bigcap {X}_{2}\right)>\mathrm{m}\mathrm{a}\mathrm{x}\left[q\left({X}_{1}\right),q\left({X}_{2}\right)\right]$ | 双因子增强 |
| $q\left({X}_{1}\bigcap {X}_{2}\right)=q\left({X}_{1}\right)+q\left({X}_{2}\right)$ | 独立 |
| $q\left({X}_{1}\bigcap {X}_{2}\right)>q\left({X}_{1}\right)+q\left({X}_{2}\right)$ | 非线性增强 |
注:q为影响因子对生态环境质量的解释力;X1、X2分别为2个进行交互作用探测的影响因子。 |
表5 主成分分析结果Tab. 5 Principal component analysis of ARSEI |
| 年份 | 成分 | 各指标载荷值 | 特征值 | 贡献率/% | |||||
|---|---|---|---|---|---|---|---|---|---|
| NDVI | WET | LST | MSI | DMI | DI | ||||
| 2000 | PC1 | -0.574 | -0.127 | 0.526 | 0.262 | 0.476 | 0.286 | 0.0951 | 87.84 |
| PC2 | -0.374 | 0.061 | -0.824 | 0.224 | 0.163 | 0.316 | 0.0078 | 7.20 | |
| 2005 | PC1 | -0.592 | -0.135 | 0.473 | 0.301 | 0.462 | 0.330 | 0.0992 | 85.18 |
| PC2 | -0.304 | -0.054 | -0.847 | 0.245 | 0.093 | 0.344 | 0.0106 | 9.10 | |
| 2010 | PC1 | -0.623 | -0.164 | 0.475 | 0.316 | 0.379 | 0.339 | 0.1110 | 85.37 |
| PC2 | -0.336 | 0.115 | -0.821 | 0.252 | -0.014 | 0.370 | 0.0102 | 7.88 | |
| 2015 | PC1 | -0.554 | -0.098 | 0.485 | 0.316 | 0.502 | 0.309 | 0.0871 | 84.64 |
| PC2 | -0.335 | -0.026 | -0.833 | 0.301 | 0.044 | 0.317 | 0.0098 | 9.50 | |
| 2018 | PC1 | -0.588 | -0.104 | 0.526 | 0.373 | 0.261 | 0.399 | 0.0743 | 81.83 |
| PC2 | -0.322 | 0.092 | -0.789 | 0.321 | -0.136 | 0.378 | 0.0112 | 12.38 | |
| 2023 | PC1 | -0.575 | -0.159 | 0.493 | 0.355 | 0.374 | 0.367 | 0.0891 | 80.74 |
| PC2 | -0.333 | 0.070 | -0.694 | 0.259 | -0.299 | 0.496 | 0.0120 | 10.79 | |
注:PC1、PC2分别为主成分分析后得到的第一、第二主成分。 |
表6 不同土地利用类型下人类活动影响强度参数Tab. 6 Parameters of human activity impact intensity under different land use types |
| 土地利用类型 | 人类活动影响强度参数 |
|---|---|
| 耕地 | 0.200 |
| 林地 | 0.082 |
| 草地 | 0.067 |
| 水体 | 0.143 |
| 建设用地 | 1.000 |
| 未利用土地 | 0.000 |
| [1] |
|
| [2] |
屈楠, 卢杰, 王子明, 等. 毛乌素沙地生态环境质量时空演变及驱动因素[J]. 水土保持通报, 2025, 45(5): 336-346.
[
|
| [3] |
徐勇, 戴强玉, 黄雯婷, 等. 2000—2020年西南地区植被NDVI时空变化及驱动机制探究[J]. 环境科学, 2023, 44(1): 323-335.
[
|
| [4] |
刘博, 韩庆功, 张杰琳, 等. 变化环境下黄河中游土壤湿度时空格局及其影响因素[J]. 水土保持学报, 2025, 39(1): 73-83.
[
|
| [5] |
国家环保总局. 生态环境状况评价技术规范(试行)[EB/OL]. [2006-03-09]. https://www.mee.gov.cn/gkml/zj/gg/200910/t20091021_171618.htm.
[State Environmental Protection Agency. Te- chnical criterion for eco-environment status evaluation[EB/OL]. [2006-03-09]. https://www.mee.gov.cn/gkml/zj/gg/200910/t20091021_171618.htm.]
|
| [6] |
徐涵秋. 城市遥感生态指数的创建及其应用[J]. 生态学报, 2013, 33(24): 7853-7862.
[
|
| [7] |
|
| [8] |
么廷禹, 王东升, 邰姗姗. 基于遥感生态指数的鞍山市生态环境质量变化研究[J]. 环境科学与技术, 2024, 47(12): 199-210.
[
|
| [9] |
王杰, 马佳丽, 解斐斐, 等. 干旱地区遥感生态指数的改进——以乌兰布和沙漠为例[J]. 应用生态学报, 2020, 31(11): 3795-3804.
[
|
| [10] |
马鹏飞, 张安兵, 王贺封, 等. 基于改进遥感生态指数的矿区生态环境监测及驱动因素分析[J]. 生态与农村环境学报, 2023, 39(12): 1580-1590.
[
|
| [11] |
汤从沧, 李巧, 陶洪飞, 等. 基于改进遥感生态指数模型的塔里木河流域生态环境质量评价[J]. 环境科学, 2025, 46(7): 4485-4498.
[
|
| [12] |
|
| [13] |
|
| [14] |
曾强, 李根生, 董敬宣, 等. 新疆煤炭资源开采典型生态环境问题及对策[J]. 矿业安全与环保, 2017, 44(1): 106-110.
[
|
| [15] |
张东升, 刘洪林, 范钢伟, 等. 新疆大型煤炭基地科学采矿的内涵与展望[J]. 采矿与安全工程学报, 2015, 32(1): 1-6.
[
|
| [16] |
薛一波, 张小啸, 雷加强, 等. 新疆大气颗粒物污染时空演变及沙尘组分研究[J]. 中国环境科学, 2024, 44(6): 3012-3020.
[
|
| [17] |
赵旭, 李浩, 朱益虎, 等. 融合高分影像与时序NDVI的农作物语义分割模型[J]. 农业工程学报, 2025, 41(14): 216-227.
[
|
| [18] |
|
| [19] |
|
| [20] |
李世娇, 张珂珂, 谢宝妮, 等. 基于遥感的库尔勒地区生态环境质量评价及成因分析[J]. 干旱区地理, 2024, 47(12): 2064-2074.
[
|
| [21] |
冯海英, 冯仲科, 冯海霞. 一种基于差值指数的颗粒物PM2.5浓度反演新方法[J]. 光谱学与光谱分析, 2018, 38(10): 3012-3016.
[
|
| [22] |
|
| [23] |
|
| [24] |
王南, 刘泽轩, 郑江华, 等. 天山冰湖分布时空特征及驱动力分析[J]. 干旱区地理, 2024, 47(9): 1472-1481.
[
|
| [25] |
IPCC Climate change 2014: Impacts, adaptation, and vulnerability. Part A:Global and sectoral aspects. Contribution of working group II to the fifth assessment report of the intergovernmental panel on climate change[M]. Cambridge, UK: Cambridge University Press, 2014.
|
| [26] |
王鹤松, 何敏, 闫薇, 等. 基于遥感总初级生产力的天山-塔里木绿洲地区生态系统脆弱性研究[J]. 生态学报, 2021, 41(24): 9729-9737.
[
|
| [27] |
尤南山, 蒙吉军. 基于生态敏感性和生态系统服务的黑河中游生态功能区划与生态系统管理[J]. 中国沙漠, 2017, 37(1): 186-197.
[
|
| [28] |
|
| [29] |
於琍, 曹明奎, 陶波, 等. 基于潜在植被的中国陆地生态系统对气候变化的脆弱性定量评价[J]. 植物生态学报, 2008, 32(3): 521-530.
[
|
| [30] |
王劲峰, 徐成东. 地理探测器: 原理与展望[J]. 地理学报, 2017, 72(1): 116-134.
[
|
| [31] |
魏伟, 尹力. 东北地区“三区空间”格局演化特征及驱动机制[J]. 地理科学, 2023, 43(2): 324-336.
[
|
| [32] |
冯东梅, 夏郡, 张步林. 多尺度视角下基于MRSEI的东北地区生态环境质量时空演变及分区管控[J/OL]. 环境科学. [2025-07-22]. https://doi.org/10.13227/j.hjkx.202504177.
[
|
| [33] |
卞正富, 于昊辰, 侯竟, 等. 西部重点煤矿区土地退化的影响因素及其评估[J]. 煤炭学报, 2020, 45(1): 338-350.
[
|
| [34] |
袁婷婷, 王志强, 汪溪远, 等. 准东红沙泉矿区重金属生态风险缓冲区分析[J]. 土壤通报, 2020, 51(1): 227-233.
[
|
| [35] |
刘英, 许萍萍, 毕银丽, 等. 新疆戈壁煤矿露天开采对生态环境扰动定量分析[J]. 煤炭学报, 2023, 48(2): 959-974.
[
|
| [36] |
马丽莎, 郑江华, 彭建, 等. 新疆生态脆弱性特征及其驱动力[J]. 生态学报, 2024, 44(20): 9053-9066.
[
|
| [37] |
于昊辰, 陈浮, 尹登玉, 等. 采矿与气候变化对戈壁矿区土地生态系统的影响——以准东煤炭基地为例[J]. 煤炭学报, 2021, 46(8): 2650-2663.
[
|
| [38] |
|
| [39] |
|
| [40] |
徐勇, 孙晓一, 汤青. 陆地表层人类活动强度: 概念、方法及应用[J]. 地理学报, 2015, 70(7): 1068-1079.
[
|
| [41] |
李怡乐, 张乐艺, 李霞, 等. 基于改进遥感生态指数的粤港澳大湾区生态环境质量监测及驱动力分析[J/OL]. 环境科学. [2025-07-26]. https://doi.org/10.13227/j.hjkx.202504062.
[
|
| [42] |
李梦怡, 邓铭江, 凌红波, 等. 新疆绿洲格局变化与生态耗水结构分析[J]. 水科学进展, 2023, 34(5): 719-730.
[
|
| [43] |
刘芳, 仇韪, 夏楠, 等. 准东南煤炭资源地区土地利用转型及其对生态系统服务价值的影响[J]. 中国煤炭, 2024, 50(9): 144-153.
[
|
| [44] |
新疆维吾尔自治区发展和改革委员会. 新疆首个开发区生态环境保护条例施行[EB/OL]. [2025-07-29]. https://xjdrc.xinjiang.gov.cn/xjfgw/c108390/201911/ecef101606d946f7b4ce74d7ebc5155a.shtml.
[Development and Reform Commission of Xinjiang Uygur Autonomous Region. The first environmental protection regulation for development zones in Xinjiang is implemented[EB/OL]. [2025-07-29]. https://xjdrc.xinjiang.gov.cn/xjfgw/c108390/201911/ecef101606d946f7b4ce74d7ebc5155a.shtml.]
|
| [45] |
张俊杰, 白中科, 杨博宇. 新疆荒漠露天矿区生态受损及砾幕层重构方法研究[J]. 地学前缘, 2021, 28(4): 142-152.
[
|
| [46] |
|
/
| 〈 |
|
〉 |