
|
王思予(2000-),女,硕士研究生,主要从事水文水资源研究. E-mail: wangsiyu21064@163.com |
收稿日期: 2024-09-22
修回日期: 2024-12-30
网络出版日期: 2026-03-11
基金资助
国家重点研发计划——政府间国际科技创新合作项目(2022YFE0119400)
Spatial distribution characteristics and evaluation of surface water quality in western Mongolia in summer
Received date: 2024-09-22
Revised date: 2024-12-30
Online published: 2026-03-11
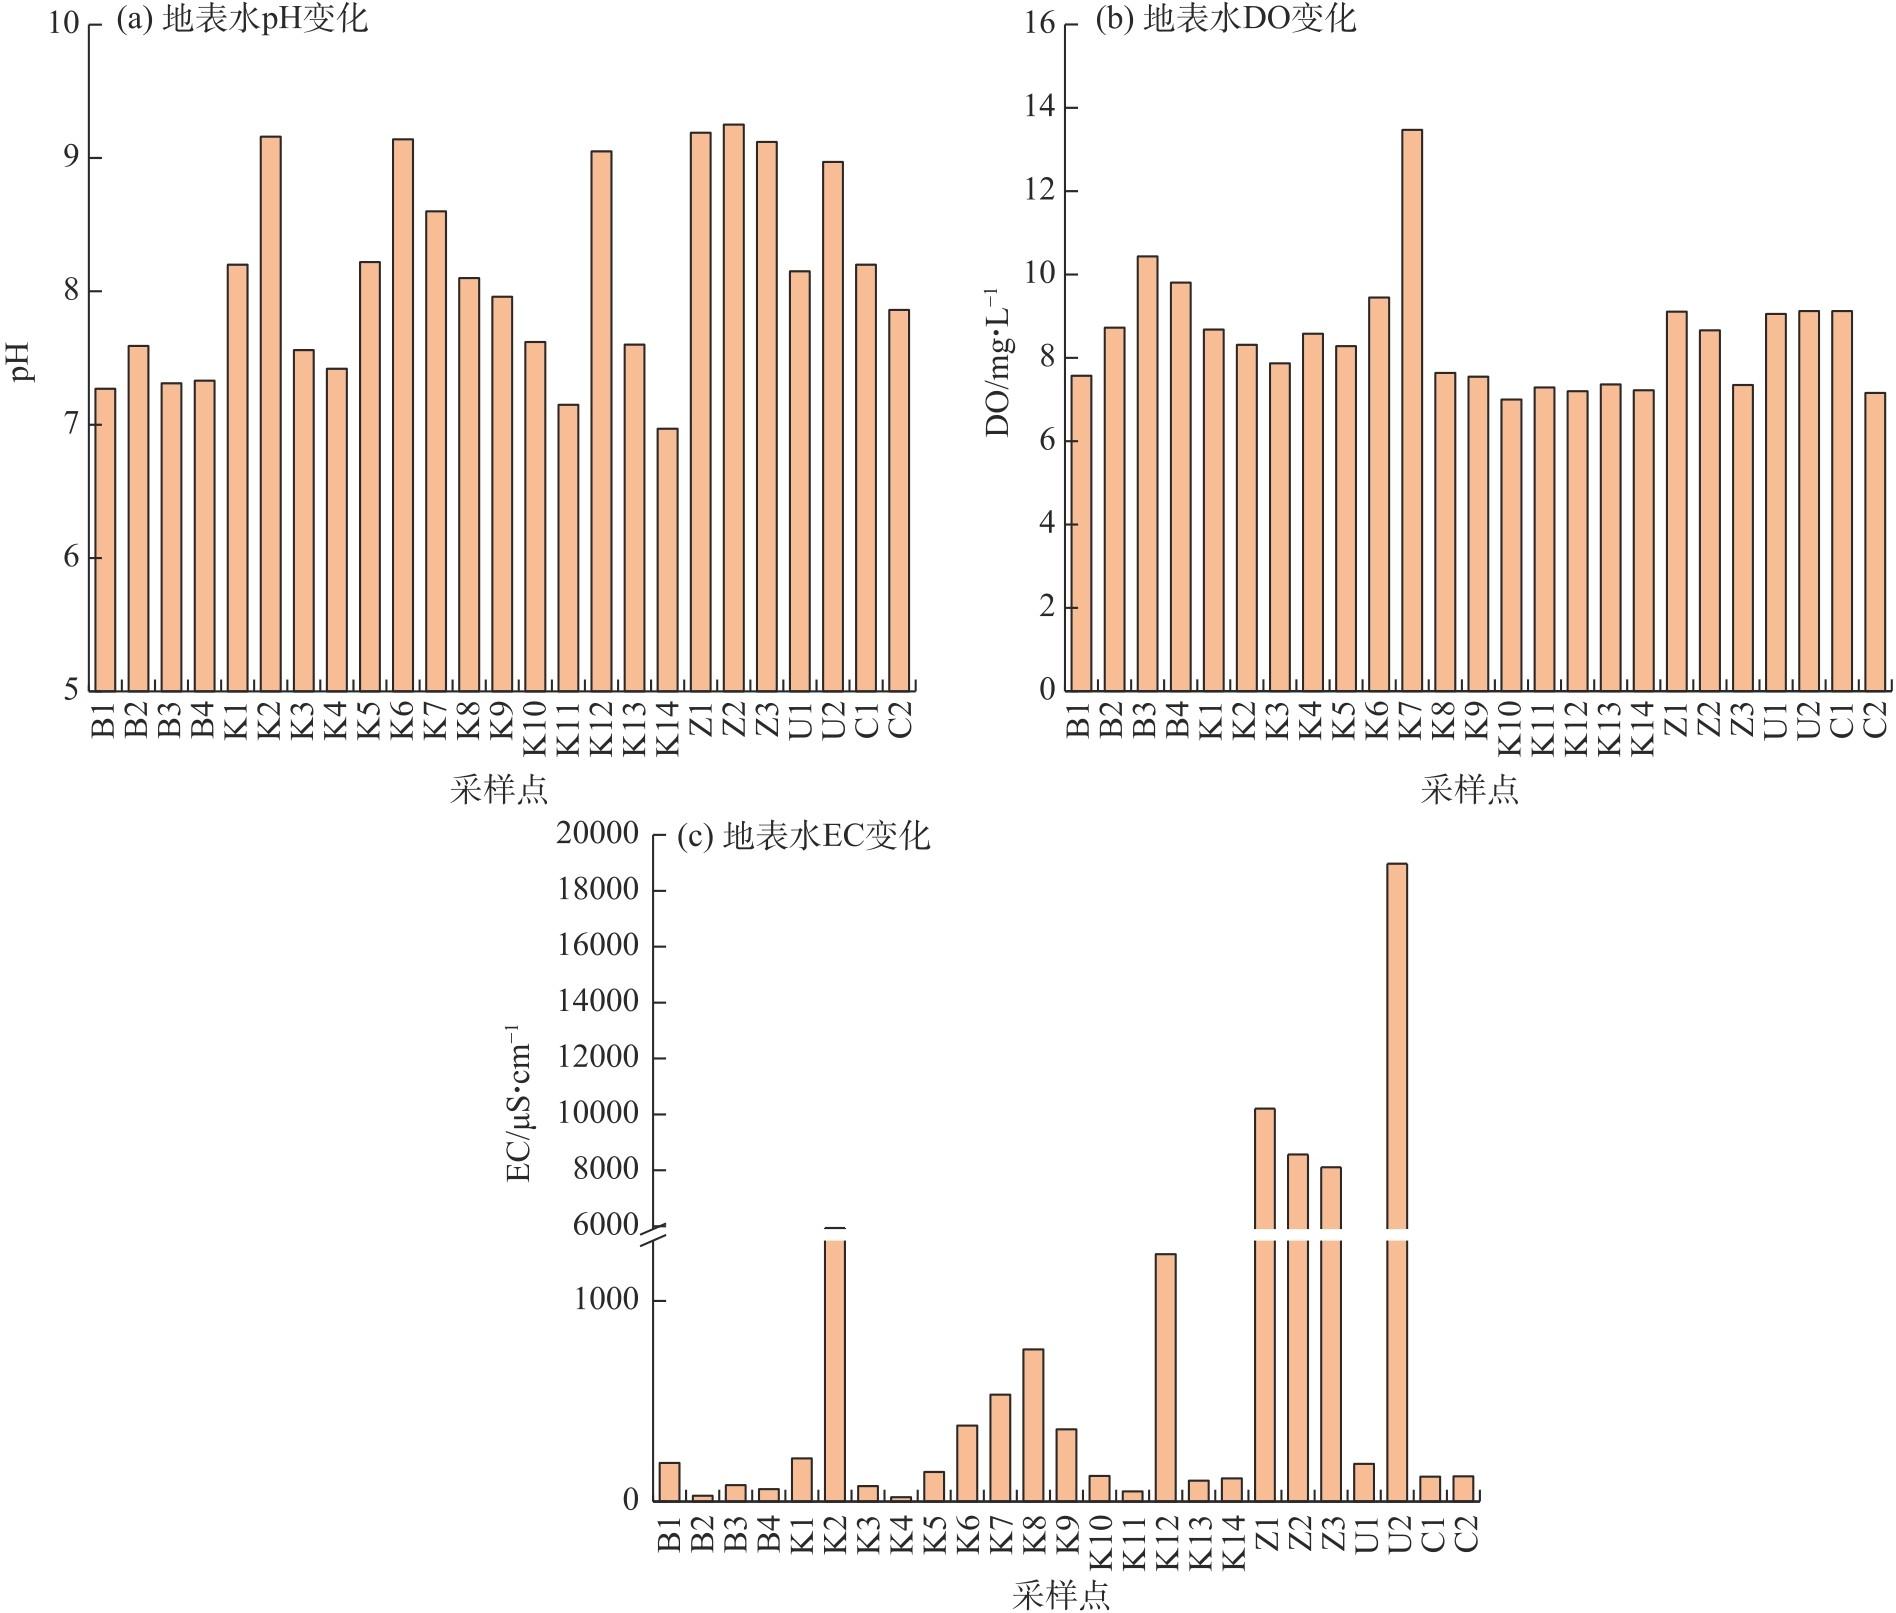
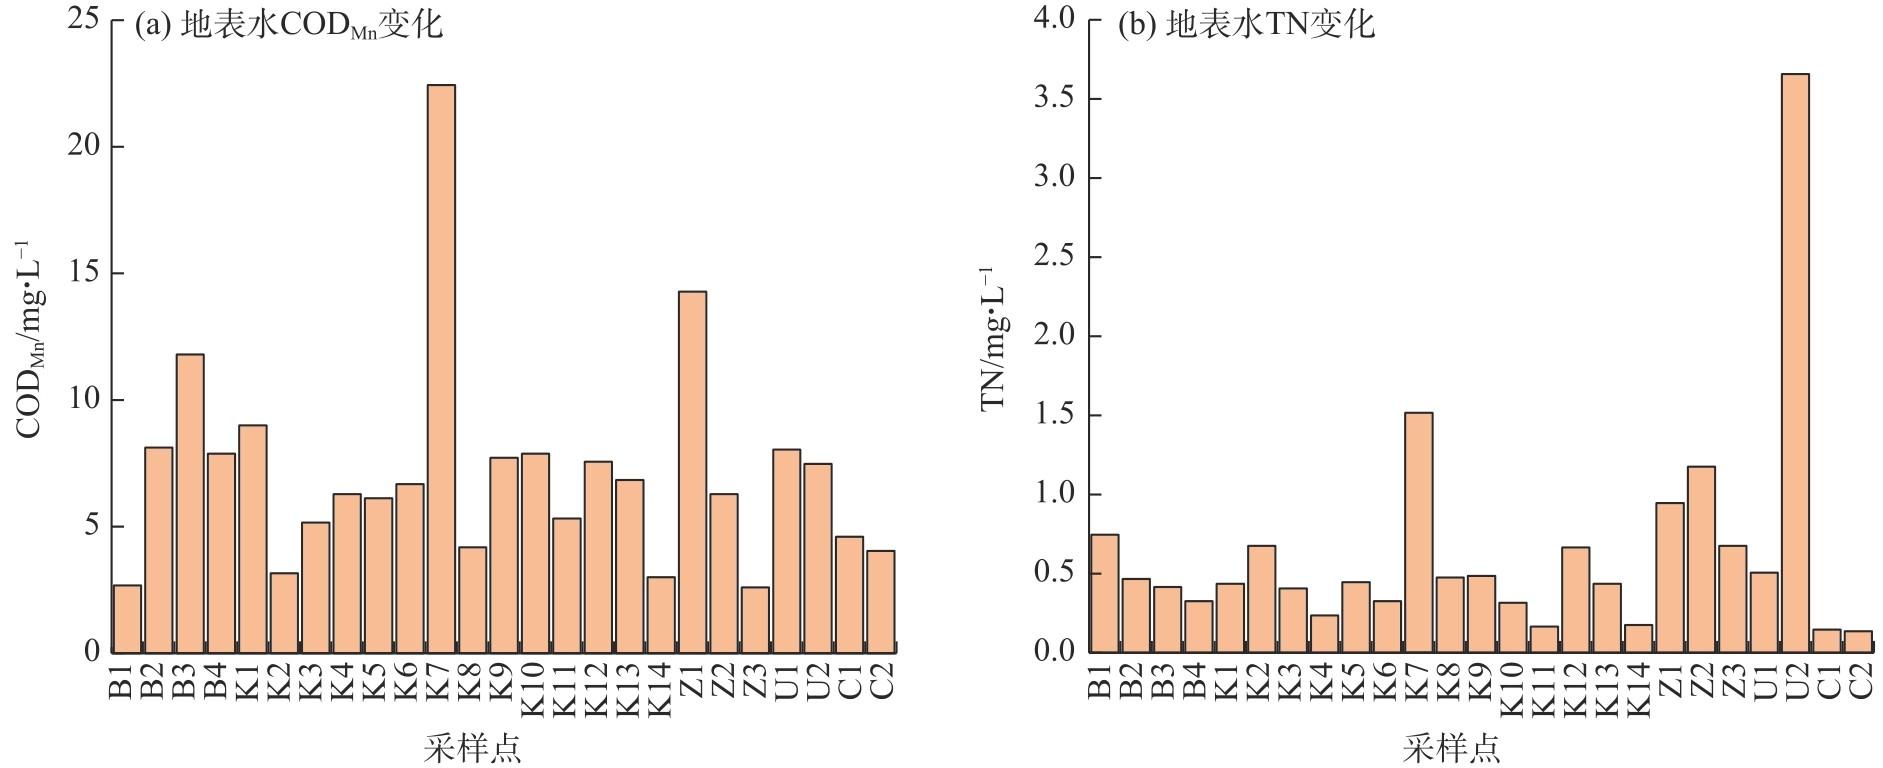
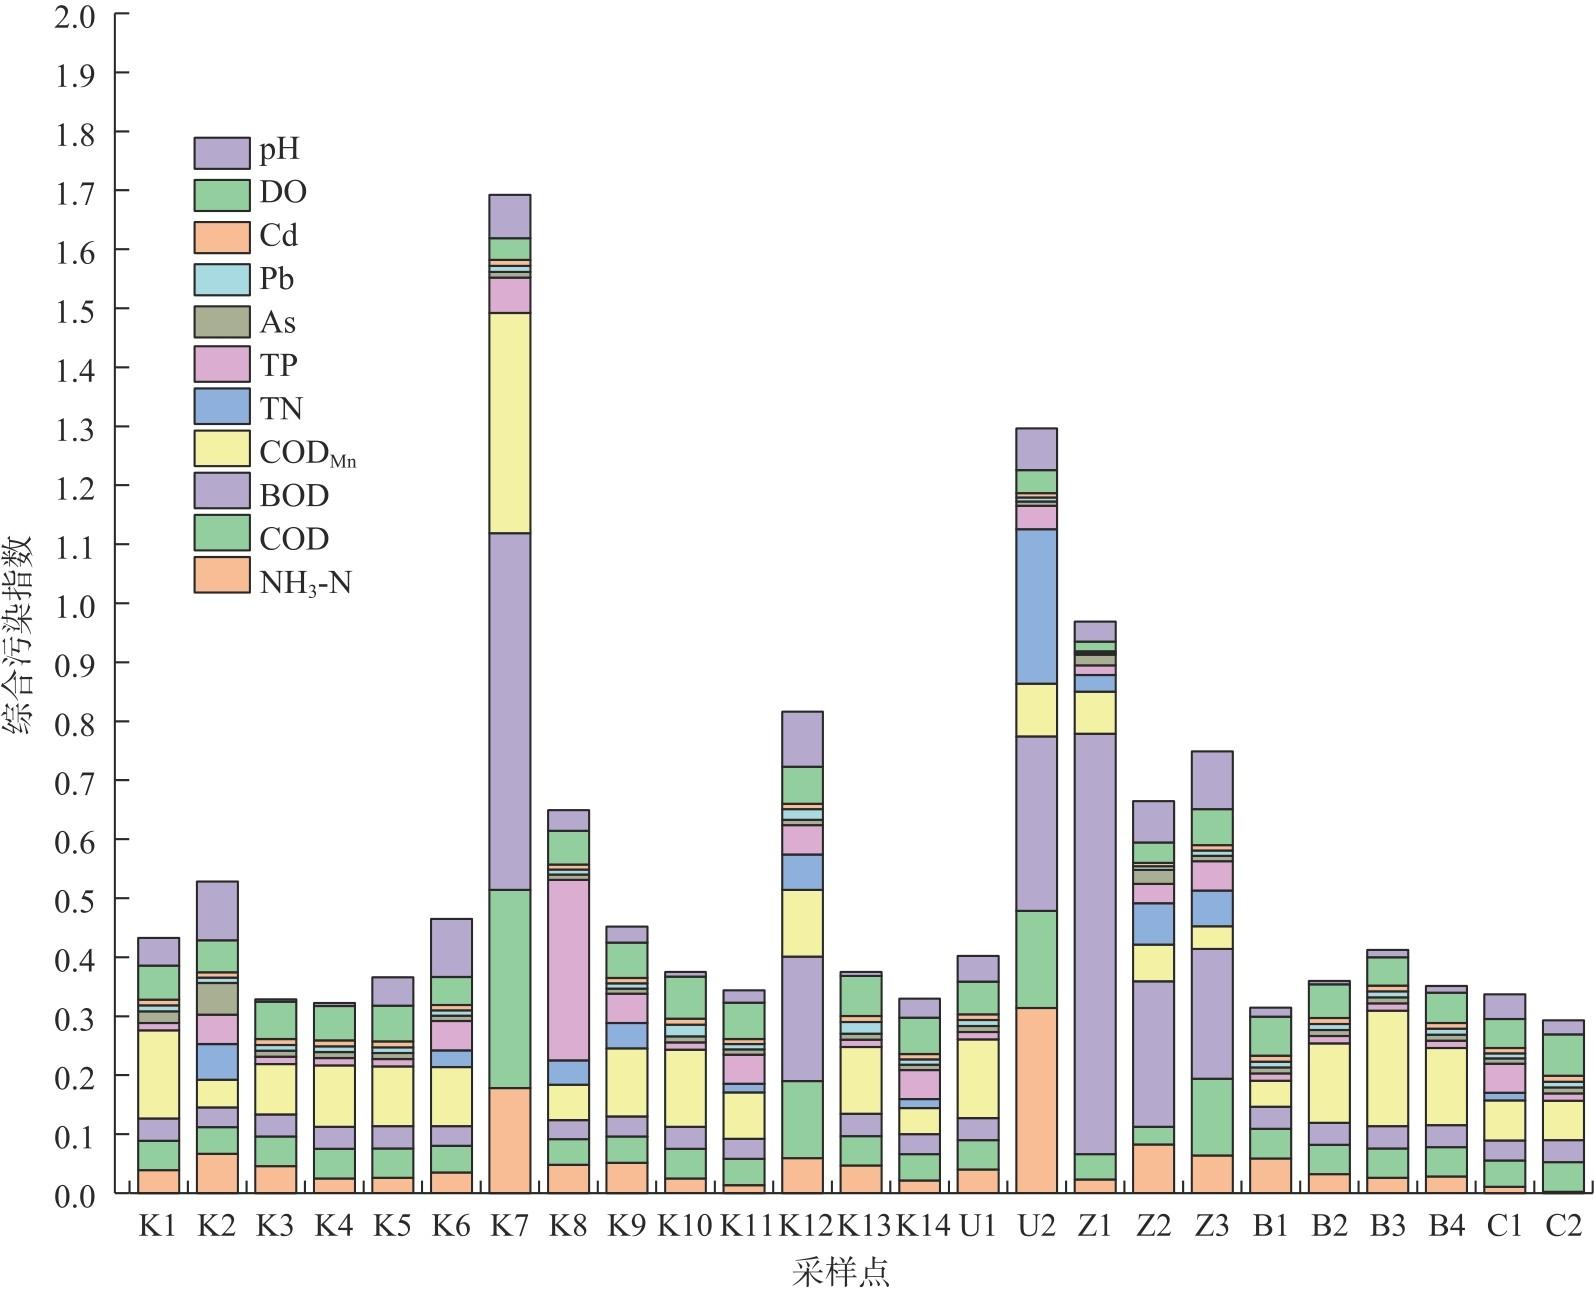
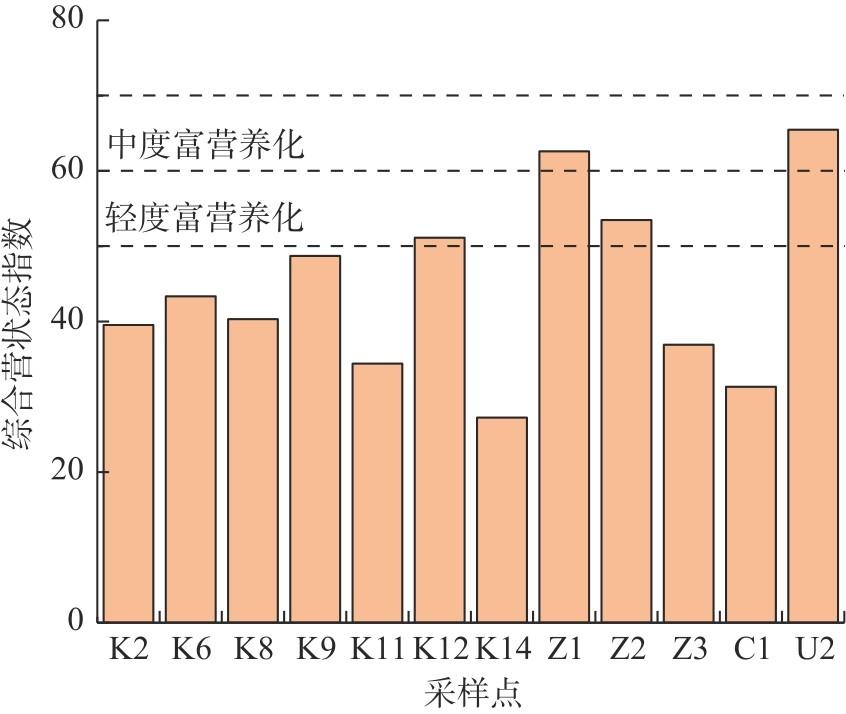
河流和湖泊水资源是人类生存与发展不可或缺的物质基础,其保护与可持续利用已成为全球关注的焦点。以蒙古国西部河流和湖泊为研究对象,以2023年夏季实地考察为基础对该地区水质受污染的情况进行了解和评估。通过对该地区水化学指标、重金属和综合性指标的测量,运用单因子评价法、综合污染指数法和综合营养状态指数等方法,对研究地区水质的变化特征进行分析和评价,为该地区的生态环境保护和社会经济发展奠定基础。结果表明:(1) 蒙古国西部的地表水水体呈碱性,不同指标具有空间差异,除了乌布苏湖、吉尔吉斯湖和科布多河下游,其余区域都符合世界、蒙古国和中国的相关水质标准。(2) 水体的主要污染指标为高锰酸盐指数和氨氮,有机物含量超标的原因主要与放牧活动和人类生活污水的排放有关。(3) 湖泊的营养状态存在显著空间差异,有严重富营养化区域,对于营养盐浓度较低的区域,富营养化风险较小,但仍需监控氮磷比变化。
王思予 , 周宏飞 , 闫英杰 , 杨松 , 苏媛 . 夏季蒙古国西部地表水水质空间分布特征及评价[J]. 干旱区地理, 2025 , 48(10) : 1783 -1792 . DOI: 10.12118/j.issn.1000-6060.2024.568
The water resources of rivers and lakes are essential for human survival and development, and their protection and sustainable use have become a global priority. In this study, rivers and lakes in western Mongolia were investigated through field surveys conducted in the summer of 2023 to evaluate water quality contamination. By measuring chemical parameters, heavy metals, and comprehensive indicators, the spatiotemporal variation in water quality was analyzed using the single-factor evaluation method, the comprehensive pollution index method, and the comprehensive trophic status index. The aim was to provide a scientific basis for ecological protection and the region's sustainable socio-economic development. The results showed that: (1) Surface waters in western Mongolia were alkaline, with spatial variations in different indicators. Except for Uvs Lake, Kyrgyz Lake, and the lower reaches of the Khovd River, the remaining areas complied with relevant water quality standards of the world, Mongolia, and China. (2) The main pollution indicators were the permanganate index and ammonia nitrogen, with excessive organic matter primarily linked to grazing activities and domestic sewage discharge. (3) Significant spatial differences in lake trophic status were observed, with some lakes exhibiting severe eutrophication. Although areas with low nutrient concentrations presented a relatively small risk of eutrophication, continuous monitoring of nitrogen-phosphorus ratios remains necessary.
Key words: water quality; water pollution indices; spatial variation; Mongolia
表1 蒙古国西部采样点位置Tab. 1 Sampling point locations in western Mongolia |
| 编号 | 经度/°E | 纬度/°N | 采样点名称 |
|---|---|---|---|
| K1 | 91.1625 | 46.1025 | 布尔干河 |
| K2 | 93.4347 | 47.5772 | 德勒湖 |
| K3 | 88.4059 | 49.0936 | 白河 |
| K4 | 88.0147 | 49.1539 | 白河 |
| K5 | 88.9003 | 49.2442 | 科布多河 |
| Z3 | 97.3831 | 48.8906 | 台勒门湖 |
| U1 | 92.0800 | 49.9792 | 台林河 |
| Z1 | 93.7850 | 49.1744 | 吉尔吉斯湖 |
| Z2 | 93.1150 | 49.3336 | 吉尔吉斯湖 |
| U2 | 92.3867 | 50.1206 | 乌布苏湖 |
| B1 | 91.3278 | 46.0867 | 布尔干河 |
| C1 | 99.6725 | 48.1364 | 车尔亥察干湖 |
| B2 | 91.5661 | 46.1625 | 布尔干河 |
| B3 | 91.4100 | 46.3408 | 布尔干河 |
| B4 | 91.3236 | 46.7700 | 布尔干河 |
| K6 | 93.0094 | 48.0397 | 哈尔湖 |
| K7 | 92.0222 | 47.8531 | 科布多河 |
| K8 | 92.7414 | 48.3283 | 哈尔乌苏湖 |
| K9 | 92.2206 | 48.3500 | 哈尔乌苏湖 |
| K10 | 91.9036 | 48.2436 | 科布多河 |
| C2 | 100.3179 | 48.0947 | 楚鲁特河 |
| K11 | 88.4133 | 48.5981 | 霍顿湖 |
| K12 | 89.9794 | 48.6367 | 托尔博湖 |
| K13 | 89.9628 | 48.9758 | 博多河 |
| K14 | 88.5478 | 48.5753 | 库尔干湖 |
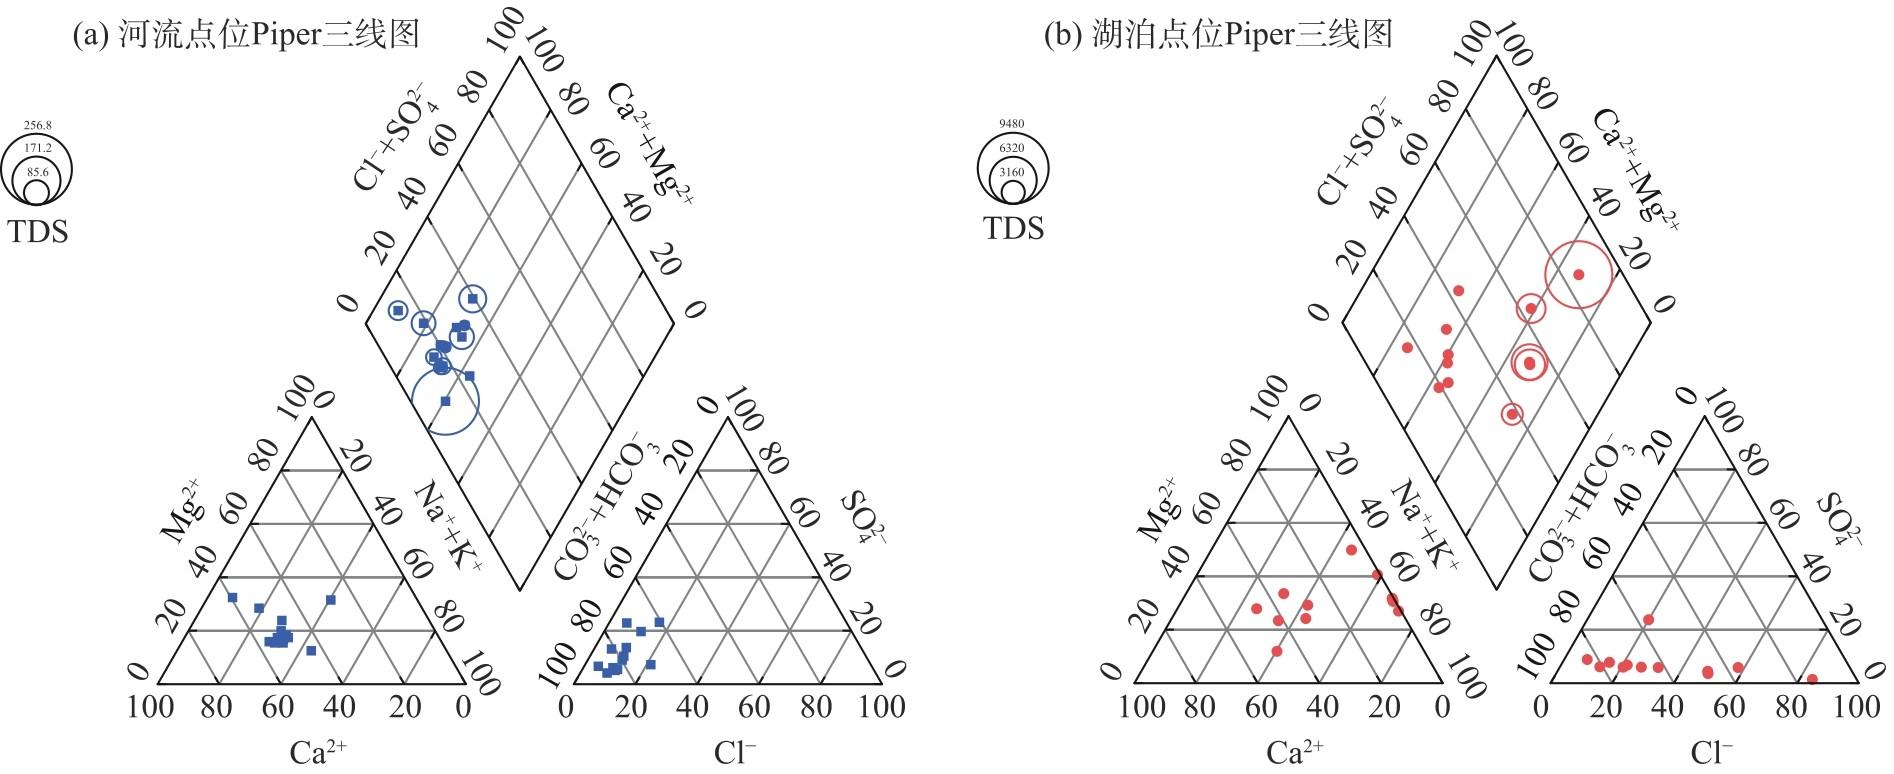
图2 研究区不同地表水样Piper图注:TDS为水中溶解的所有固体物质的总量。 Fig. 2 Piper diagrams of different surface water samples in the study area |
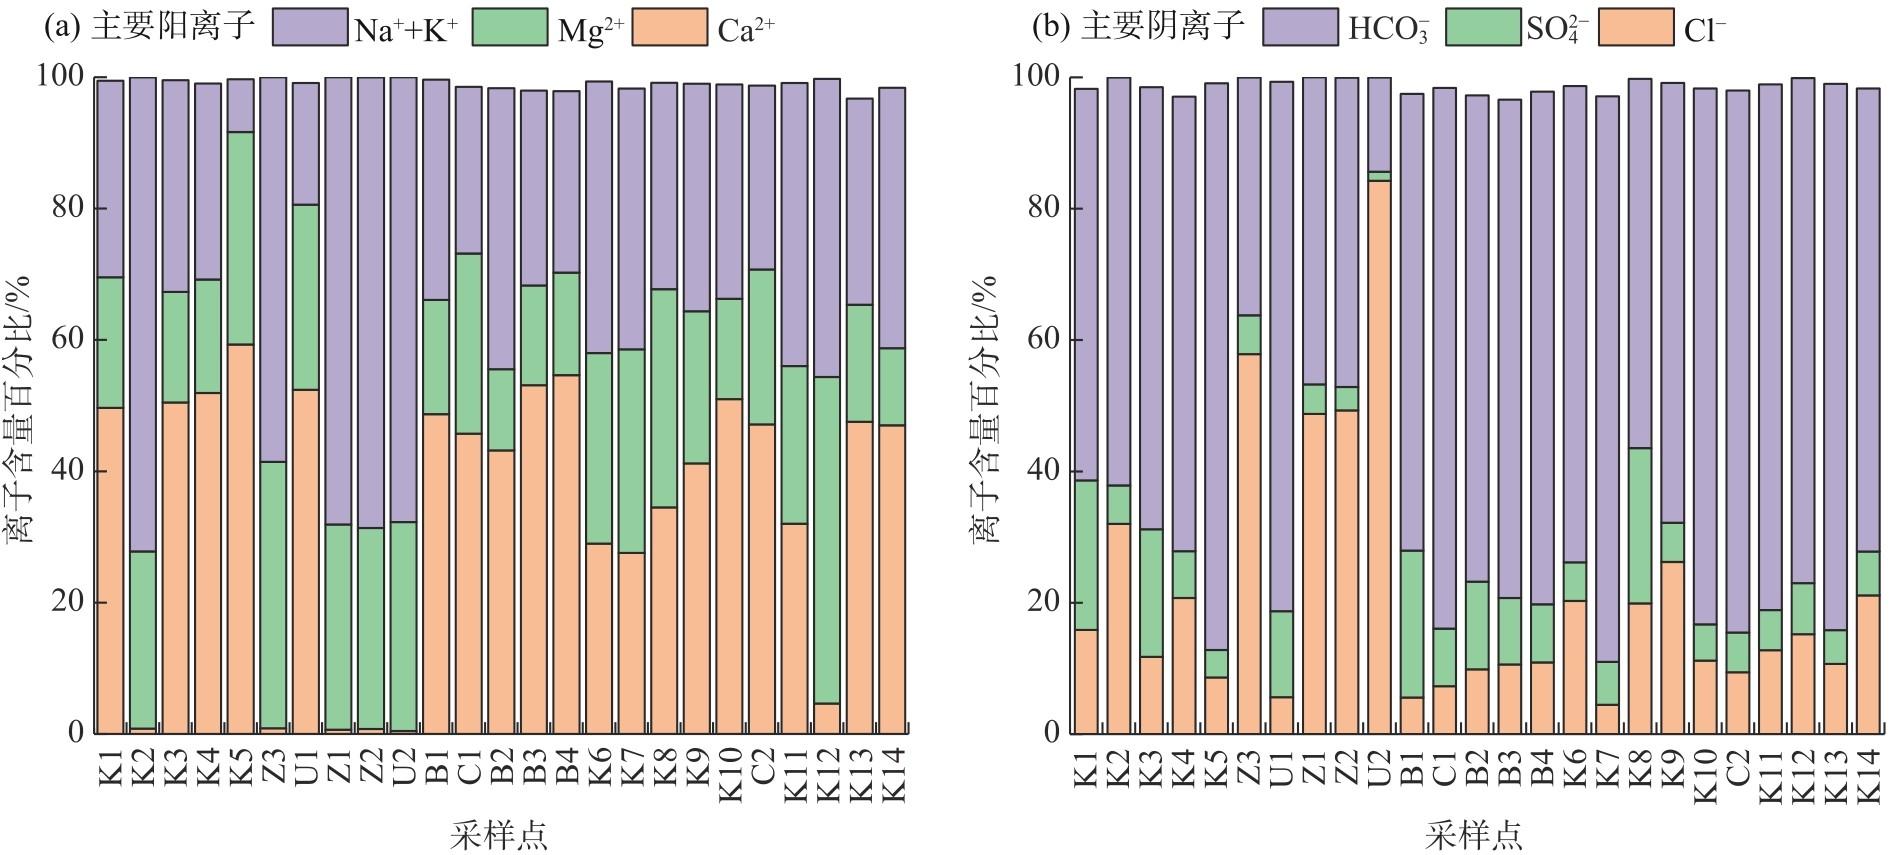
图3 研究区水样中的离子组成特征Fig. 3 Characteristics of ions composition in water samples in the study area |
表2 水样中常见理化指标浓度统计Tab. 2 Concentrations of common physical and chemical indicators in water samples |
| 统计指标 | 最大值 | 最小值 | 中位数 | WHO 2011 | 中国GB 3838-2002 | 蒙古国MNS 4586:1998 |
|---|---|---|---|---|---|---|
| DO/mg·L-1 | 13.47 | 7.00 | 8.31 | - | ≥2 | ≥6 |
| EC/μS·cm-1 | 18900.00 | 21.80 | 188.30 | - | - | - |
| pH | 9.25 | 6.97 | 8.10 | 6.5~9.2 | 6~9 | 6.5~8.5 |
| HCO3-/mg·L-1 | 1793.99 | 24.41 | 109.84 | - | - | - |
| Ca2+/mg·L-1 | 54.11 | 6.01 | 14.03 | - | - | - |
| Cl-/mg·L-1 | 4587.23 | 4.25 | 6.38 | 600 | 250 | 300 |
| Mg2+/mg·L-1 | 593.41 | 1.22 | 7.30 | - | - | - |
注:DO为溶解氧;EC为电导率。 |
表3 水样中的重金属含量以及WHO[24]、中国和蒙古国[25]的水质标准Tab. 3 Heavy metal contents in water samples and water quality standards of WHO[24], China and Mongolia[25]/μg·L-1 |
| 统计指标 | As | Cd | Pb | Ni | Mn | Fe |
|---|---|---|---|---|---|---|
| 最大值 | 30 | - | 10 | - | 70 | 180 |
| 最小值 | - | - | - | - | - | - |
| WHO 2011 | 10 | 3 | 10 | 70 | 400 | 300 |
| 中国GB 3838-2002 | 50 | 1 | 10 | 20 | 100 | 300 |
| 蒙古国MNS 4586:1998 | 10 | 5 | 10 | 10 | 100 | - |
图4 蒙古国西部不同水质综合指标变化注:CODMn为高锰酸盐指数;TN为总氮。下同。 Fig. 4 Changes in different water quality indicators in western Mongolia |
表4 水样中综合指标含量以及中国和蒙古国[22]水质标准Tab. 4 Comprehensive index contents in water samples and water quality standards of China and Mongolia[22]/mg·L-1 |
| 统计指标 | 最大值 | 最小值 | 中位数 | 中国 GB3838-2002 | 蒙古MNS 4586:1998 |
|---|---|---|---|---|---|
| TP | 0.16 | - | - | 0.4(湖、库0.2) | - |
| TN | 3.65 | 0.13 | 0.44 | 湖、库2.0 | - |
| CODMn | 22.40 | 2.56 | 6.64 | 15 | 10 |
| COD | 67.20 | - | - | 40 | - |
| BOD | 24.18 | - | - | 10 | - |
| NH3-N | 4.37 | 0.12 | 0.43 | 2.0 | 0.5 |
注:TP为总磷;TN为总氮;CODMn为高锰酸盐指数;COD为化学需氧量;BOD为生化需氧量;NH3-N为氨氮值。 |
| [1] |
胡广福. 浅议靖远县黄河水资源开发利用与管理[J]. 农业科技与信息, 2021(8): 16-18.
[
|
| [2] |
中华人民共和国水利部. 2021年中国水资源公报[M]. 北京: 中国水利水电出版社, 2022: 18-19.
[Ministry of Water Resources of the People's Republic of China. 2021 China water resources bulletin[M]. Beijing: China Water & Power Press, 2022: 18-19.]
|
| [3] |
吕娜, 郭梦京, 赵馨, 等. 内陆淡水湖博斯腾湖水质遥感反演及时空演变特征[J]. 干旱区地理, 2024, 47(6): 953-966.
[
|
| [4] |
|
| [5] |
|
| [6] |
曾翠红, 王岫嵩, 赵金鑫. 蒙古畜牧业的发展现状、困境与出路[J]. 世界农业, 2018(5): 24-30, 202.
[
|
| [7] |
|
| [8] |
|
| [9] |
|
| [10] |
|
| [11] |
|
| [12] |
|
| [13] |
胡格吉勒图. 蒙古国矿产资源开发现状及挑战因素分析[J]. 东北亚学刊, 2017(3): 26-33.
[
|
| [14] |
杨松, 周宏飞, 闫英杰. 1992—2021年蒙古国西部湖泊面积和数量变化特征[J]. 中国科学院大学学报, 2025, 42(2): 176-185.
[
|
| [15] |
超宝, 赵媛媛, 武海岩, 等. 2000—2020年蒙古高原生态系统服务及其对气候因子的响应[J]. 干旱区地理, 2024, 47(9): 1577-1586.
[
|
| [16] |
|
| [17] |
|
| [18] |
|
| [19] |
张小龙, 陈亚宁, 朱成刚, 等. 1986—2023年东昆仑库木库里盆地湖泊变化及成因分析[J]. 干旱区地理, 2024, 47(10): 1651-1661.
[
|
| [20] |
|
| [21] |
马兴, 胡万里, 邵德智, 等. 海河塘沽段水污染指数变化及其原因分析[J]. 水资源与水工程学报, 2008, 19(1): 69-72, 76.
[
|
| [22] |
王明翠, 刘雪芹, 张建辉. 湖泊富营养化评价方法及分级标准[J]. 中国环境监测, 2002, 18(5): 47-49.
[
|
| [23] |
|
| [24] |
|
| [25] |
World Health Organization. Guidelines for drinking-water quality: Fourth edition incorporating the first and second addenda[R]. Geneva: WHO, 2017.
|
| [26] |
MNS 4586: Mongolian national standard for water quality of the aquatic environment: General requirements[S]. Ulaanbaatar, Mongolian National Center of Standardization & Meterology, 1998.
|
| [27] |
|
| [28] |
|
| [29] |
|
| [30] |
|
| [31] |
|
/
| 〈 |
|
〉 |