
黑河下游胡杨林土壤碳空间分异特征及其影响因素
|
殷一丹(2000-),女,硕士研究生,主要从事干旱区碳循环方面的研究. E-mail: yinyidan@nieer.ac.cn |
收稿日期: 2024-02-28
修回日期: 2024-05-21
网络出版日期: 2026-03-11
基金资助
阿拉善盟科技计划项目(AMTM2022-2)
内蒙古自治区关键技术攻关项目(2020GG0306)
Spatial differentiation and its influencing factors of soil carbon in Populus euphratica Oliv. forest in the lower reach of Heihe River
Received date: 2024-02-28
Revised date: 2024-05-21
Online published: 2026-03-11
殷一丹 , 鱼腾飞 , 韩拓 , 谭天逸 , 陈小玲 . 黑河下游胡杨林土壤碳空间分异特征及其影响因素[J]. 干旱区地理, 2025 , 48(1) : 94 -104 . DOI: 10.12118/j.issn.1000-6060.2024.125
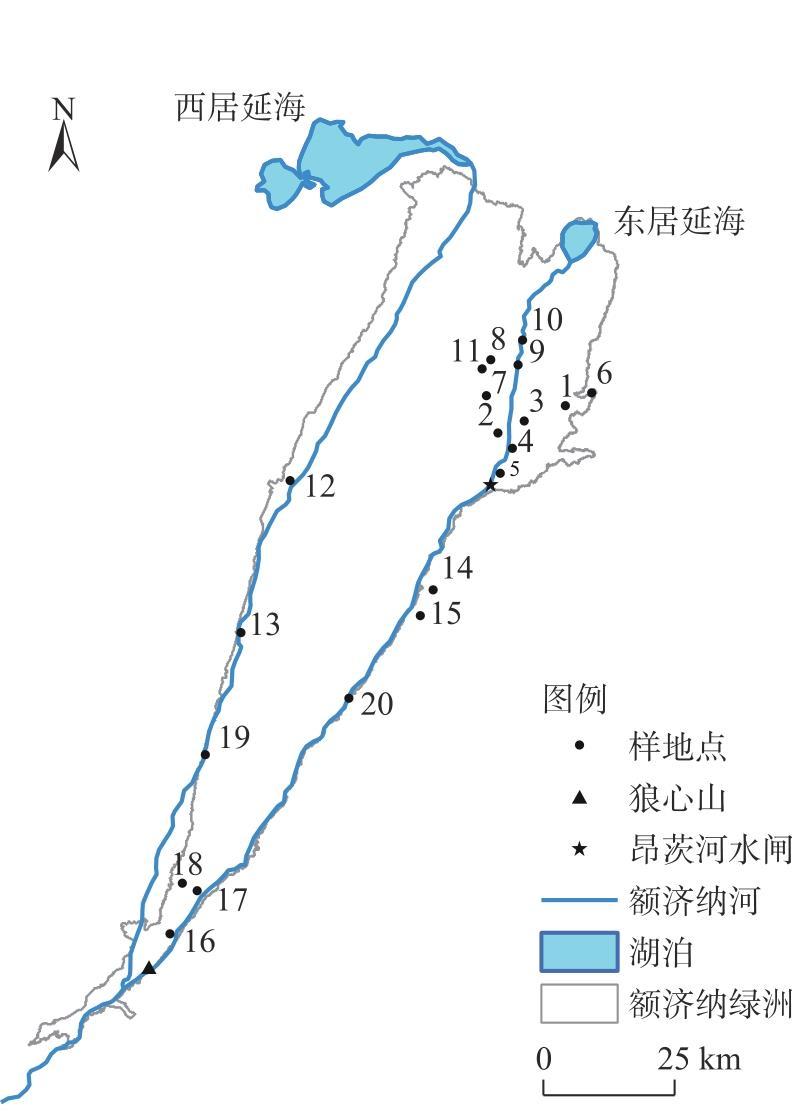
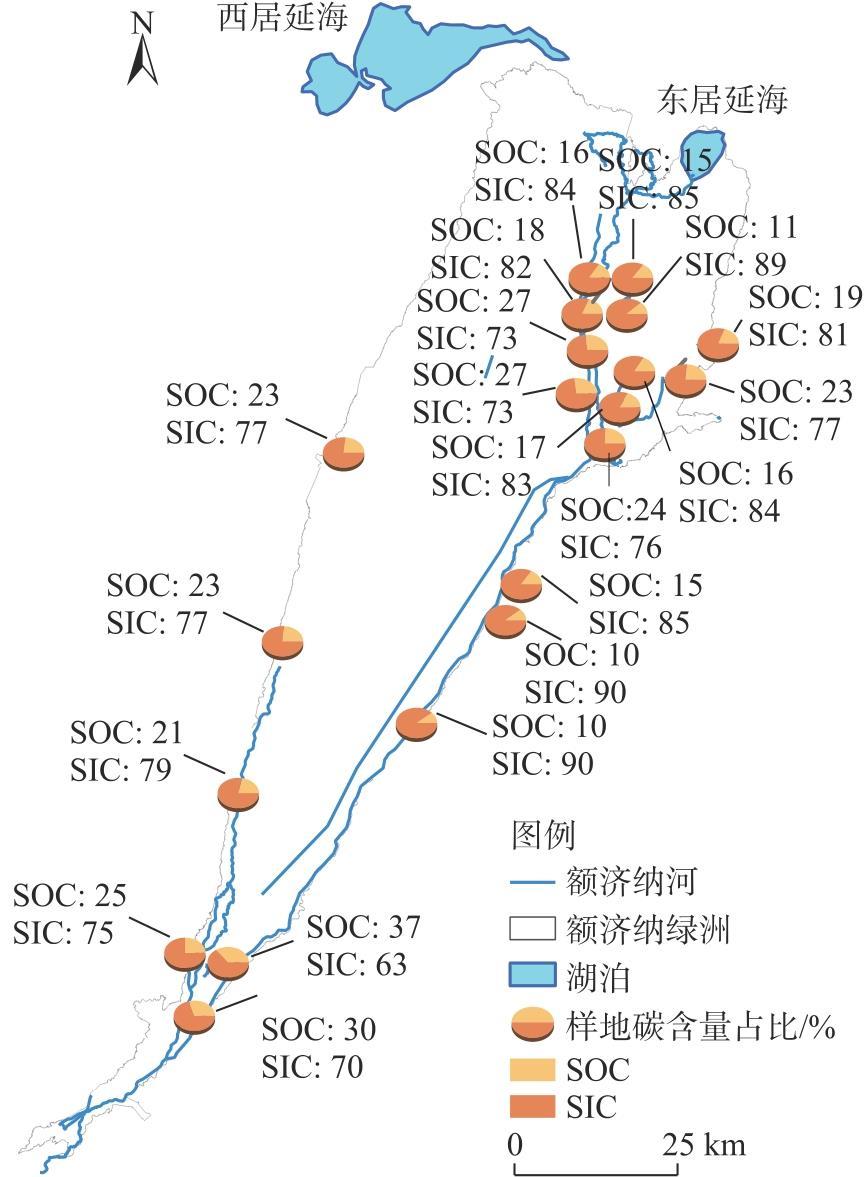
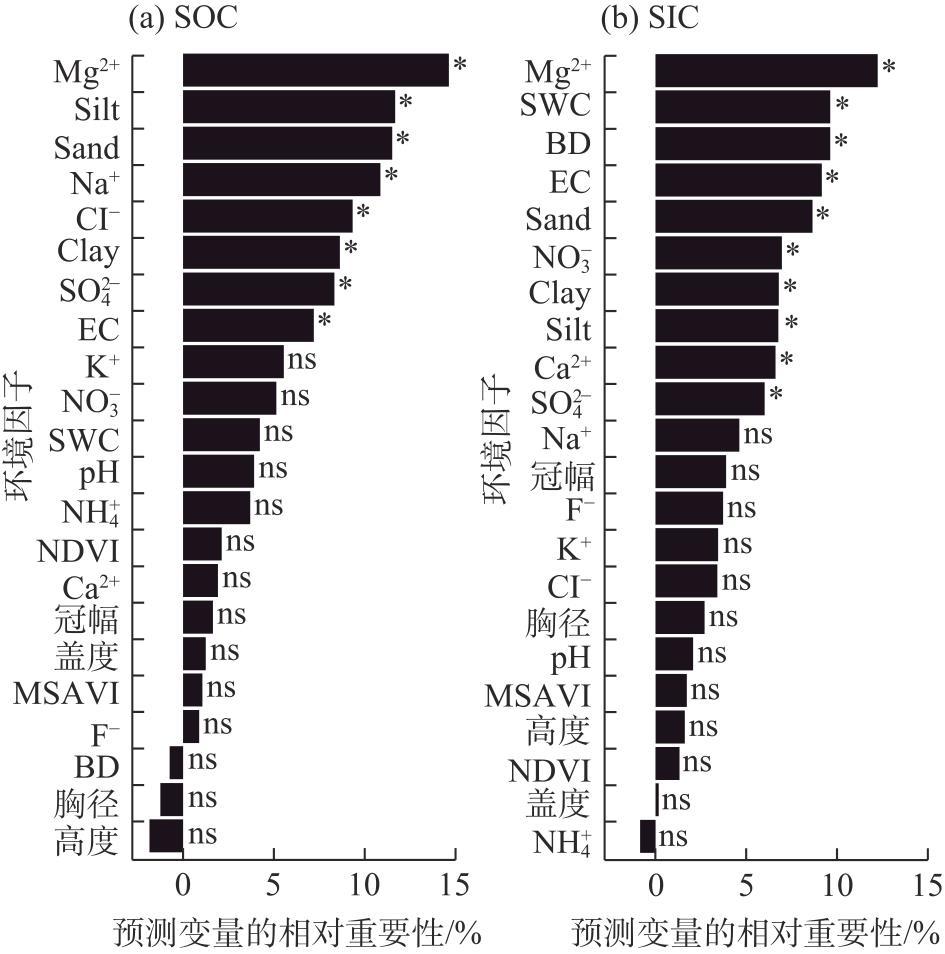
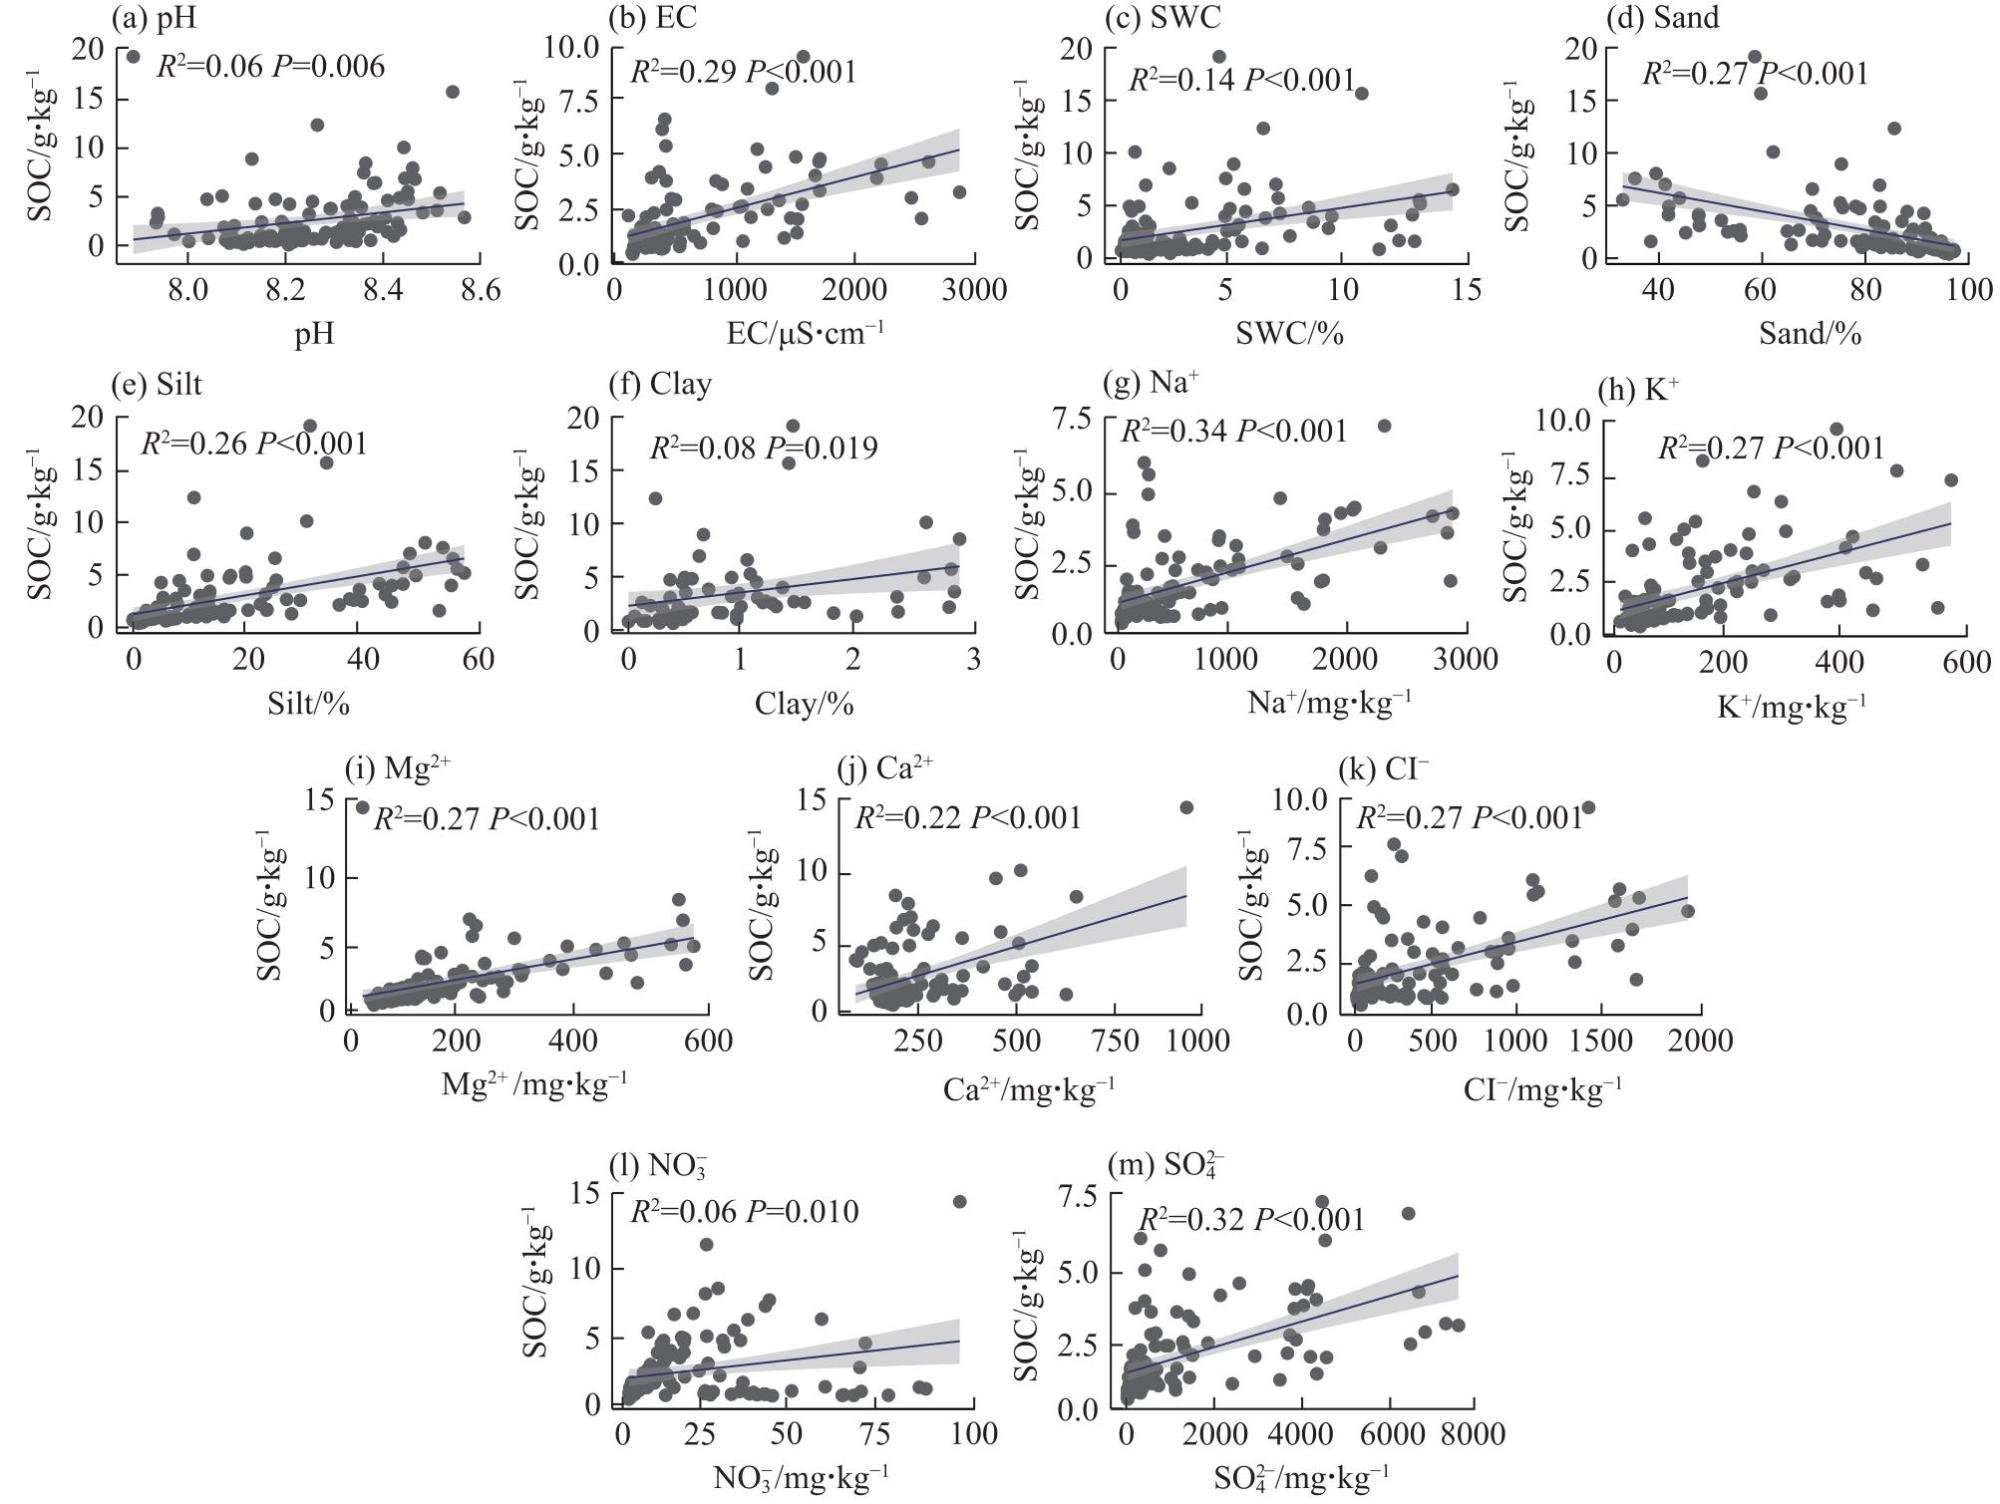
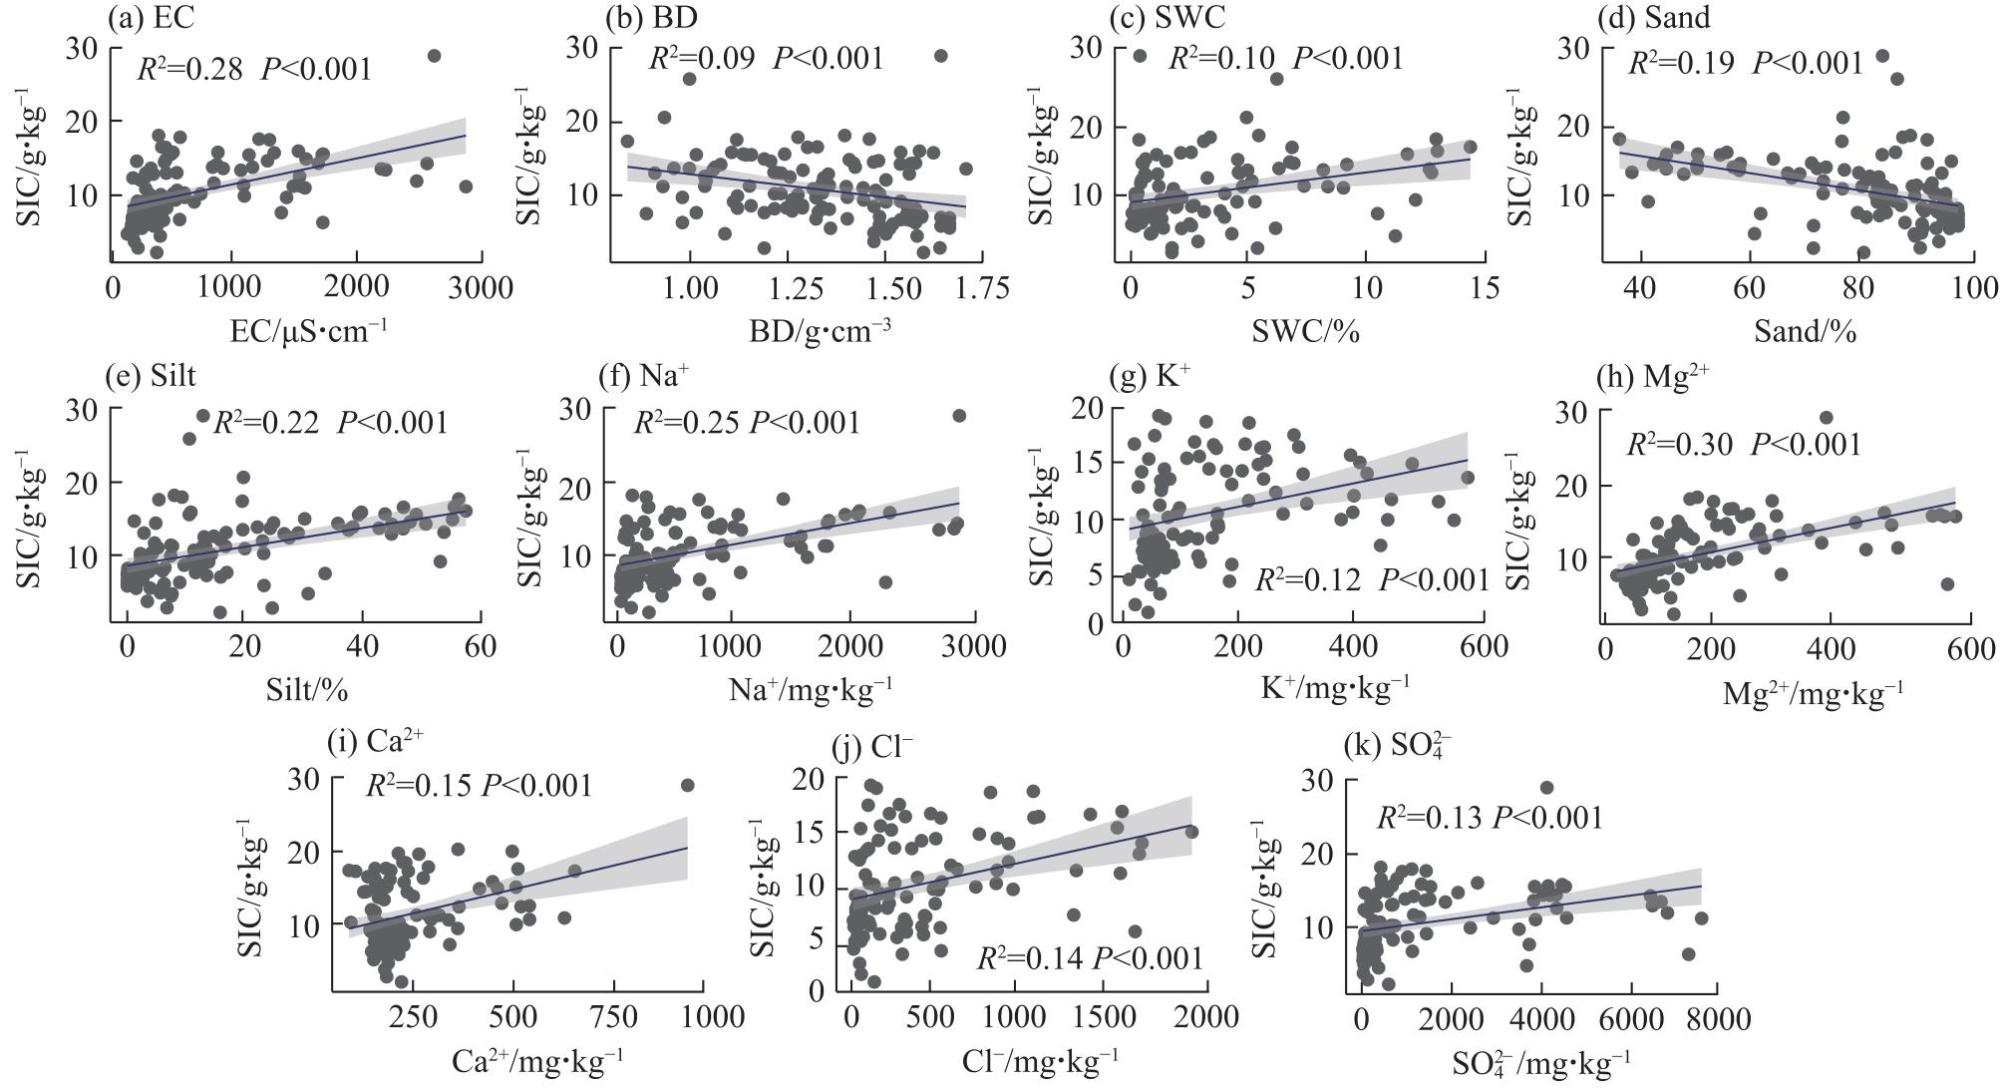
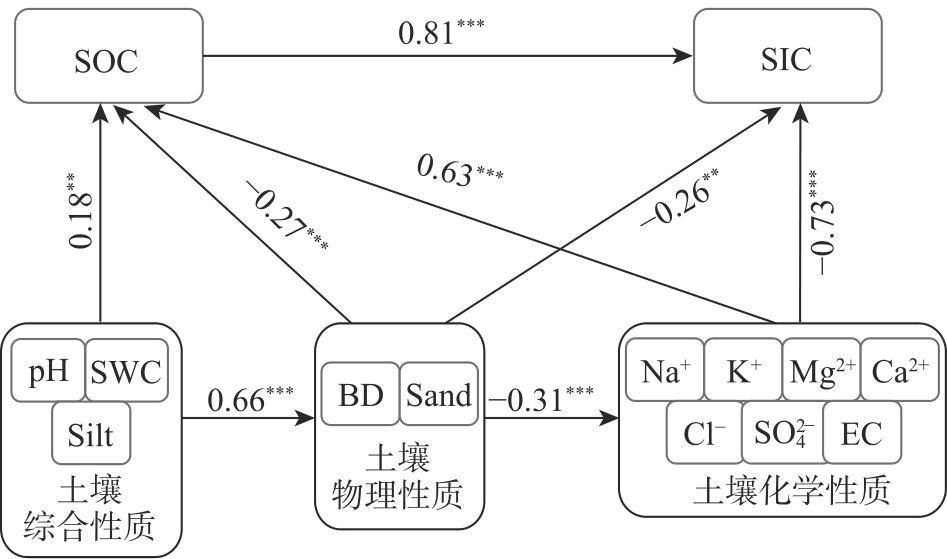
The distribution of soil carbon in desert riparian forests is shaped by multiple factors. This study examines the Ejina Oasis in the lower reaches of the Heihe River, China. Soil samples from 20 Populus euphratica Oliv. plots at depths of 0-100 cm were analyzed to investigate the spatial variation of soil organic carbon (SOC) and soil inorganic carbon (SIC) and their influencing factors. The results reveal: (1) The mean SOC and SIC contents in the 0-100 cm soil layer were 2.90 g·kg-1 and 10.79 g·kg-1, respectively, with SIC being 3.72 times of SOC. (2) Vertically, both SOC and SIC contents exhibited a declining trend with increasing soil depth, while horizontally, SOC and SIC from the upper to lower sections of East River of the Heihe River show a decreasing trend, but the total amount of SIC is still greater than SOC. This suggests that inorganic carbon predominates in the lower reaches of inland rivers in arid regions. (3) Soil physical and chemical properties showed a stronger explanatory power for SOC, whereas their influence on SIC was comparatively lower. Specifically, soil chemical properties such as electrical conductivity (EC), sodium ion (Na+), sulfate (SO42-), chloride ion (Cl-), calcium ion (Ca2+), magnesium ion (Mg2+), and potassium ion (K+) had the most significant influence on SOC. In conclusion, the soil carbon pool in desert riparian forests in the lower reaches of inland river basins in arid areas is predominantly composed of SIC, with notable spatial variations in both horizontal and vertical directions. Basic cations are identified as the primary factor influencing SOC spatial differentiation, while soil sand content and bulk density are the key factors affecting SIC spatial differentiation.
表1 0~100 cm土层土壤碳含量的垂直变化Tab. 1 Vertical variations of soil carbon content in soil layers from 0 to 100 cm |
| 深度/cm | SOC/g·kg-1 | SIC/g·kg-1 | SIC:SOC |
|---|---|---|---|
| 0~10 | 6.22±1.18a | 12.87±1.71a | 3.87±0.65a |
| 10~20 | 3.38±0.55b | 11.69±0.76a | 5.01±0.63ab |
| 20~40 | 2.28±0.29b | 10.89±0.75a | 5.80±0.52ac |
| 40~60 | 2.13±0.29b | 10.98±0.82a | 6.29±0.53ac |
| 60~80 | 1.93±0.45b | 9.11±1.05a | 6.77±0.65bc |
| 80~100 | 1.46±0.27b | 9.18±0.99a | 7.89±0.99c |
注:SOC为土壤有机碳;SIC为土壤无机碳;SIC:SOC为土壤无机碳与土壤有机碳的比值;表中数值为均值±标准误;不同小写字母表示不同土层间差异显著(P<0.05)。下同。 |
表2 不同区域0~100 cm土层土壤碳含量的空间变化Tab. 2 Spatial variations of soil carbon content in soil layers from 0 to 100 cm in different regions |
| 区域 | SOC/g·kg-1 | SIC/g·kg-1 | SIC:SOC |
|---|---|---|---|
| 西河干流河岸带 | 18.21±3.19a | 54.98±8.14a | 4.88±0.72a |
| 东河中上游河岸带 | 20.34±7.89a | 69.45±12.48a | 6.19±1.31a |
| 东河下游河岸带 | 17.39±2.46a | 70.61±3.87a | 6.17±0.55a |
| 东河下游绿洲核心区 | 13.66±2.74a | 63.87±5.09a | 6.52±0.35a |
注:不同小写字母表示不同区域间差异显著(P<0.05)。下同。 |
表3 0~100 cm土层土壤环境因子的垂直变化Tab. 3 Vertical changes of soil environmental factors in soil layers from 0 to 100 cm |
| 深度 /cm | SWC /% | EC /μS·cm-1 | BD /g·cm-3 | Clay /% | Silt /% | Sand /% | pH | Na+ /mg·kg-1 | K+ /mg·kg-1 | Mg2+ /mg·kg-1 | Ca2+ /mg·kg-1 | Cl- /mg·kg-1 | SO42- /mg·kg-1 | NO3- /mg·kg-1 | NH4+ /mg·kg-1 | F- /mg·kg-1 |
|---|---|---|---|---|---|---|---|---|---|---|---|---|---|---|---|---|
| 0~10 | 2.67a | 6565.01a | 1.20a | 0.94a | 16.39a | 82.34a | 8.26a | 12661.18a | 2054.27a | 2437.60a | 2557.03a | 15192.84a | 36185.14a | 68.89a | 26.24a | 3.26a |
| 10~20 | 4.05a | 1673.37b | 1.33a | 1.24a | 21.31a | 77.41a | 8.26a | 2201.89b | 440.93a | 512.98ab | 716.86b | 2369.10ab | 3790.51b | 308.73a | 2.69b | 2.01a |
| 20~40 | 4.81a | 864.35b | 1.34ab | 0.93a | 19.37a | 79.70a | 8.32a | 862.98b | 219.97a | 234.56b | 448.77b | 735.14b | 1682.19b | 126.49a | 1.91b | 2.27a |
| 40~60 | 6.08a | 668.27b | 1.35ab | 1.28a | 23.51a | 75.21a | 8.29a | 597.67b | 166.50a | 165.39b | 270.33b | 522.72b | 870.95b | 75.26a | 1.44b | 1.86a |
| 60~80 | 4.24a | 511.39b | 1.43ab | 1.12a | 17.20a | 81.68a | 8.25a | 461.83b | 128.85a | 158.42b | 208.77b | 373.32b | 691.78b | 40.03a | 1.65b | 2.28a |
| 80~100 | 4.41a | 549.81b | 1.40b | 0.65a | 12.18a | 87.09a | 8.26a | 476.96b | 94.68a | 174.27b | 234.79b | 411.50b | 725.31b | 33.74a | 1.41b | 2.31a |
注:SWC为土壤含水量;EC为土壤电导率;BD为土壤容重;Clay为土壤黏粒;Silt为土壤粉粒;Sand为土壤砂粒。下同。 |
表4 不同区域0~100 cm土层土壤环境因子的水平变化Tab. 4 Horizontal changes of soil environmental factors in soil layers from 0 to 100 cm in different regions |
| 区域 | SWC /% | EC /μS·cm-1 | BD /g·cm-3 | Clay /% | Silt /% | Sand /% | pH | Na+ /mg·kg-1 | K+ /mg·kg-1 | Mg2+ /mg·kg-1 | Ca2+ /mg·kg-1 | Cl- /mg·kg-1 | SO42- /mg·kg-1 | NO3- /mg·kg-1 | NH4+ /mg·kg-1 | F- /mg·kg-1 |
|---|---|---|---|---|---|---|---|---|---|---|---|---|---|---|---|---|
| 西河干流 河岸带 | 3.41a | 1643.04 a | 1.47a | 0.99a | 17.81a | 81.17a | 8.30a | 12837.45a | 1392.28a | 3782.32a | 4970.43a | 9943.69a | 28759.40a | 175.53a | 25.49a | 19.01a |
| 东河中上 游河岸带 | 5.30a | 3059.05 a | 1.45a | 1.30a | 21.88a | 76.64a | 8.25a | 34032.60a | 2746.63a | 7250.30a | 3711.86a | 28250.52a | 56831.60a | 1523.25a | 9.09a | 15.54a |
| 东河下游 河岸带 | 4.40a | 2063.75 a | 1.12b | 0.84a | 19.14a | 79.94a | 8.25a | 20224.23a | 7124.88a | 2839.65a | 7440.17a | 38355.39a | 86618.00a | 404.57a | 42.15a | 7.41a |
| 东河下 游绿洲 核心区 | 4.40a | 455.63 a | 1.33ab | 0.98a | 14.48a | 84.54a | 8.29a | 1955.77a | 1157.02a | 860.60a | 1623.78a | 1868.88a | 3574.50a | 509.24a | 5.49a | 5.12a |
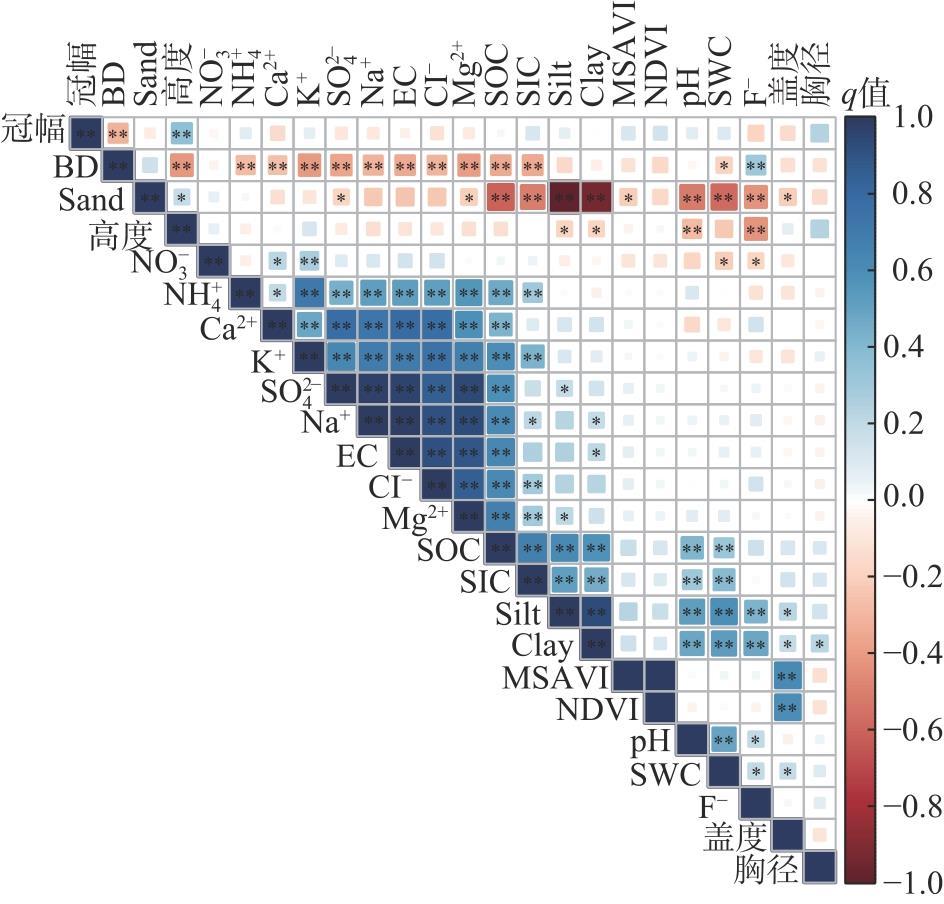
图3 SOC、SIC与环境因子之间的相关关系注:SWC为土壤含水量;EC为土壤电导率;BD为土壤容重;Clay为土壤黏粒;Silt为土壤粉粒;Sand为土壤砂粒;NDVI为归一化植被指数;MSAVI为土壤调整植被指数;q值为SOC、SIC与环境因子之间的相关程度;*、**分别表示在P<0.1、P<0.05水平上显著。下同。 Fig. 3 Correlation between SOC, SIC and environmental factors |
表5 环境因子组合对SOC、SIC的解释程度Tab. 5 Interpretation degree of SOC and SIC by combination of environmental factors |
| 环境因子组合 | SOC | SIC |
|---|---|---|
| 土壤综合性质 | 0.02 | 0.01 |
| 土壤物理性质 | 0.04 | 0.10 |
| 土壤化学性质 | 0.37 | 0.03 |
| 土壤综合性质×土壤物理性质 | 0.06 | 0.11 |
| 土壤综合性质×土壤化学性质 | -0.01 | 0.01 |
| 土壤物理性质×土壤化学性质 | 0.07 | -0.02 |
| 土壤综合性质×土壤物理性质×土壤化学性质 | 0.02 | -0.01 |
| 残差项 | 0.28 | 0.68 |
注:残差项为不能解释的部分。 |
| [1] |
高晓宇, 郝海超, 张雪琪, 等. 中国西北干旱区植被水分利用效率变化对气象要素的响应—以新疆为例[J]. 干旱区地理, 2023, 46(7): 1111-1120.
[
|
| [2] |
|
| [3] |
杨玉海, 李卫红, 李慧敏, 等. 塔里木河下游退化生态系统恢复对土壤有机碳的影响[J]. 土壤通报, 2010, 41(4): 855-859.
[
|
| [4] |
马继龙, 史军辉, 王新英, 等. 洪水漫溢对塔里木河中游河岸胡杨林土壤有机碳及活性组分的影响[J]. 干旱区研究, 2023, 40(8): 1248-1257.
[
|
| [5] |
史尧方, 薛娴, 尤全刚, 等. 阿里荒漠区土壤有机碳分布特征及其与土壤物理性质的关系[J]. 中国沙漠, 2023, 43(3): 284-294.
[
|
| [6] |
|
| [7] |
|
| [8] |
|
| [9] |
|
| [10] |
|
| [11] |
|
| [12] |
|
| [13] |
|
| [14] |
韩路, 冯宇, 李沅楷, 等. 地下水埋深对灰胡杨叶片与土壤养分生态化学计量特征及其内稳态的影响[J]. 植物生态学报, 2024, 48(1): 92-102.
[
|
| [15] |
王振, 李均力, 张久丹, 等. 输水漫溢对塔里木河中游胡杨林恢复的影响[J]. 干旱区地理, 2023, 46(1): 94-102.
[
|
| [16] |
|
| [17] |
|
| [18] |
|
| [19] |
陈雨晴, 席海洋, 程文举, 等. 荒漠河岸林区3种典型植物群落下土壤碳氮含量特征[J]. 中国沙漠, 2023, 43(1): 150-159.
[
|
| [20] |
|
| [21] |
张甘霖, 龚子同. 土壤调查实验室分析方法[M]. 北京: 科学出版社, 2011: 47-70.
[
|
| [22] |
鲍士旦. 土壤农化分析[M]. 北京: 中国农业出版社, 2000: 120-147.
[
|
| [23] |
贡璐, 朱美玲, 刘曾媛, 等. 塔里木盆地南缘典型绿洲土壤有机碳、无机碳与环境因子的相关性[J]. 环境科学, 2016, 37(4): 1516-1522.
[
|
| [24] |
杨洋, 张心昱, 苏文, 等. 新疆农田和荒漠生态系统土壤有机碳储量及影响因素分析[J]. 生态学报, 2024, 44(14): 1-12.
[
|
| [25] |
侯浩, 张宋智, 关晋宏, 等. 小陇山不同林龄锐齿栎林土壤有机碳和全氮积累特征[J]. 生态学报, 2016, 36(24): 8025-8033.
[
|
| [26] |
雒琼, 王玉刚, 邓彩云, 等. 干旱区土壤剖面无机碳分布及其与盐碱性的关系[J]. 水土保持学报, 2017, 31(5): 240-246.
[
|
| [27] |
张宇恒, 刘春, 付智勇, 等. 坡面水文过程与土壤有机碳迁移研究进展[J]. 土壤通报, 2023, 54(3): 730-738.
[
|
| [28] |
|
| [29] |
|
| [30] |
|
| [31] |
|
| [32] |
|
| [33] |
|
| [34] |
|
| [35] |
|
| [36] |
|
/
| 〈 |
|
〉 |