
2000—2020年兰州市人口时空格局演变及驱动因素分析
|
马晓敏(1997-),女,博士研究生,主要从事城市与区域规划研究. E-mail: mxm202009@163.com |
收稿日期: 2024-02-20
修回日期: 2024-04-02
网络出版日期: 2026-03-11
基金资助
国家自然科学基金项目(41961029)
Spatial and temporal evolution and driving factors of population in Lanzhou City from 2000 to 2020
Received date: 2024-02-20
Revised date: 2024-04-02
Online published: 2026-03-11
马晓敏 , 张志斌 , 郭倩倩 , 赵学伟 , 张宁 . 2000—2020年兰州市人口时空格局演变及驱动因素分析[J]. 干旱区地理, 2025 , 48(1) : 168 -178 . DOI: 10.12118/j.issn.1000-6060.2024.099
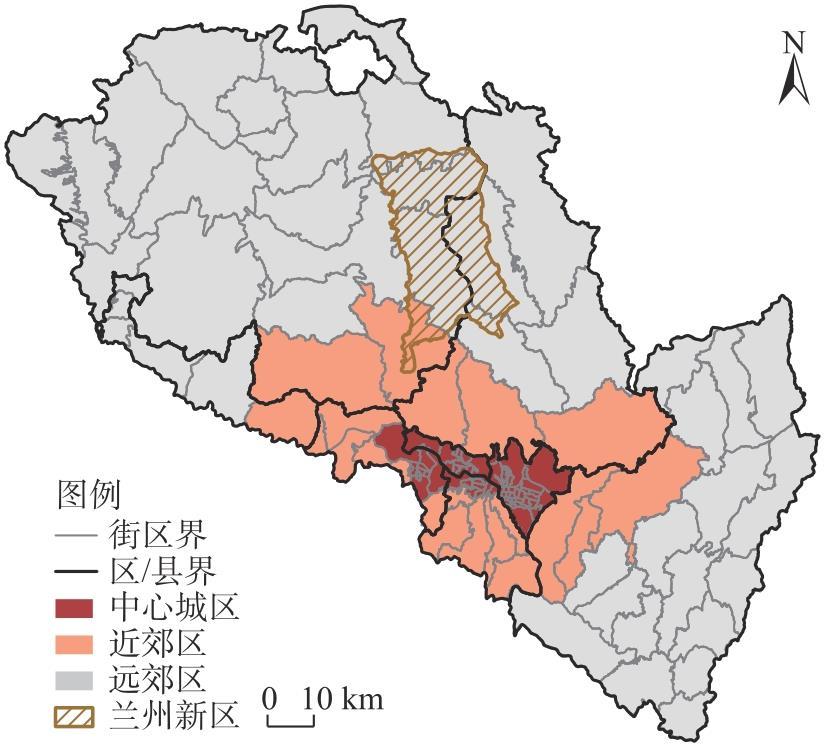
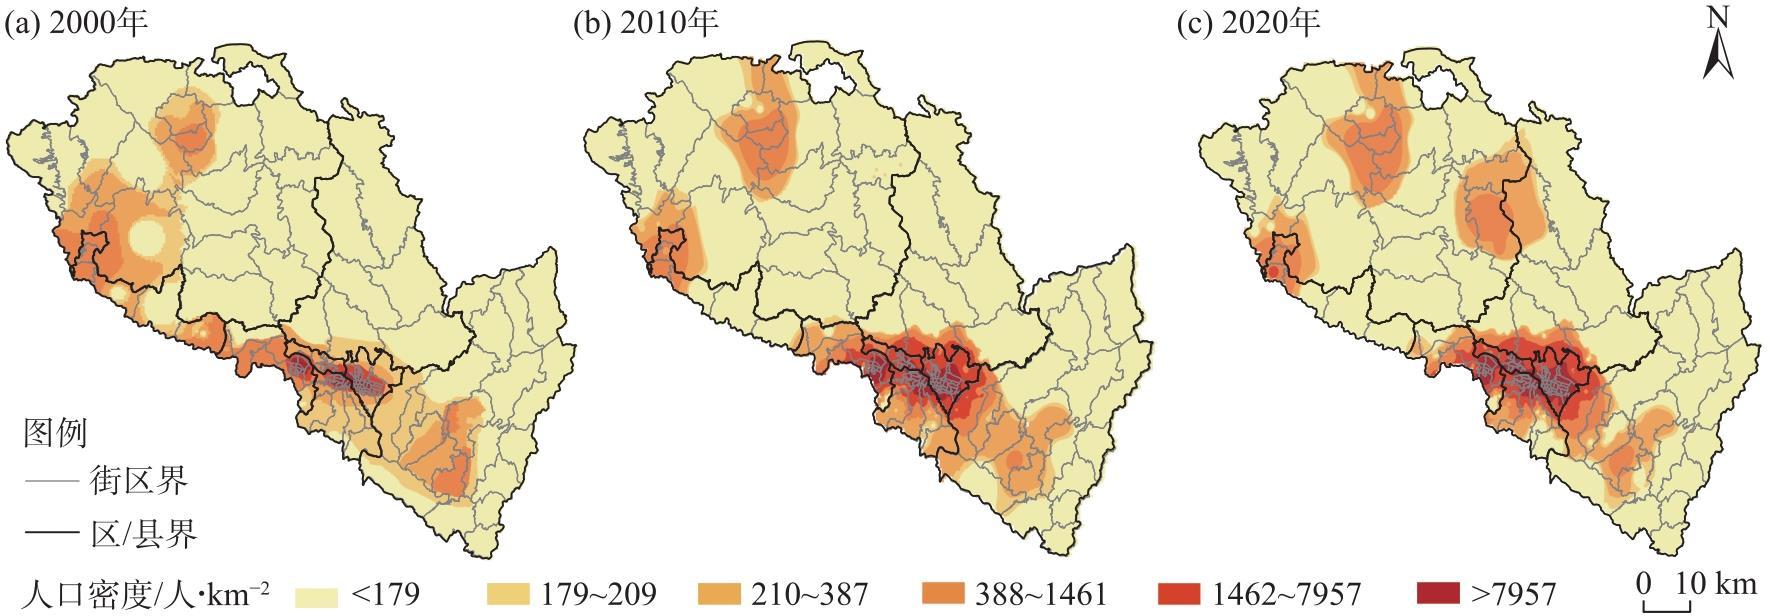
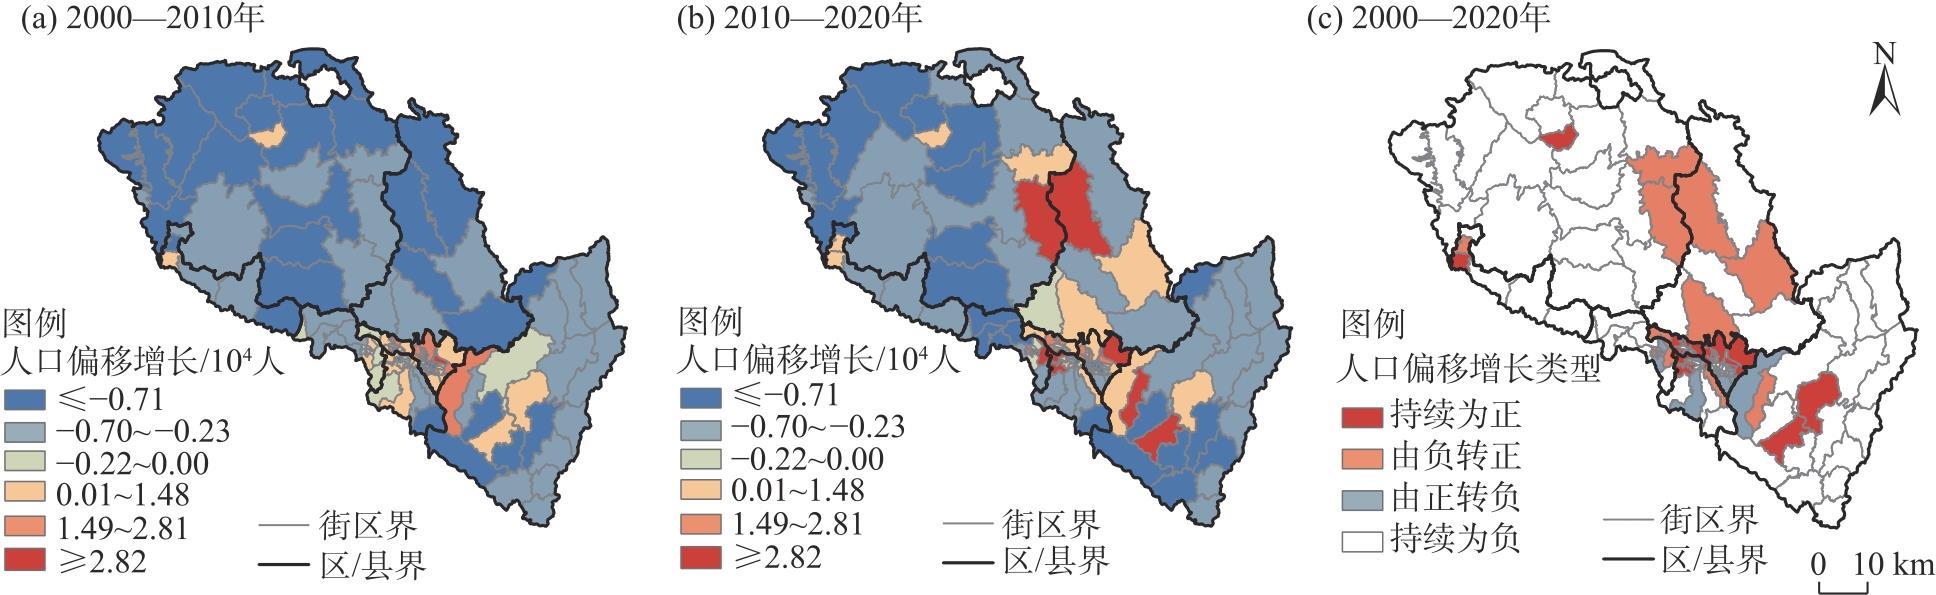
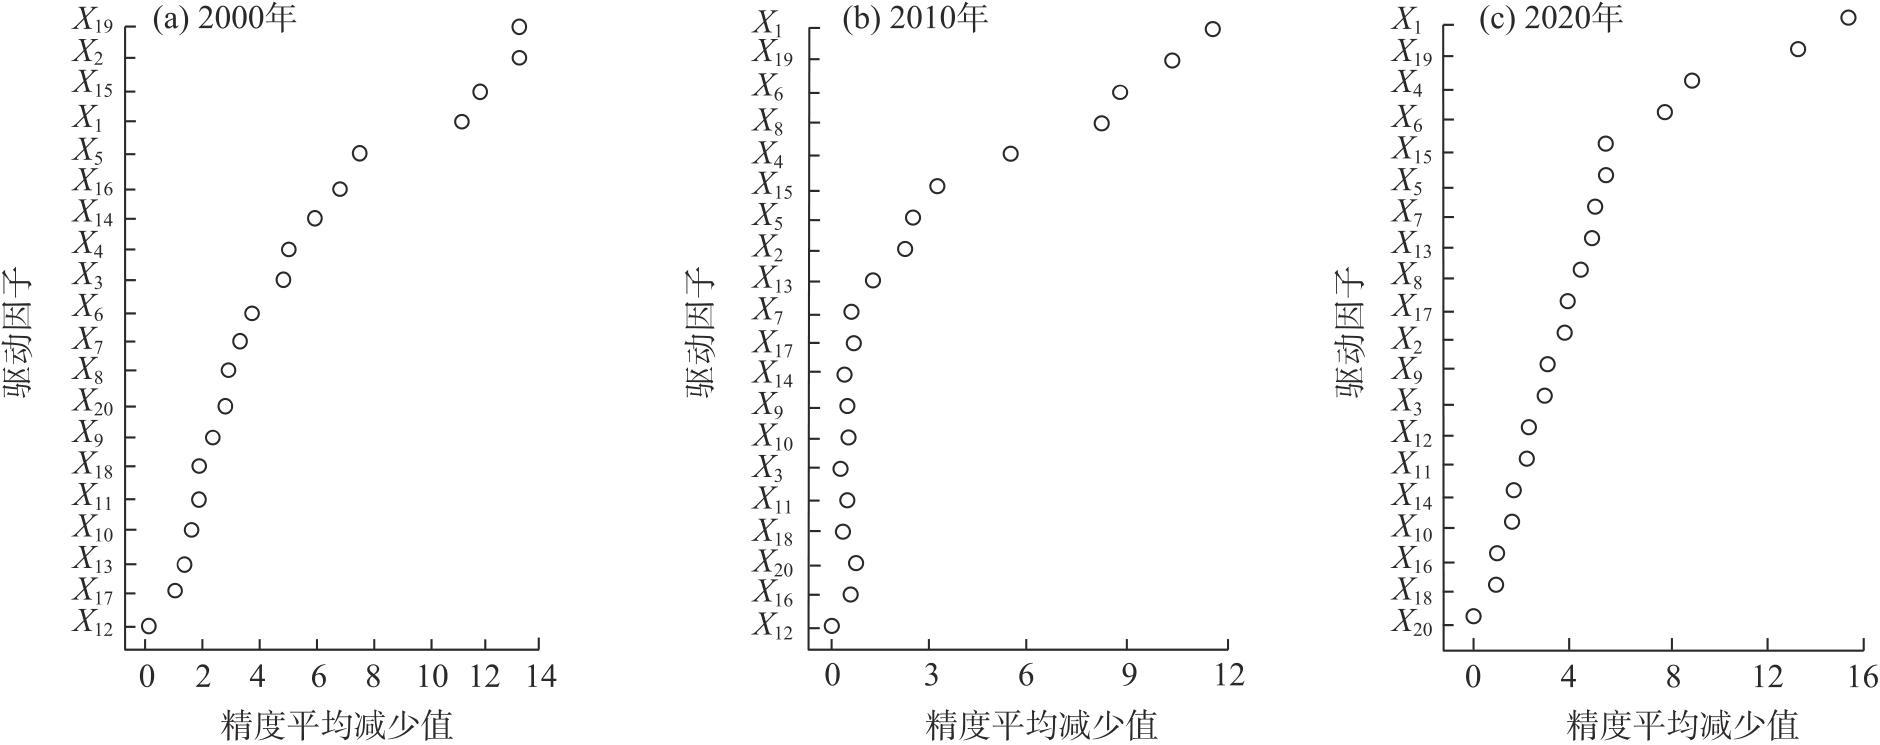
Utilizing data from population censuses conducted in 2000, 2010, and 2020, this study employs the offset-sharing analysis, the random forest model and other methods to examine the spatio-temporal evolution and driving factors of population distribution in Lanzhou City, Gansu Province, China, from 2000 to 2020. The findings reveal that: (1) Population growth exhibits significant differences across periods and regions in Lanzhou City, with clear suburbanization trends characterized by a “jumping” diffusion from the central urban area to the far suburbs. The central urban area remains the most populous, although its growth rate has slowed, while suburban growth is accelerating. Population in the far suburbs initially declined but later increased rapidly. (2) The population offset growth pattern in Lanzhou City is uneven. Taking 2010 as a pivotal year, blocks with positive population deviation growth were primarily located in the central urban area before 2010 but shifted to the far suburbs afterward, particularly in national new districts and development zones, which demonstrate “enclave” population agglomeration. (3) Natural factors, economic conditions, social development levels, and historical evolution are the main drivers of population spatial changes. Meanwhile, the influence of policy interventions and environmental comfort is increasingly significant. The impact of these driving factors on population distribution is nonlinear. These findings provide valuable insights for optimizing population distribution policies in inland cities of northwest China.
表1 2000—2020年兰州市各地区人口增长情况Tab. 1 Population growth in each region of Lanzhou City from 2000 to 2010 |
| 地域 | 人口数量/104人 | 人口密度/人·km-2 | 人口密度年均增长率/% | |||||||
|---|---|---|---|---|---|---|---|---|---|---|
| 2000年 | 2010年 | 2020年 | 2000年 | 2010年 | 2020年 | 2000—2010年 | 2010—2020年 | |||
| 中心城区 | 174.48 | 228.87 | 282.27 | 3341.45 | 4383.15 | 5405.74 | 2.75 | 2.12 | ||
| 近郊区 | 40.19 | 40.88 | 47.62 | 146.67 | 149.67 | 173.77 | 0.17 | 1.54 | ||
| 远郊区 | 99.58 | 91.87 | 106.05 | 100.29 | 92.52 | 106.81 | -0.81 | 1.45 | ||
表2 变量描述Tab. 2 Description of variables |
| 维度 | 解释变量 | 指标说明 | 数据来源 |
|---|---|---|---|
| 经济因素 | 城镇化水平(X1) | 各街区城镇人口占总人口比重/% | 2000、2010年和2020年兰州市人口普查数据 |
| 就业人口(X2) | 各街区就业人口数量/个 | 2000、2010年和2020年兰州市人口普查数据 | |
| 经济发展水平(X3) | 街区内平均夜间灯光指数 | 2000、2010年和2020年的夜间灯光指数源于国家青藏高原科学数据中心(http://data.tpdc.ac.cn) | |
| 生活成本(X4) | 各街区住宅平均销售价格/元·m-2 | 2000、2010年和2020年的住宅销售价格源于安居客官网(https//:anjuke.com) | |
| 企业数量(X5) | 各街区第二、三产业企业数量/个 | 2000、2010年和2020年兰州市工商管理局注册企业数据库 | |
| 社会发展水平 | 交通设施(X6) | 各街区公交、地铁站点数量/个 | 2005年中国电信兰州黄页名录数据以及2010年和2020年高德POI |
| 医疗设施(X7) | 各街区诊所、综合医院数量/个 | 同上 | |
| 教育设施(X8) | 各街区幼儿园、中小学、高等院校数量/个 | 同上 | |
| 购物设施(X9) | 各街区商场、大型超市、便利店数量/个 | 同上 | |
| 娱乐设施(X10) | 各街区影剧院、KTV、公园游乐园数量/个 | 同上 | |
| 金融设施(X11) | 各街区银行数量/个 | 同上 | |
| 政策因素 | 国家级新区(X12) | 街区内国家级新区面积比率/% | 国家级新区规划文件 |
| 国家级开发区(X13) | 街区内国家级开发区面积比率/% | 国家级开发区规划文件 | |
| 省级开发区(X14) | 街区内省级开发区面积比率/% | 省级开发区规划文件 | |
| 历史沿革 | 老城区(X15) | 街区内老城区面积比率/% | 参考既有文献划定(清末时期格局) |
| 老工业区(X16) | 街区内老工业区面积比率/% | 参考历版城市总体规划及政府文件划定 | |
| 环境 舒适度 | 城市绿地(X17) | 街区内绿地面积比率/% | 通过NDVI提取得到,2000、2010年和2020年的NDVI来源于中国科学院生态学科数据中心(http://www.nesdc.org.cn) |
| PM2.5(X18) | 各街区PM2.5浓度/μg·m-3 | 2000、2010年和2020年的PM2.5浓度来源于Zenodo欧洲科学数据开放平台(https://zenodo.org) | |
| 自然因素 | 地形起伏(X19) | 各街区平均地形起伏度/m | 通过DEM提取得到,2000、2010年和2020年DEM数据源于地理空间数据云平台(http://www.gscloud.cn/sources) |
| 降水量(X20) | 各街区年均降水量/mm | 兰州市气象局提供的兰州地区国家观测站点获得2000、2010年和2020年的年均降水数据 |
| [1] |
王新贤, 高向东. 中国流动人口分布演变及其对城镇化的影响——基于省际、省内流动的对比分析[J]. 地理科学, 2019, 39(12): 1866-1874.
[
|
| [2] |
李志刚, 刘达, 林赛南. 中国城乡流动人口“回流”研究进展与述评[J]. 人文地理, 2020, 35(1): 1-10.
[
|
| [3] |
余运江, 任会明, 高向东. 中国城市人口空间格局演化的新特征——基于2000—2020年人口普查数据的分析[J]. 人口与经济, 2022, 254(5): 65-79.
[
|
| [4] |
魏湖滨, 戚伟, 刘盛和, 等. 新型城镇化背景下中国城市郊区化研究进展与展望[J]. 地理科学进展, 2022, 41(11): 2152-2164.
[
|
| [5] |
曾文, 张小林, 向梨丽, 等. 2000—2010年南京都市区人口空间变动特征研究[J]. 地理科学, 2016, 36(1): 81-89.
[
|
| [6] |
|
| [7] |
|
| [8] |
|
| [9] |
|
| [10] |
|
| [11] |
|
| [12] |
|
| [13] |
|
| [14] |
|
| [15] |
刘艳军, 汤爽爽, 吴康, 等. 经济地理学视角下中国人口研究热点与展望[J]. 经济地理, 2021, 41(10): 97-105.
[
|
| [16] |
高向东, 张善余. 上海人口郊区化与城市可持续发展[J]. 中国人口·资源与环境, 2002, 12(1): 78-82.
[
|
| [17] |
冯健, 周一星. 近20年来北京都市区人口增长与分布[J]. 地理学报, 2003, 58(6): 903-916.
[
|
| [18] |
周春山, 罗彦, 陈素素. 近20年来广州市人口增长与分布的时空间演化分析[J]. 地理科学, 2004, 24(6): 641-647.
[
|
| [19] |
王芳莉, 党国锋. 近25 a甘肃省人口分布的时空格局及影响因素[J]. 干旱区地理, 2020, 43(2): 508-515.
[
|
| [20] |
王超, 阚瑷珂, 曾业隆, 等. 基于随机森林模型的西藏人口分布格局及影响因素[J]. 地理学报, 2019, 74(4): 664-680.
[
|
| [21] |
徐旳, 徐彦. 1928—2017年南京城市户籍人口时空格局演变. 地理学报[J]. 2022, 77(10): 2439-2456.
[
|
| [22] |
张志斌, 潘晶, 李小虎. 近30年来兰州市人口密度空间演变及其形成机制[J]. 地理科学, 2013, 33(1): 36-44.
[
|
| [23] |
王婧, 刘奔腾, 李裕瑞. 京津冀人口时空变化特征及其影响因素[J]. 地理研究, 2018, 37(9): 1802-1817.
[
|
| [24] |
张文斌, 张志斌. 基于扩展生态位理论的居住空间分异研究——以兰州市为例[J]. 干旱区地理, 2023, 46(8): 1376-1386.
[
|
| [25] |
郭杰, 杨永春, 冷炳荣. 1949 年以来中国西部大城市制造业企业迁移特征、模式及机制——以兰州市为例[J]. 地理研究, 2012, 31(10): 1872-1886.
[
|
| [26] |
王婧, 李裕瑞. 中国县域城镇化发展格局及其影响因素——基于2000和2010年全国人口普查分县数据[J]. 地理学报, 2016, 71(4): 621-636.
[
|
| [27] |
闫东升, 孙伟, 王玥, 等. 长江三角洲人口分布演变、偏移增长及影响因素[J]. 地理科学进展, 2020, 39(12): 2068-2082.
[
|
| [28] |
柏中强, 王卷乐, 杨雅萍, 等. 基于乡镇尺度的中国25省区人口分布特征及影响因素[J]. 地理学报, 2015, 70(8): 1229-1242.
[
|
| [29] |
古恒宇, 劳昕, 温锋华, 等. 2000—2020年中国省际人口迁移格局的演化特征及影响因素[J]. 地理学报, 2022, 77(12): 3041-3054.
[
|
| [30] |
田盼盼, 朱宇, 林李月, 等. 省际与省内流动人口空间分布及其影响因素的差异——以福建省为例[J]. 人口学刊, 2015, 37(6): 56-67.
[
|
| [31] |
周春山, 朱孟珏. 转型期我国城市新区的空间效应及机理研究[J]. 城市规划, 2021, 45(3): 91-98.
[
|
| [32] |
温婷, 蔡建明, 杨振山, 等. 国外城市舒适性研究综述与启示[J]. 地理科学进展, 2014, 33(2): 249-258.
[
|
| [33] |
杨永春, 汪一鸣. 中国西部河谷型城市地域结构与形态研究[J]. 地域研究与开发, 2000(4): 58-61.
[
|
/
| 〈 |
|
〉 |