
中国家庭消费间接碳排放空间关联结构演变——基于社会网络分析法
|
付伟(1986-),女,博士,副教授,主要从事生态经济与可持续发展等方面的研究. E-mail: fuweiynlzd@126.com |
收稿日期: 2024-01-17
修回日期: 2024-04-24
网络出版日期: 2026-03-11
基金资助
国家自然科学基金项目(72264035)
云南省兴滇英才青年人才专项项目资助
Evolution of spatial correlation structure of indirect carbon emissions from household consumption in China: Based on social network analysis
Received date: 2024-01-17
Revised date: 2024-04-24
Online published: 2026-03-11
付伟 , 巩海秀 , 陈建成 . 中国家庭消费间接碳排放空间关联结构演变——基于社会网络分析法[J]. 干旱区地理, 2025 , 48(1) : 119 -129 . DOI: 10.12118/j.issn.1000-6060.2024.035
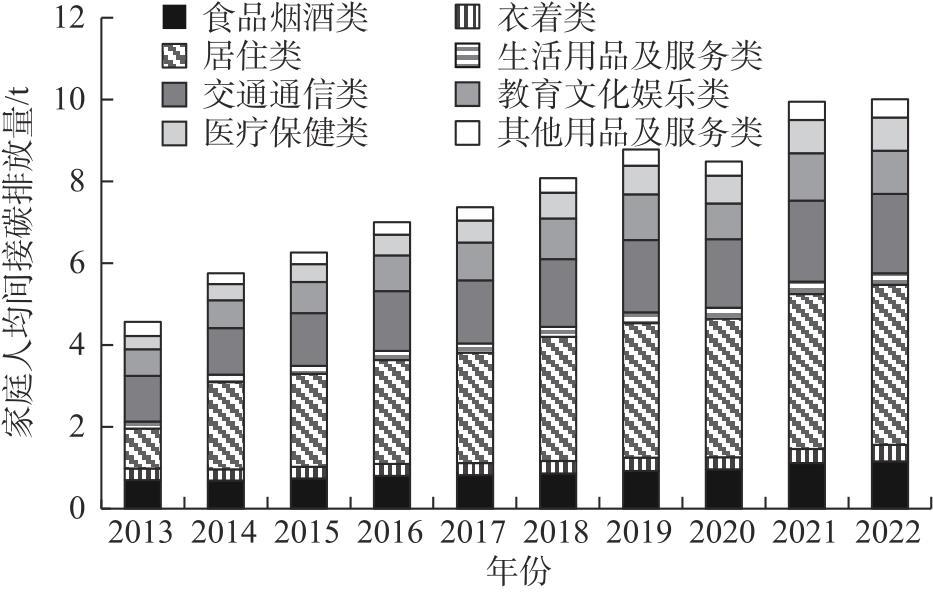
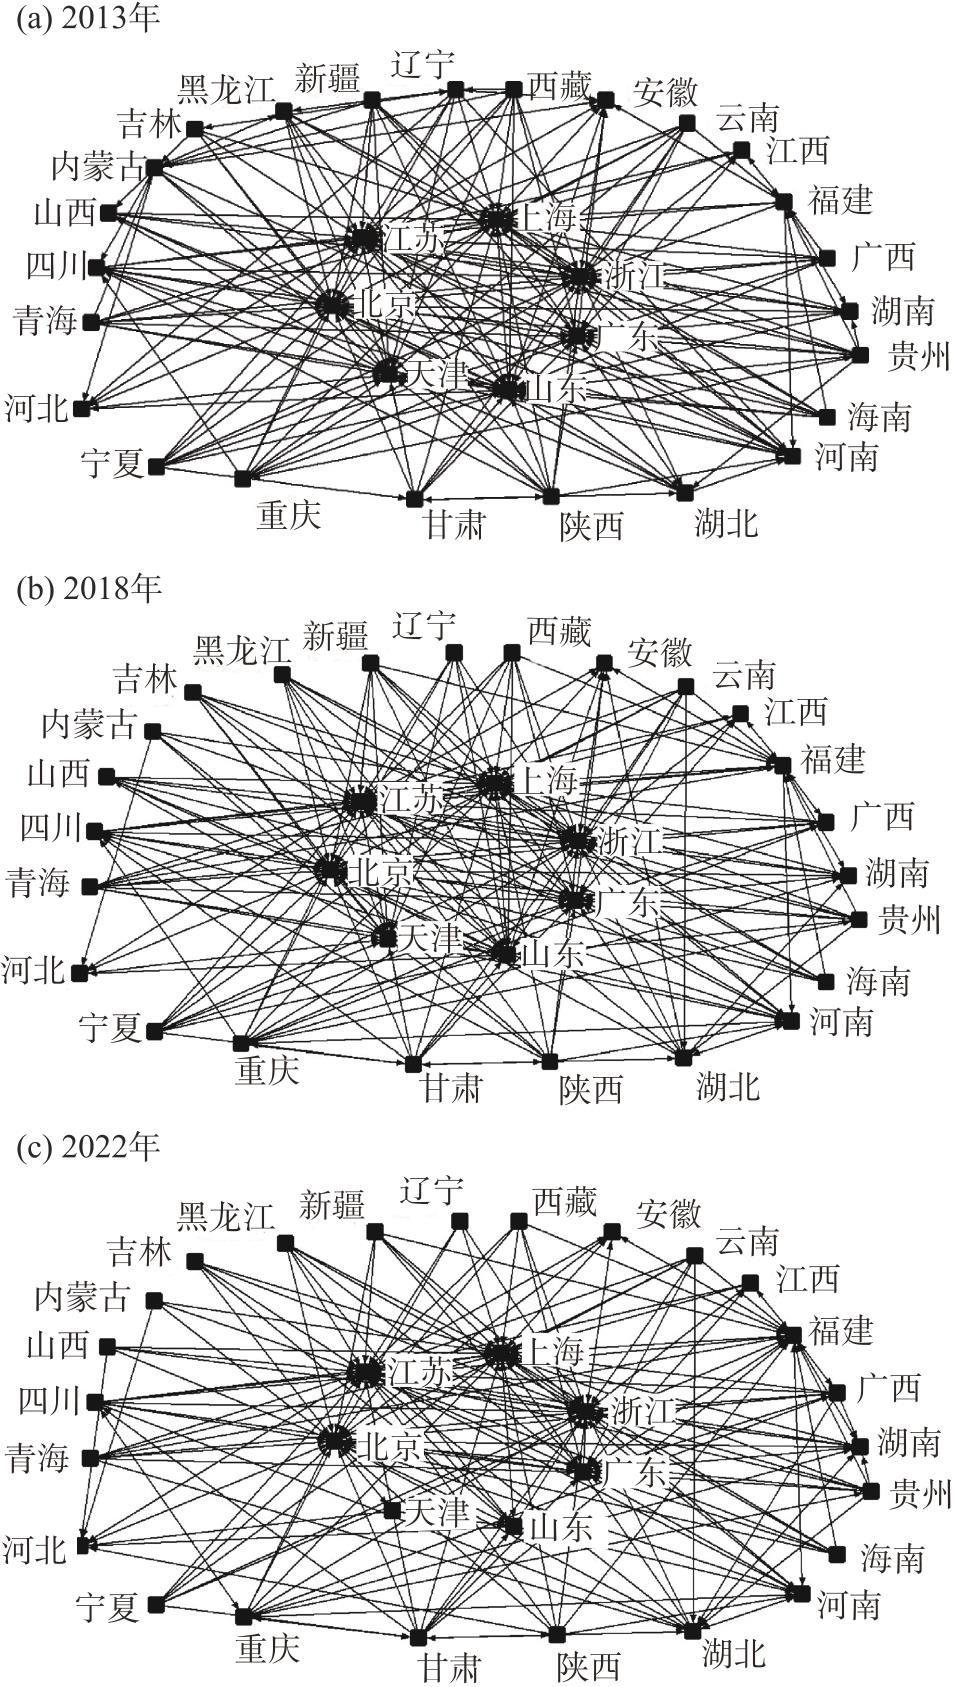
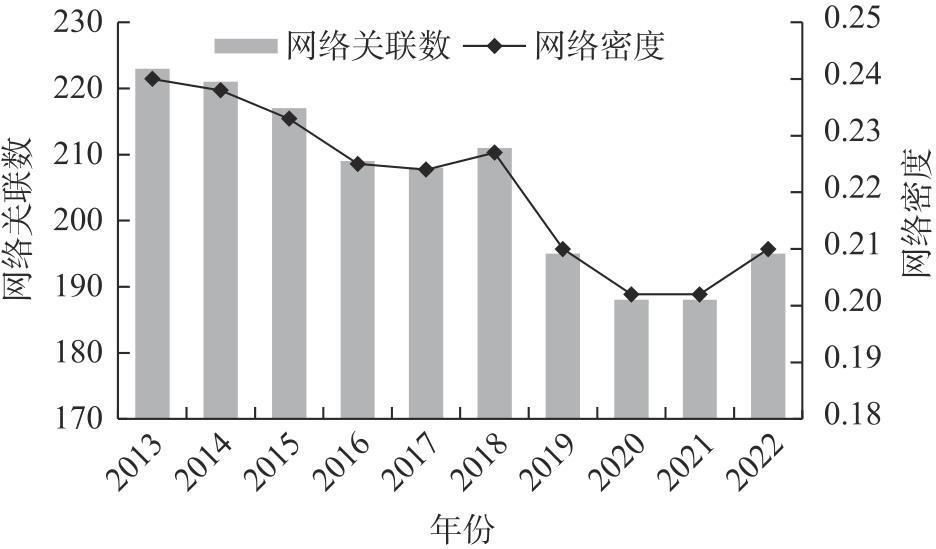
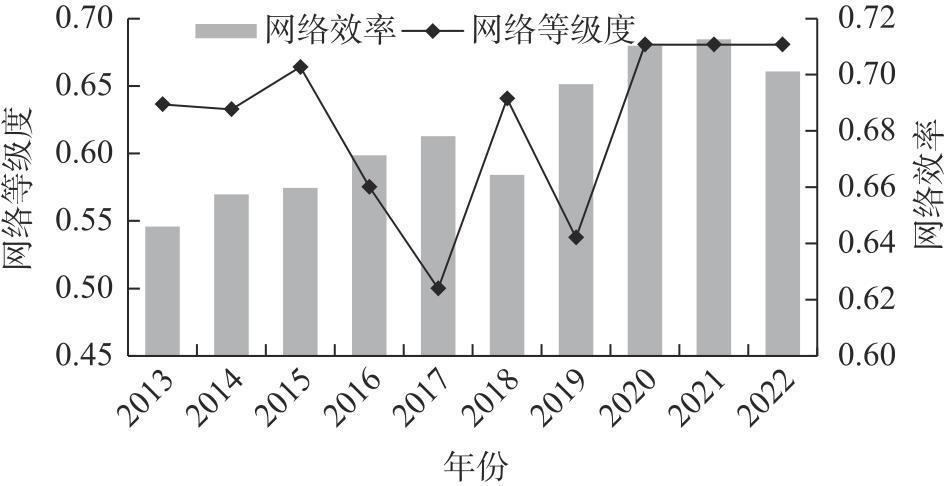
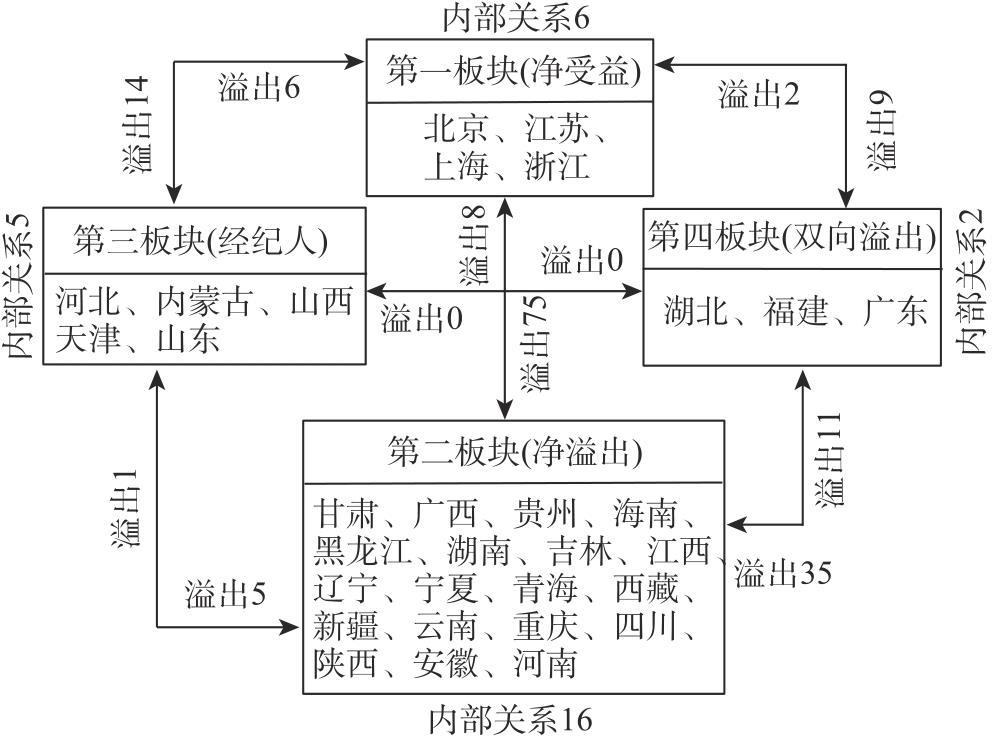
Understanding the spatial clustering and structural characteristics of indirect carbon emissions from household consumption is crucial for China to achieve the “carbon peaking and carbon neutrality” goal under its new development framework. This study calculates indirect carbon emissions from household consumption in China and examines the structural characteristics of the spatial correlation network for these emissions from 2013 to 2022 using social network analysis. The findings reveal the following: (1) Indirect carbon emissions from household consumption exhibit an overall upward trend, increasing 1.2-fold over ten years. Emissions from “food”, “housing”, “transport and communication”, and “education, culture, and entertainment” constitute 75% of the total. (2) Overall network characteristics: The overall network structure, centered on provinces and cities such as Jiangsu Province, Beijing City, Zhejiang Province, and Shanghai City, demonstrates a “core-edge” distribution pattern. Network density and the number of associations have declined, while grade gradient and association intensity have increased. (3) Characteristics of the block model: Regional network characteristics, based on node spillover and reception effects, are categorized into four segments: “net spillover”, “net benefit”, “broker”, and “two-way spillover”, and each segment plays different roles in the field of spatial correlation. (4) Individual network characteristics: Regarding individual network characteristics, provinces such as Shanghai City, Jiangsu Province, and Zhejiang Province, with the highest degree of centrality, occupy the core areas of the correlation network and exhibit significant spatial correlation and outward radiation effects. In contrast, provinces such as Qinghai Province and Heilongjiang Province, located on the periphery, exhibit weaker correlation effects.
表1 基于间接碳排放的消费类别Tab. 1 Consumption categories based on indirect carbon emissions |
| 消费性支出项目 | 涉及内容 | 间接碳排放系数/kg CO2·元-1 |
|---|---|---|
| 食品 | 农林牧渔产品及服务;食品和烟草 | 0.049 |
| 衣着 | 纺织品;纺织服装鞋帽皮革羽绒及其制品 | 0.076 |
| 居住 | 非金属矿物制品;金属制品;电力、热力、燃气和水生产和供应;建筑 | 0.210 |
| 生活用品及服务 | 木材加工品和家具;电气机械和器材 | 0.068 |
| 交通通信 | 通信设备、计算机和其他电子设备;交通运输、仓储和邮政 | 0.198 |
| 教育文化娱乐 | 造纸印刷和文教体育用品 | 0.144 |
| 医疗保健 | 医药制品 | 0.117 |
| 其他用品及服务 | 批发和零售;住宿和餐饮 | 0.234 |
表2 网络整体结构与个体结构特征指标Tab. 2 Indices of overall network structure and individual structure characteristics |
| 整体网 络结构 | 公式 | 个体网络结构 | 公式 |
|---|---|---|---|
| 网络密 度(T) | 点度中心度(CRD) | ||
| 网络等 级度(H) | 中介中心度(CRB) | ||
| 网络效 率(T) | 接近中心度(CAP) |
注:N为网络节点个数;R为网络关联数量;K、Kmax为对称可达点对数和最大对称可达点对数;M、Mmax为冗余节点和最大冗余节点系数;bjk(i)为两节点间的联系能力;dij为i、j省市间的实际地理距离(km)。 |
表3 块模型中的经济增长板块分类Tab. 3 Classification of economic growth segments in block model |
| 位置内部的关系比例 | 位置接受到的关系比例 | |
|---|---|---|
| 双向溢出板块 | 净受益板块 | |
| 净溢出板块 | 经纪人板块 | |
注: 为板块内省市数量;s为空间关联网络中所有省市数量。 |
表4 2022年空间关联板块的溢出效应Tab. 4 Spillover effects of spatially correlated sectors in 2022 |
| 板块 | 接收关系 | 发出关系 | 期望内部 关系比例/% | 实际内部 关系比例/% | 板块属性 | ||
|---|---|---|---|---|---|---|---|
| 板块内 | 板块外 | 板块内 | 板块外 | ||||
| 第一板块 | 6 | 98 | 6 | 16 | 10.00 | 27.27 | 净受益 |
| 第二板块 | 16 | 20 | 16 | 115 | 60.00 | 12.21 | 净溢出 |
| 第三板块 | 5 | 11 | 5 | 15 | 13.33 | 25.00 | 经纪人 |
| 第四板块 | 2 | 37 | 2 | 20 | 6.67 | 9.09 | 双向溢出 |
表5 2022年空间关联网络的中心性分析结果Tab. 5 Centralization analysis results of spatially correlated networks in 2022 |
| 省市 | 点出度 | 点入度 | 点度中心度 | 中介中心度 | 接近中心度 |
|---|---|---|---|---|---|
| 江苏 | 27 | 27 | 90.00 | 63.30 | 90.91 |
| 上海 | 27 | 27 | 90.00 | 58.24 | 90.91 |
| 北京 | 25 | 25 | 83.33 | 74.74 | 85.71 |
| 浙江 | 25 | 25 | 83.33 | 44.90 | 85.71 |
| 广东 | 18 | 18 | 60.00 | 14.47 | 71.43 |
| 福建 | 17 | 17 | 56.67 | 16.32 | 68.18 |
| 甘肃 | 12 | 12 | 40.00 | 3.85 | 62.50 |
| 湖北 | 12 | 12 | 40.00 | 3.45 | 62.50 |
| 重庆 | 10 | 10 | 33.33 | 1.59 | 60.00 |
| 河南 | 10 | 10 | 33.33 | 2.39 | 60.00 |
| 山东 | 10 | 10 | 33.33 | 8.04 | 60.00 |
| 湖南 | 10 | 10 | 33.33 | 1.02 | 60.00 |
| 四川 | 9 | 9 | 30.00 | 0.91 | 58.82 |
| 广西 | 9 | 9 | 30.00 | 0.91 | 58.82 |
| 贵州 | 9 | 9 | 30.00 | 0.91 | 58.82 |
| 陕西 | 8 | 8 | 26.67 | 2.47 | 57.69 |
| 河北 | 7 | 7 | 23.33 | 3.59 | 56.60 |
| 云南 | 7 | 7 | 23.33 | 0.56 | 56.60 |
| 青海 | 7 | 7 | 23.33 | 0.56 | 56.60 |
| 宁夏 | 6 | 6 | 20.00 | 0.37 | 55.56 |
| 黑龙江 | 6 | 6 | 20.00 | 0.27 | 55.56 |
| 新疆 | 6 | 6 | 20.00 | 0.37 | 55.56 |
| 海南 | 6 | 6 | 20.00 | 0.37 | 55.56 |
| 西藏 | 6 | 6 | 20.00 | 0.37 | 55.56 |
| 山西 | 5 | 5 | 16.67 | 0.58 | 54.55 |
| 吉林 | 5 | 5 | 16.67 | 0.13 | 54.55 |
| 安徽 | 5 | 5 | 16.67 | 0.37 | 54.55 |
| 内蒙古 | 5 | 5 | 16.67 | 0.29 | 53.57 |
| 辽宁 | 4 | 4 | 13.33 | 0.13 | 53.57 |
| 江西 | 4 | 4 | 13.33 | 0.12 | 53.57 |
| 天津 | 3 | 3 | 10.00 | 0.00 | 50.85 |
| 均值 | 10 | 10 | 34.41 | 9.86 | 61.77 |
| [1] |
吉雪强, 张跃松. 长江经济带种植业碳排放效率空间关联网络结构及动因[J]. 自然资源学报, 2023, 38(3): 675-693.
[
|
| [2] |
华怡婷, 石宝峰. 互联网使用与家庭间接碳排放: 测度及影响因素分析[J]. 重庆大学学报(社会科学版), 2023, 29(1): 117-134.
[
|
| [3] |
邵帅, 徐俐俐, 杨莉莉. 千里“碳缘”一线牵: 中国区域碳排放空间关联网络的结构特征与形成机制[J]. 系统工程理论与实践, 2023, 43(4): 958-983.
[
|
| [4] |
彭璐璐, 李楠, 郑智远, 等. 中国居民消费碳排放影响因素的时空异质性[J]. 中国环境科学, 2021, 41(1): 463-472.
[
|
| [5] |
史琴琴, 鲁丰先, 陈海, 等. 中原经济区城镇居民消费间接碳排放时空格局及其影响因素[J]. 资源科学, 2018, 40(6): 1297-1306.
[
|
| [6] |
李治, 李培, 郭菊娥, 等. 城市家庭碳排放影响因素与跨城市差异分析[J]. 中国人口·资源与环境, 2013, 23(10): 87-94.
[
|
| [7] |
庄贵阳, 魏鸣昕. 城市引领碳达峰、碳中和的理论和路径[J]. 中国人口·资源与环境, 2021, 31(9): 114-121.
[
|
| [8] |
|
| [9] |
韩君, 牛士豪, 高瀛璐. 新发展阶段居民家庭碳排放核算及影响因素研究[J]. 兰州财经大学学报, 2023, 39(1): 68-80.
[
|
| [10] |
|
| [11] |
|
| [12] |
范玲, 汪东. 我国居民间接能源消费碳排放的测算及分解分析[J]. 生态经济, 2014, 30(7): 28-32.
[
|
| [13] |
陈为公, 程准, 张娜, 等. 山东省农村居民生活间接碳排放影响因素[J]. 沈阳大学学报(社会科学版), 2021, 23(3): 273-278, 286.
[
|
| [14] |
吴茜, 陈强强. 甘肃省行业碳排放影响因素及脱钩努力研究[J]. 干旱区地理, 2023, 46(2): 274-283.
[
|
| [15] |
吴开亚, 王文秀, 张浩, 等. 上海市居民消费的间接碳排放及影响因素分析[J]. 华东经济管理, 2013, 27(1): 1-7.
[
|
| [16] |
杜娅明, 白永平, 梁建设, 等. 黄河流域旅游业碳排放效率综合测度及影响因素研究[J]. 干旱区地理, 2023, 46(12): 2074-2085.
[
|
| [17] |
邹嘉龄, 刘卫东. 2001—2013年中国与“一带一路”沿线国家贸易网络分析[J]. 地理科学, 2016, 36(11): 1629-1636.
[
|
| [18] |
|
| [19] |
邵璇璇, 姚永玲. 长江中游城市群的空间网络特征及其影响机制[J]. 城市问题, 2019, 10: 15-26.
[
|
| [20] |
|
| [21] |
孙敏, 杨红娟, 刘海洋. 少数民族农户生活消费间接碳排放影响因素研究[J]. 经济问题探索, 2016(5): 51-58.
[
|
| [22] |
王晓平, 冯庆, 宋金昭. 成渝城市群碳排放空间关联结构演化及影响因素[J]. 中国环境科学, 2020, 40(9): 4123-4134.
[
|
| [23] |
|
| [24] |
孙中瑞, 樊杰, 孙勇, 等. 中国绿色科技创新效率空间关联网络结构特征及影响因素[J]. 经济地理, 2022, 42(3): 33-43.
[
|
| [25] |
赵林, 高晓彤, 刘焱序, 等. 中国包容性绿色效率空间关联网络结构演变特征分析[J]. 经济地理, 2021, 41(9): 69-78, 90.
[
|
| [26] |
|
| [27] |
杨上广, 王春兰, 刘淋. 上海家庭出行碳排放基本特征、空间模式及影响因素研究[J]. 中国人口·资源与环境, 2014, 24(6): 148-153.
[
|
| [28] |
刘英恒太, 杨丽娜. 中国数字经济产出的空间关联网络结构与影响因素研究[J]. 技术经济, 2021, 40(9): 137-145.
[
|
| [29] |
孙亚男, 刘华军, 刘传明, 等. 中国省际碳排放的空间关联性及其效应研究——基于SNA的经验考察[J]. 上海经济研究, 2016(2): 82-92.
[
|
/
| 〈 |
|
〉 |
