
|
林秋平(1981-),硕士,女,副教授,主要从事物流产业经济研究. E-mail: lqpxjcd@foxmail.com |
收稿日期: 2023-10-13
修回日期: 2023-11-07
网络出版日期: 2026-03-11
基金资助
国家社科基金面上项目(20BGL020)
新疆维吾尔自治区普通高等学校人文社会科学基地新疆企业发展研究中心项目(XJEDU2023J007)
新疆财经大学研究生科研创新项目(XJUFE2023K048)
Spatiotemporal evolution, influencing factors, and development strategies of logistics enterprise location in Urumqi City
Received date: 2023-10-13
Revised date: 2023-11-07
Online published: 2026-03-11
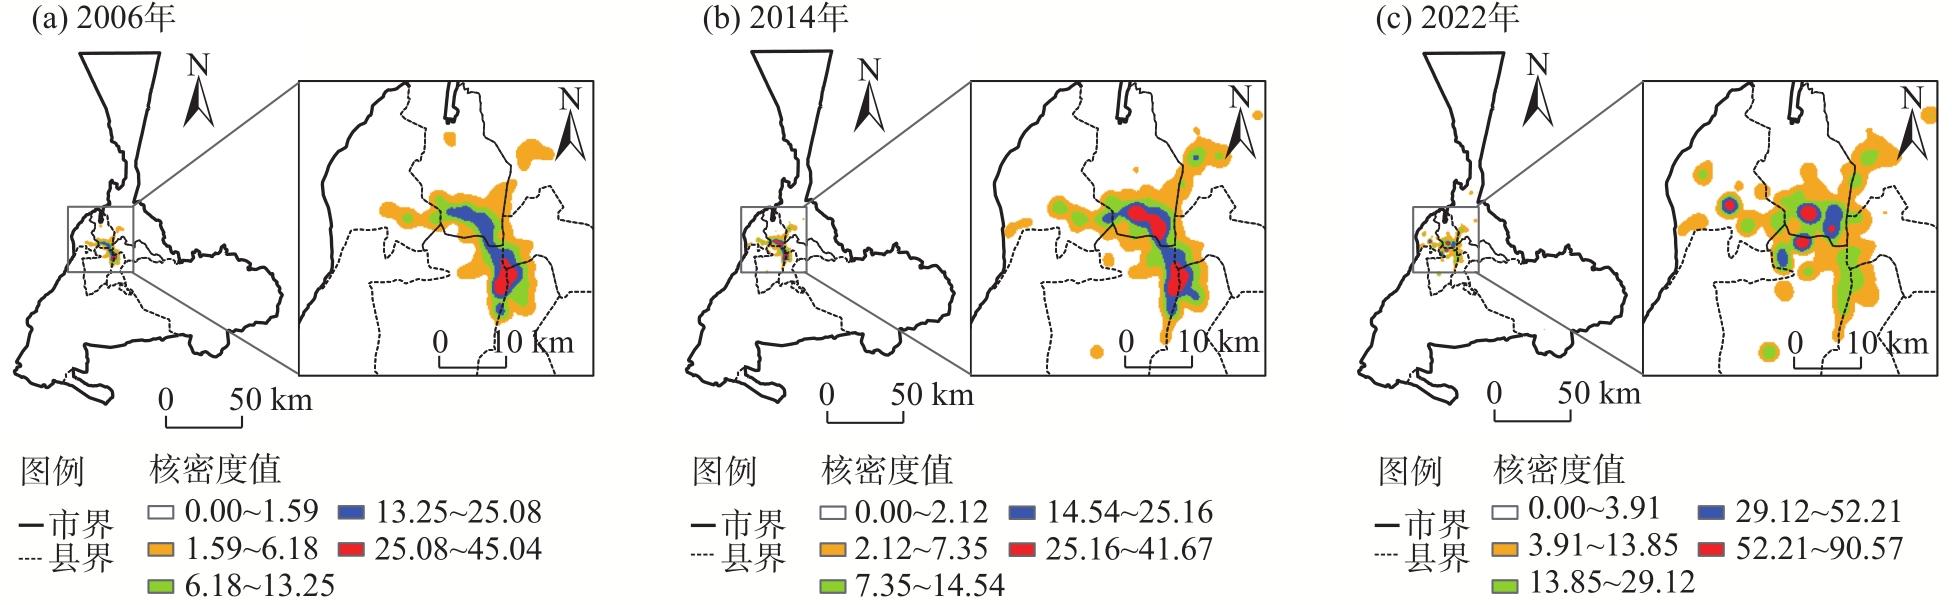
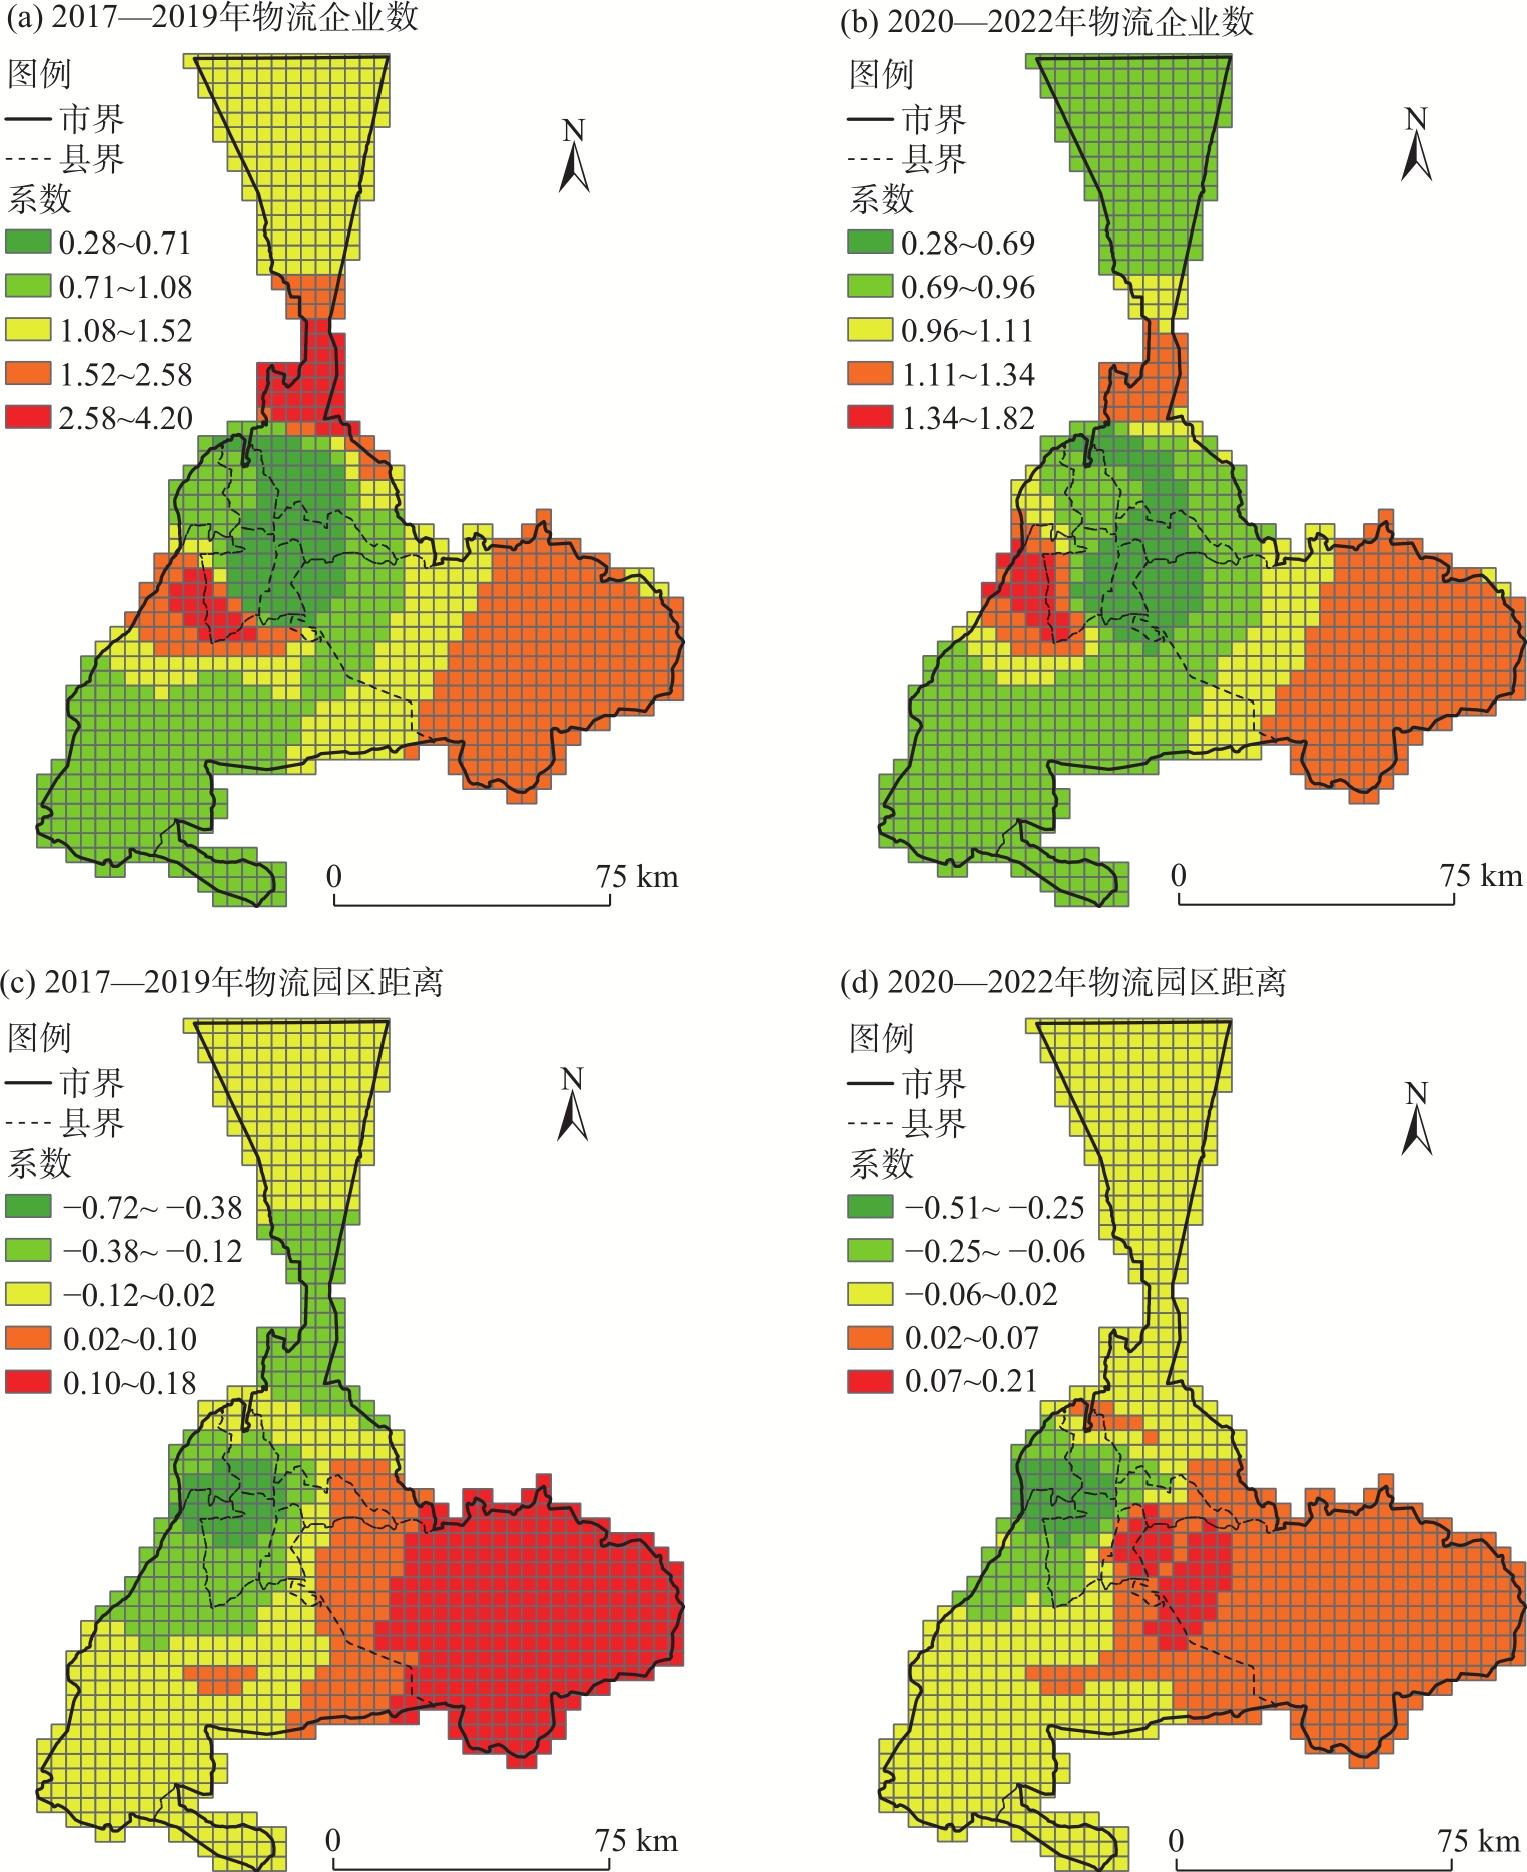
物流企业的空间布局不仅可以改变现有的物流组织形式,对重塑地区的产业空间格局也会产生重大影响。基于2006—2022年乌鲁木齐市物流企业空间数据,在对乌鲁木齐市物流企业区位时空演变分析的基础上,运用地理探测器和多尺度地理加权回归进一步探究物流企业区位选择的影响因素及其空间异质性,并提出优化物流企业空间布局的发展策略。结果表明:(1) 乌鲁木齐市物流企业存在集聚分布特征,呈现出由“一主轴、一核心”向“三主核、两副核”演变的空间格局。(2) 乌鲁木齐市地区间物流企业发展存在显著的正向溢出效应。(3) 物流企业区位选择的影响因素中,物流企业数解释力度的均值为66%、地区GDP为48%、人口密度为49%、物流园区距离为28%;其中物流企业数和物流园区距离是空间异质性因素且其系数在空间上变化较大,地区GDP是具有正向影响的全局变量,人口密度是具有负向影响的全局变量。研究结果不仅拓展了企业区位理论的研究,而且丰富了研究案例,同时可以为乌鲁木齐市进行物流产业规划和高质量建设丝绸之路经济带商贸物流中心提供理论依据和实践参考。
林秋平 , 李松芮 , 杨上广 , 王云云 . 乌鲁木齐市物流企业区位时空演化、影响因素和发展策略研究[J]. 干旱区地理, 2024 , 47(7) : 1252 -1262 . DOI: 10.12118/j.issn.1000-6060.2023.574
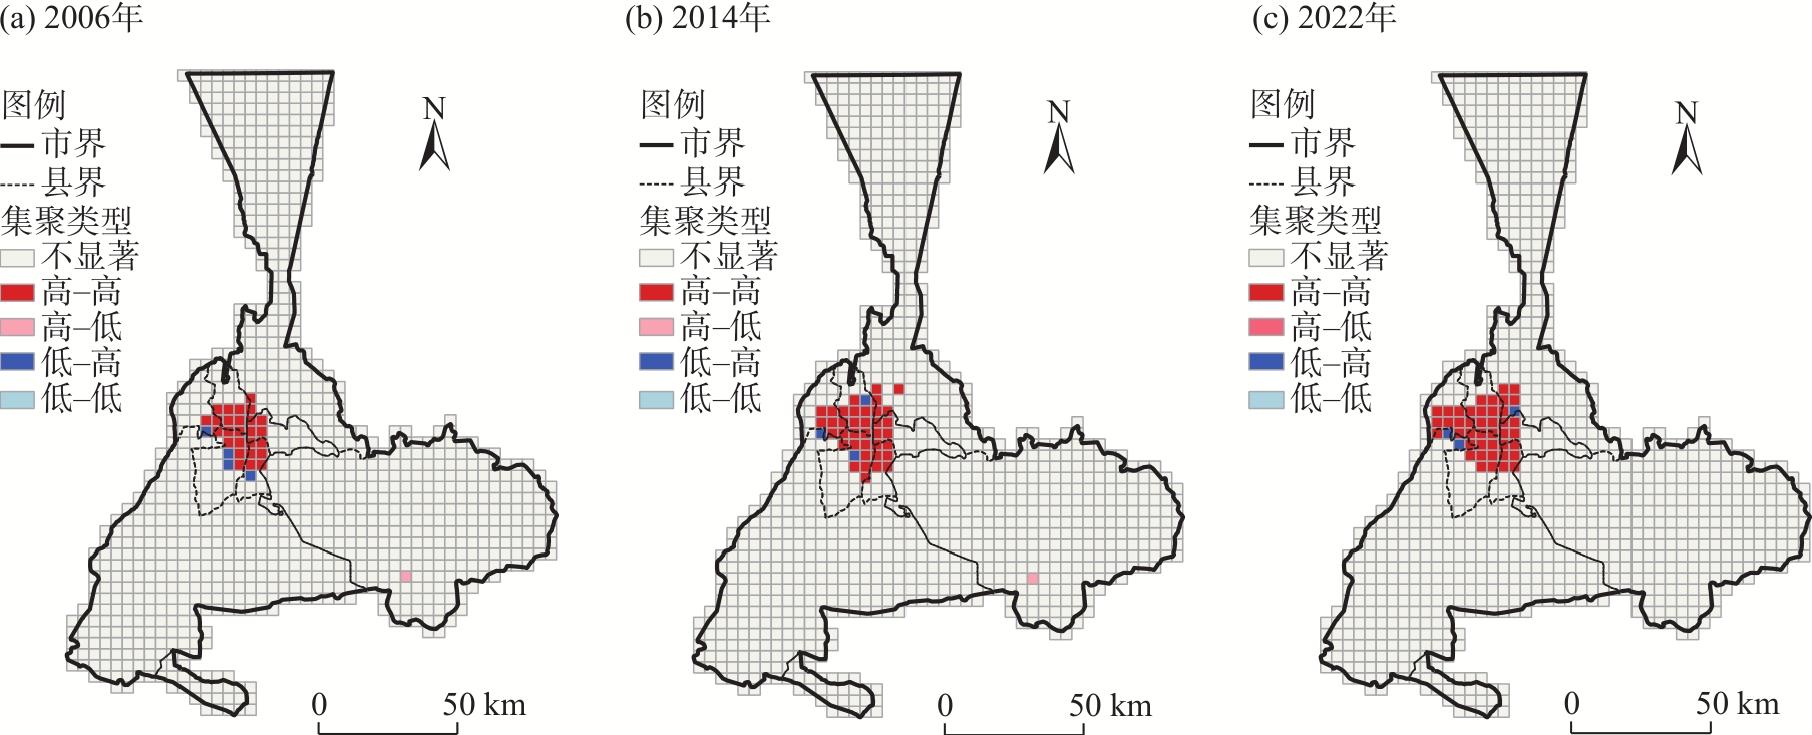
The spatial layout of logistics enterprises can change the existing form of logistics organization and significantly affect the reshaping of the industrial spatial pattern of a region. Based on the spatial data of logistics enterprises in Urumqi City of Xinjiang, China, from 2006 to 2022, and based on the analysis of the spatiotemporal evolution of logistics enterprise locations in Urumqi, this study explores the influencing factors and spatial heterogeneity of logistics enterprise location selection using geographic detectors and multiscale geographically weighted regression and proposes development strategies to optimize the spatial layout of logistics enterprises. Research shows that: (1) Logistics enterprises in Urumqi have agglomeration distribution characteristics, presenting a spatial pattern of evolution from “one main axis, one core” to “three main cores, two secondary cores”. (2) A significant positive spillover effect occurs in developing logistics enterprises between districts in Urumqi City. (3) Among the factors influencing the location selection of logistics enterprises, the average number of logistics enterprises is 66%, the regional GDP is 48%, the population density is 49%, and the distance between logistics parks is 28%. The number of logistics enterprises and the distance between logistics parks are spatial heterogeneity factors, and their coefficients vary significantly. The regional GDP is a global variable with a positive impact, whereas population density is a global variable with a negative impact. The results expand the enterprise location theory and enrich research cases. Simultaneously, it can provide a theoretical basis and practical reference for Urumqi’s logistics industry planning and high-quality Silk Road Economic Belt commercial logistics center construction.
表1 平均最近邻分析Tab. 1 Average nearest neighbor analysis |
| 年份 | 最近邻比率 | Z值 | P值 |
|---|---|---|---|
| 2006 | 0.157 | -73.598 | 0.000 |
| 2010 | 0.158 | -78.845 | 0.000 |
| 2014 | 0.166 | -91.230 | 0.000 |
| 2018 | 0.154 | -102.485 | 0.000 |
| 2022 | 0.127 | -130.423 | 0.000 |
注:Z值表示统计值;P值表示显著性水平。下同。 |
表2 物流企业全局莫兰指数Tab. 2 Global Moran’s I of logistics enterprises |
| 年份 | Global Moran’s I | Z值 | P值 |
|---|---|---|---|
| 2006 | 0.434 | 36.066 | 0.000 |
| 2010 | 0.473 | 31.317 | 0.000 |
| 2014 | 0.521 | 35.568 | 0.000 |
| 2018 | 0.570 | 36.292 | 0.000 |
| 2022 | 0.602 | 38.111 | 0.000 |
表3 物流企业空间分布影响因素Tab. 3 Influencing factors of logistics enterprise spatial distribution |
| 维度 | 指标 | 单位 | 符号 | 定义与解释 |
|---|---|---|---|---|
| 交通条件 | 火车站的距离 | km | X1 | 到最近火车站的距离(取对数) |
| 飞机场的距离 | km | X2 | 到最近飞机场的距离(取对数) | |
| 高速路出入口距离 | km | X3 | 到最近高速路出入口的距离(取对数) | |
| 道路长度 | km | X4 | 网格内道路总长度(取对数) | |
| 集聚因素 | 物流企业数 | 家 | X5 | 网格内物流企业数量 |
| 工业园区距离 | km | X6 | 到最近工业园区的距离(取对数) | |
| 农业园区距离 | km | X7 | 到最近农业园区的距离(取对数) | |
| 科技园区距离 | km | X8 | 到最近科技园区的距离(取对数) | |
| 社会经济 | 国内生产总值(GDP) | 108元·km-2 | X9 | 网格内GDP的均值 |
| 人口密度 | 人·km-2 | X10 | 网格内人口密度的均值 | |
| 政府政策 | 物流园区距离 | km | X11 | 到最近物流园区的距离(取对数) |
| 保税区距离 | km | X12 | 到最近保税区的距离(取对数) |
表4 乌鲁木齐市物流企业空间分布影响因素地理探测器结果Tab. 4 Geographical detection results of influencing factors of logistics enterprise spatial distribution in Urumqi City |
| 影响因素 | X1 | X2 | X3 | X4 | X5 | X6 | X7 | X8 | X9 | X10 | X11 | X12 | |
|---|---|---|---|---|---|---|---|---|---|---|---|---|---|
| 2017—2019年 | q值 | 0.128 | 0.181 | 0.111 | 0.139 | 0.690 | 0.124 | 0.089 | 0.258 | 0.521 | 0.566 | 0.303 | 0.168 |
| 排名 | 9 | 6 | 11 | 7 | 1 | 10 | 12 | 5 | 3 | 2 | 4 | 8 | |
| 2020—2022年 | q值 | 0.100 | 0.164 | 0.086 | 0.094 | 0.633 | 0.139 | 0.073 | 0.223 | 0.444 | 0.420 | 0.259 | 0.142 |
| 排名 | 10 | 6 | 11 | 9 | 1 | 8 | 12 | 5 | 2 | 3 | 4 | 7 | |
注:q值为解释力度;所有变量均通过1%显著性检验。 |
表5 MGWR和OLS模型总体估计结果Tab. 5 Estimation results of MGWR and OLS models |
| 变量 | MGWR模型 | OLS模型 | |||||||||
|---|---|---|---|---|---|---|---|---|---|---|---|
| 2017—2019年 | 2020—2022年 | 2017—2019年 | 2020—2022年 | ||||||||
| Mean | BW | Mean | BW | Coef | VIF | Coef | VIF | ||||
| 物流企业数 | 1.359*** | 55 | 0.753*** | 55 | 0.576*** | 3.16 | 0.753*** | 2.60 | |||
| GDP | 0.289** | 898 | 0.403** | 973 | 0.597*** | 5.93 | 0.403*** | 6.55 | |||
| 人口密度 | -0.221** | 868 | -0.377** | 872 | -0.316*** | 8.47 | -0.377*** | 5.21 | |||
| 物流园区距离 | -0.023*** | 57 | -0.059*** | 57 | -0.078*** | 1.58 | -0.059*** | 1.71 | |||
| RSS | 193.508 | 209.624 | 282.537 | 296.065 | |||||||
| AICc | 1337.050 | 1415.986 | 1578.786 | 1625.135 | |||||||
| R2 | 0.805 | 0.788 | 0.715 | 0.701 | |||||||
| 调整后R2 | 0.791 | 0.773 | 0.714 | 0.700 | |||||||
注:Mean为变量系数估计均值;BW为MGWR模型中的带宽;Coef为变量系数;VIF为膨胀因子;RSS为残差平方和;AICc为修正的赤池正信息量准则;R2为拟合优度;*、**、***分别表示在P<0.1、P<0.05、P<0.01水平上显著。 |
| [1] |
中国新闻网. 《中国商贸物流发展报告(2022年)》发布[EB/OL]. [2023-06-17]. https://www.chinanews.com/m/cj/2023/06-17/10026870.shtml.
[China News Network. Release of the China Trade and Logistics Development Report (2022)[EB/OL]. [2023-06-17]. https://www.chinanews.com/m/cj/2023/06-17/10026870.shtml.]
|
| [2] |
|
| [3] |
|
| [4] |
|
| [5] |
李国旗, 金凤君, 陈娱, 等. 基于物流热度的中国物流业空间格局[J]. 地理科学进展, 2015, 34(5): 629-637.
[
|
| [6] |
|
| [7] |
|
| [8] |
|
| [9] |
张璐璐, 赵金丽, 宋金平. 京津冀城市群物流企业空间格局演化及影响因素[J]. 经济地理, 2019, 39(3): 125-133.
[
|
| [10] |
叶磊, 段学军. 基于物流企业的长三角地区城市网络结构[J]. 地理科学进展, 2016, 35(5): 622-631.
[
|
| [11] |
|
| [12] |
程秀娟, 李晶晶, 杨洁辉, 等. 河南省物流业空间格局——基于百度地图和面板数据[J]. 人文地理, 2018, 33(5): 114-122.
[
|
| [13] |
陈治亚, 周于轶. 基于POI的物流业空间集聚特征分析——以浙江省为例[J]. 铁道科学与工程学报, 2022, 19(10): 2862-2872.
[
|
| [14] |
|
| [15] |
|
| [16] |
|
| [17] |
|
| [18] |
张大鹏, 曹卫东, 姚兆钊, 等. 上海大都市区物流企业区位分布特征及其演化[J]. 长江流域资源与环境, 2018, 27(7): 1478-1489.
[
|
| [19] |
千庆兰, 陈颖彪, 李雁, 等. 广州市物流企业空间布局特征及其影响因素[J]. 地理研究, 2011, 30(7): 1254-1261.
[
|
| [20] |
王瑞, 蒋天颖, 王帅. 宁波市港口物流企业空间格局及区位选择[J]. 地理科学, 2018, 38(5): 691-698.
[
|
| [21] |
朱慧, 周根贵. 国际陆港物流企业空间格局演化及其影响因素——以义乌市为例[J]. 经济地理, 2017, 37(2): 98-105.
[
|
| [22] |
潘方杰, 王宏志, 宋明洁, 等. 基于GIS的中国A级物流企业时空演变特征及其影响因素[J]. 长江流域资源与环境, 2020, 29(10): 2186-2199.
[
|
| [23] |
张圣忠, 柴廷熠. 西安市物流企业空间格局演化及影响因素分析[J]. 世界地理研究, 2021, 30(6): 1275-1285.
[
|
| [24] |
曹卫东. 城市物流企业区位分布的空间格局及其演化——以苏州市为例[J]. 地理研究, 2011, 30(11): 1997-2007.
[
|
| [25] |
蒋天颖, 史亚男. 宁波市物流企业空间格局演化及影响因素[J]. 经济地理, 2015, 35(10): 130-138.
[
|
| [26] |
赵学伟, 张志斌, 冯斌, 等. 西北内陆中心城市物流企业空间分异及区位选择——以兰州市为例[J]. 干旱区地理, 2022, 45(5): 1671-1683.
[
|
| [27] |
沈静, 王少谷, 周楚平. 环境公正视角下广州市污染企业分布与区域人口社会特征的时空关系研究[J]. 地理研究, 2022, 41(1): 46-62.
[
|
| [28] |
谢永琴, 魏晓晨. 北京物流企业空间布局演化及影响因素分析[J]. 陕西师范大学学报(自然科学版), 2019, 47(2): 106-115.
[
|
| [29] |
李天宇, 陆林, 张海洲, 等. 长三角城市群A级物流企业空间演化特征及驱动因素[J]. 经济地理, 2021, 41(11): 157-166.
[
|
| [30] |
|
| [31] |
王劲峰, 徐成东. 地理探测器:原理与展望[J]. 地理学报, 2017, 72(1): 116-134.
[
|
| [32] |
王成金, 张梦天. 中国物流企业的布局特征与形成机制[J]. 地理科学进展, 2014, 33(1): 134-144.
[
|
| [33] |
周侃, 殷悦, 陈妤凡. 城市群水污染物排放的驱动因素及尺度效应[J]. 地理学报, 2022, 77(9): 2219-2235.
[
|
/
| 〈 |
|
〉 |