
|
张晓东(1980-),男,博士,高级工程师,主要从事环境遥感应用研究. E-mail: xiangrikui1540@163.com |
收稿日期: 2023-10-11
修回日期: 2023-11-08
网络出版日期: 2026-03-11
基金资助
宁夏回族自治区自然科学基金项目(2023AAC03772)
Spatiotemporal evolution characteristics and influencing factors of habitat quality in Yinchuan City by coupling InVEST and Geodetector models
Received date: 2023-10-11
Revised date: 2023-11-08
Online published: 2026-03-11
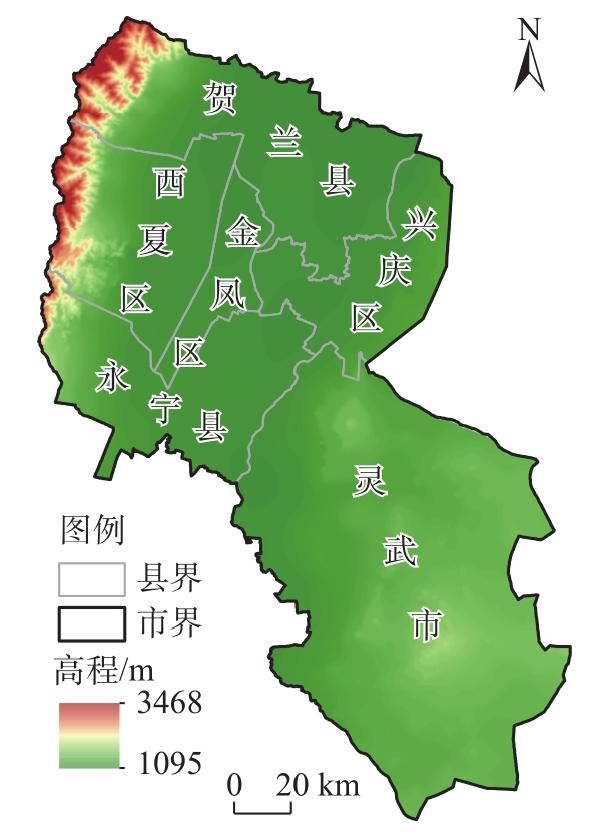
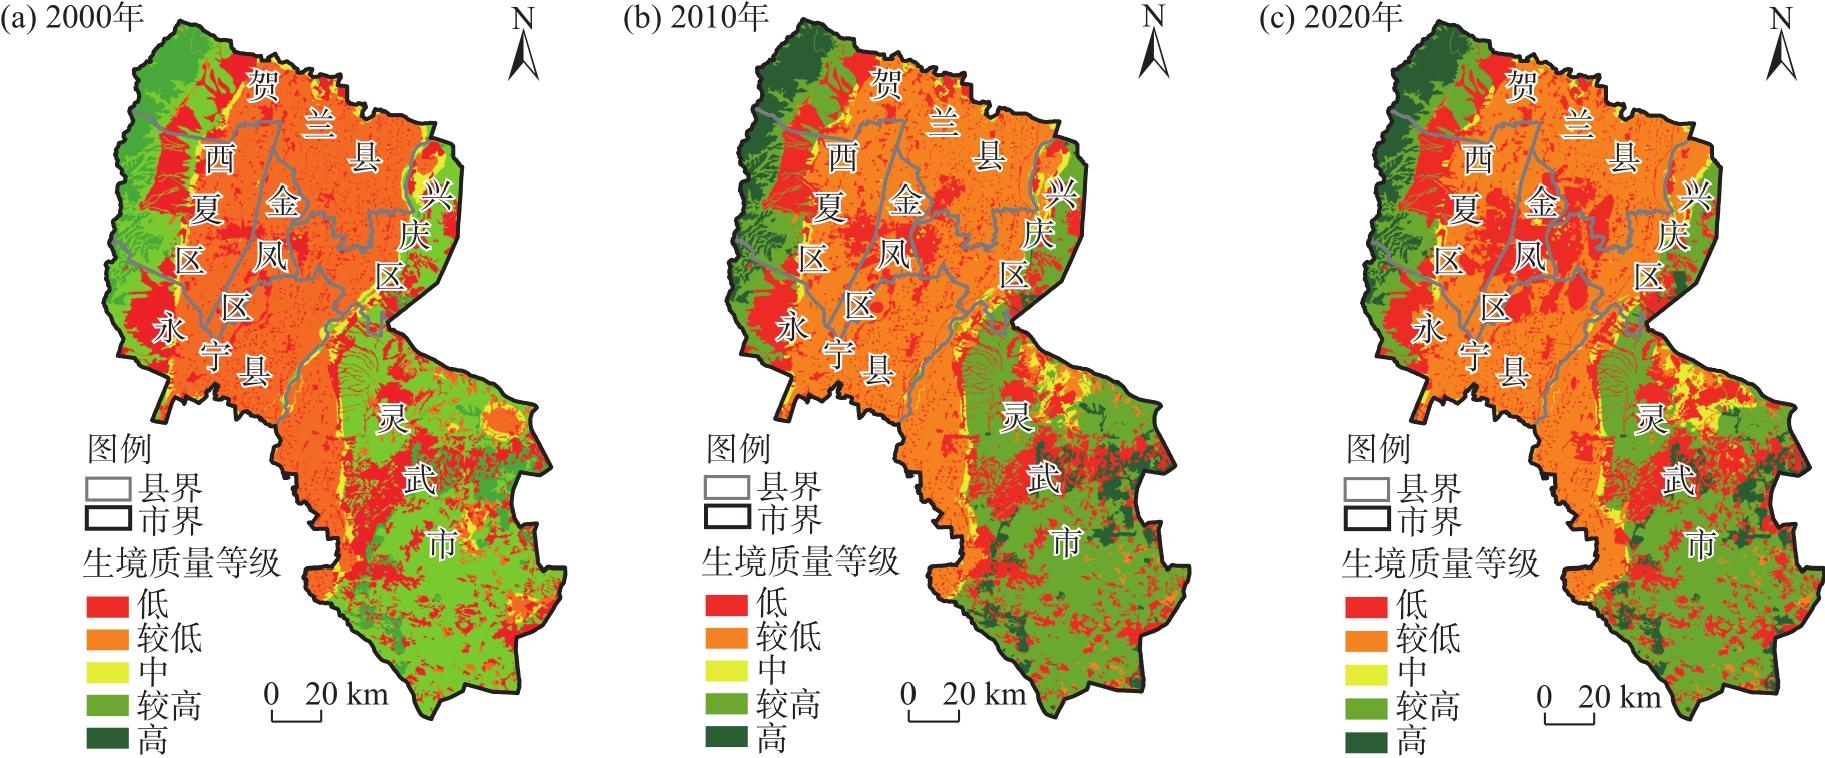
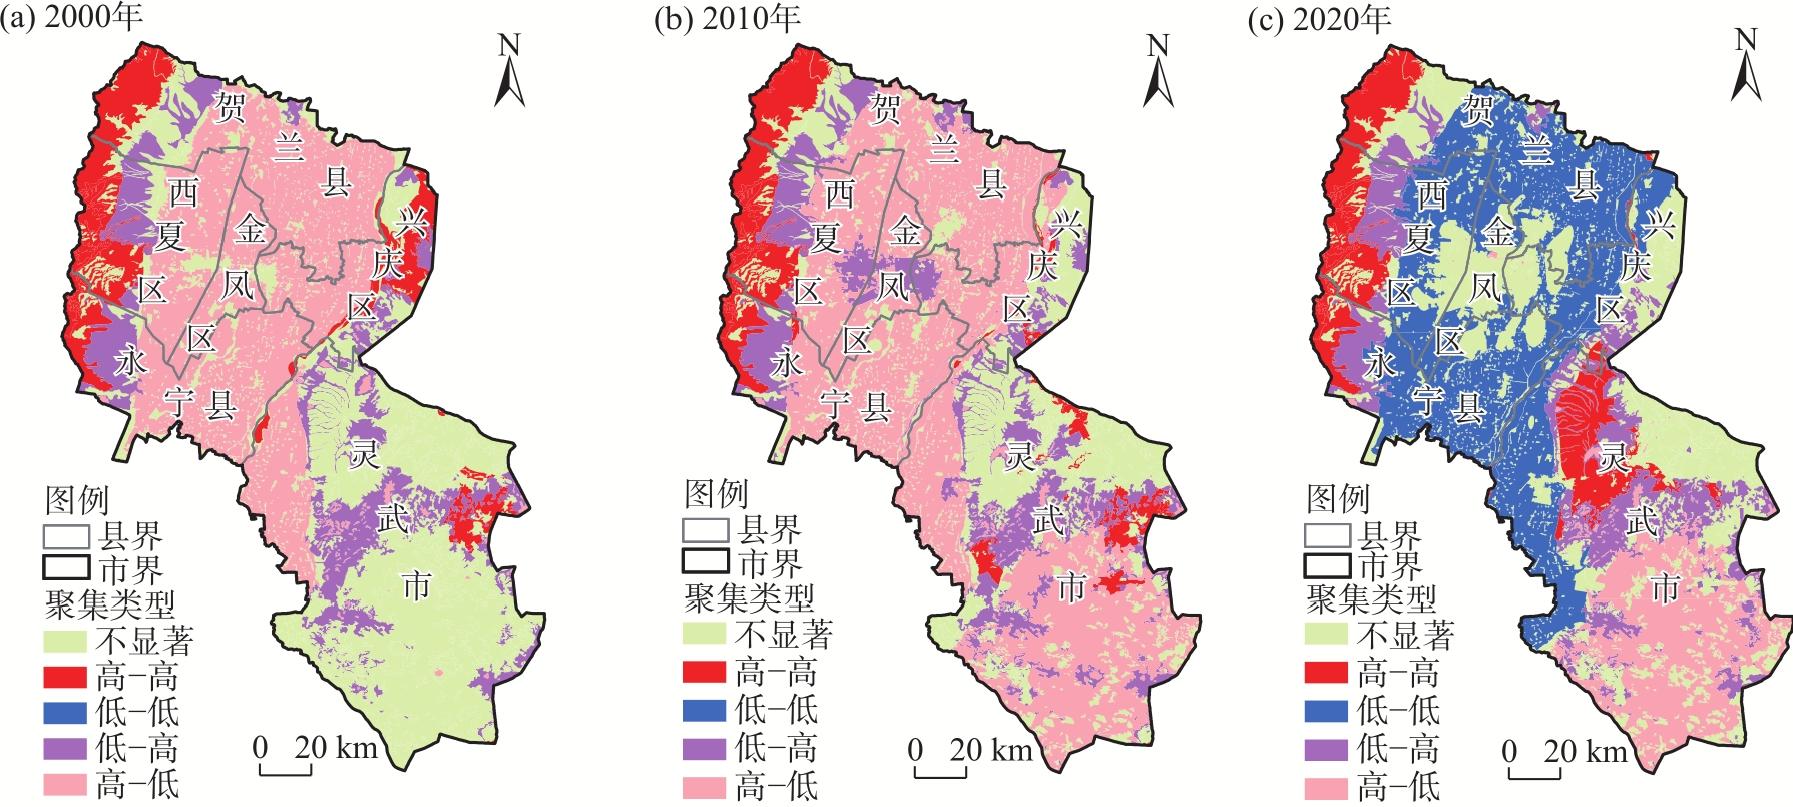
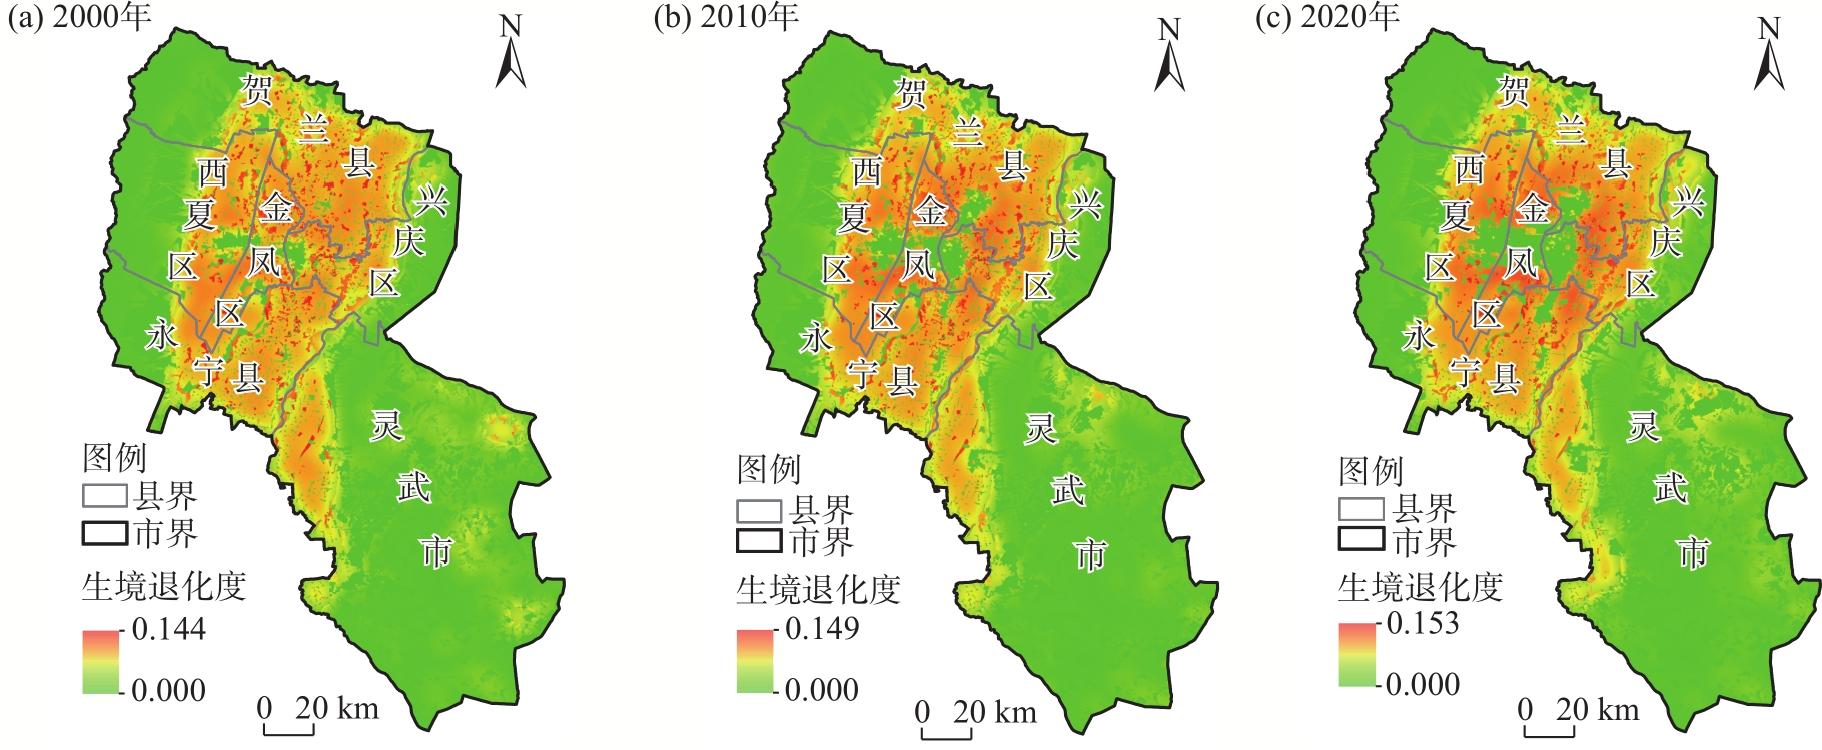
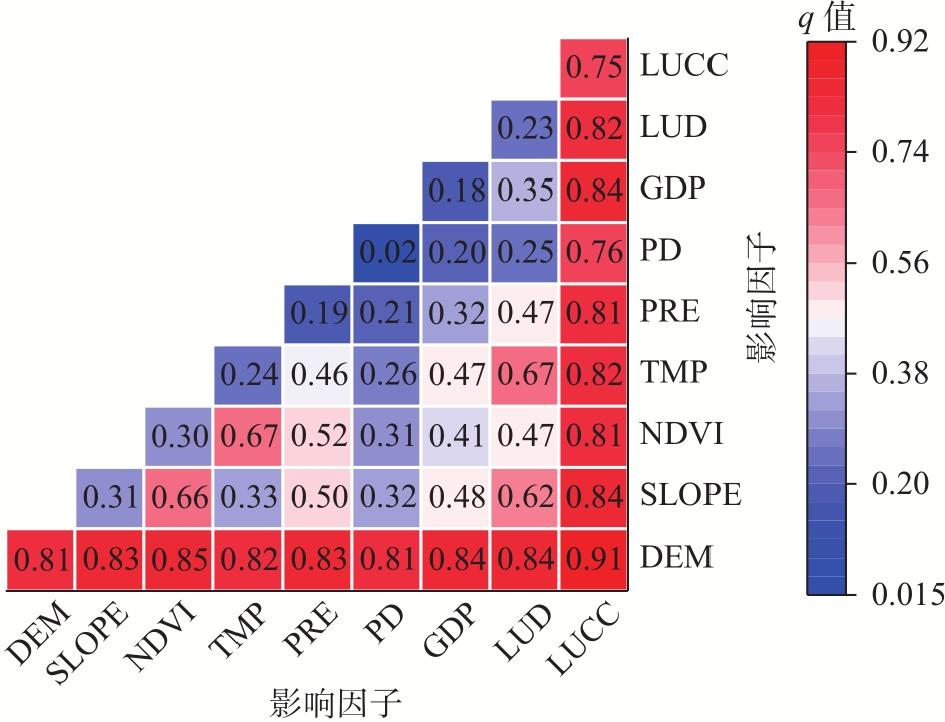
银川市作为黄河流域重要的水源涵养区及国家重点生态功能区,其生境质量关乎区域生态安全和可持续发展。然而,针对银川市生境质量及其影响因子仍需深入研究。基于2000、2010年和2020年3期土地利用数据,耦合InVEST和Geodetector模型估算银川市20 a间生境质量,对研究区生境质量空间分布特征及影响因子进行分析。结果表明:(1) 2000、2010年和2020年银川市平均生境质量指数分别为0.337、0.332和0.322,生境质量指数较低且20 a间略有下降,生境质量整体呈“南北高、中部低”的空间分布特征。(2) 银川市生境质量在空间上存在着较强的空间集聚效应,莫兰指数呈下降趋势,集聚程度逐渐下降。(3) 高程和土地利用类型是银川市生境质量的主要影响因子。各影响因子交互作用都存在增强效应,对生境质量的影响力随之增强,且以双因子增强为主,其次为非线性增强,其中高程与各因子的交互作用最为显著。研究结果可为银川市生态保护与高质量、可持续发展提供科学依据和决策支持。
张晓东 , 武丹 , 王莹 , 赵银鑫 , 马瑜 , 马玉学 , 倪海玲 . 耦合InVEST与Geodetector模型的银川市生境质量时空演变特征及影响因子研究[J]. 干旱区地理, 2024 , 47(7) : 1242 -1251 . DOI: 10.12118/j.issn.1000-6060.2023.563
As an essential water source conservation area and a fundamental national ecological functional area in the Yellow River Basin, Yinchuan City’s habitat quality is related to regional ecological security and sustainable development. However, further research is needed on the habitat quality and influencing factors in Yinchuan City of Ningxia, China. Based on three phases of land-use data from 2000, 2010, and 2020, as well as the habitat quality module of the InVEST model, Moran’s I index, and Geodetector, habitat quality was estimated and the spatial distribution characteristics were analyzed over the past 20 years. The impact of nine influencing factors, such as elevation, slope, and vegetation coverage, etc, on habitat quality was quantified. The results showed the following: (1) Yinchuan City’s average habitat quality index in 2000, 2010, and 2020 was 0.337, 0.332, and 0.322, respectively. The habitat quality index was low and slightly decreased over the past 20 years. The magnitude and proportion of habitat quality improvement are lower than those of deterioration, and the habitat quality exhibits a spatial distribution characteristic of high in the north and south, and low in the middle. (2) Habitat quality has a strong spatial agglomeration effect in space, and Moran’s I index shows a downward trend. The degree of spatial autocorrelation of habitat quality has weakened, and agglomeration has gradually decreased. The LISA clustering map results show that the areas that have changed over the past 20 years primarily include the central and northern parts of the study area, with high-low clustering areas changing to low-low clustering areas. (3) Elevation and land-use type are the primary factors influencing habitat quality in Yinchuan City. The interplay of various influencing factors showed that the enhancement effect on habitat quality increases accordingly, primarily with a dual-factor enhancement, followed by a nonlinear enhancement. The interaction between elevation and various factors emerges as the most significant contributor. The results provide a scientific basis and support for decision-making for ecological protection and high-quality and sustainable development in Yinchuan City.
Key words: InVEST model; habitat quality; Geodetector; Yinchuan City
表1 研究区数据源Tab. 1 Data sources of the study area |
| 数据类型 | 数据来源 | 数据说明 |
|---|---|---|
| 土地利用数据 | 中国科学院资源环境科学数据中心(http://www.resdc.cn),空间分辨率为30 m | 土地利用类型主要依据全国《土地利用现状分类》(GB/T 2010—2017),并结合研究区生态环境现状将其分为 耕地、林地、草地、水域、建设用地及未利用地6类,用于 银川市生境质量评估和生境质量影响因子分析 |
| 高程 | 地理空间数据云(https://www.gscloud.cn) | 用于生境质量影响因子分析 |
| 归一化植被指数 | 地理空间数据云(https://www.gscloud.cn) | 用于生境质量影响因子分析 |
| 坡度 | 由DEM数据计算获得 | 用于生境质量影响因子分析 |
| 气温 | 国家地球系统科学数据中心(https://www.geodata.cn) | 用于生境质量影响因子分析 |
| 降水 | 国家地球系统科学数据中心(https://www.geodata.cn) | 用于生境质量影响因子分析 |
| 人口密度 | Worldpop网站(http://www.worldpop.org) | 用于生境质量影响因子分析 |
| 地区生产总值 | 中国科学院资源环境科学数据中心(http://www.resdc.cn) | 用于生境质量影响因子分析 |
| 土地利用程度 | 文献[16] | 用于生境质量影响因子分析 |
表2 威胁因子属性Tab. 2 Threat factor attributes |
| 威胁因子 | 最大影响距离/km | 权重 | 衰减线性相关性 |
|---|---|---|---|
| 耕地 | 4 | 0.7 | 线性 |
| 城镇用地 | 8 | 1.0 | 指数 |
| 农村居民点 | 7 | 0.8 | 指数 |
| 其他建设用地 | 6 | 0.6 | 线性 |
| 未利用地 | 4 | 0.3 | 线性 |
表3 生境适宜度及其对威胁因子的敏感度Tab. 3 Habitat suitability and its sensitivity to threat factors |
| 地类编码 | 类型 | 生境适宜度 | 威胁因子 | ||||
|---|---|---|---|---|---|---|---|
| 耕地 | 城镇用地 | 农村居民点 | 其他建设用地 | 未利用地 | |||
| 11 | 水田 | 0.40 | 0.30 | 0.70 | 0.60 | 0.60 | 0.20 |
| 12 | 旱地 | 0.30 | 0.30 | 0.60 | 0.50 | 0.50 | 0.20 |
| 21 | 有林地 | 1.00 | 0.70 | 0.80 | 0.80 | 0.80 | 0.30 |
| 22 | 灌木林 | 0.90 | 0.60 | 0.75 | 0.70 | 0.70 | 0.30 |
| 23 | 疏林地 | 0.80 | 0.60 | 0.70 | 0.70 | 0.70 | 0.20 |
| 24 | 其他林地 | 0.60 | 0.50 | 0.65 | 0.65 | 0.70 | 0.20 |
| 31 | 高覆盖草地 | 0.90 | 0.60 | 0.60 | 0.60 | 0.65 | 0.20 |
| 32 | 中覆盖草地 | 0.70 | 0.55 | 0.55 | 0.55 | 0.60 | 0.10 |
| 33 | 低覆盖草地 | 0.60 | 0.50 | 0.50 | 0.50 | 0.60 | 0.10 |
| 41 | 河渠 | 0.90 | 0.50 | 0.70 | 0.60 | 0.50 | 0.30 |
| 42 | 湖泊 | 0.90 | 0.50 | 0.70 | 0.60 | 0.50 | 0.30 |
| 43 | 水库坑塘 | 0.80 | 0.50 | 0.60 | 0.50 | 0.50 | 0.20 |
| 46 | 滩地 | 0.60 | 0.20 | 0.20 | 0.20 | 0.20 | 0.20 |
| 51 | 城镇用地 | 0.00 | 0.00 | 0.00 | 0.00 | 0.00 | 0.00 |
| 52 | 农村居民点 | 0.00 | 0.00 | 0.00 | 0.00 | 0.00 | 0.00 |
| 53 | 其他建设用地 | 0.00 | 0.00 | 0.00 | 0.00 | 0.00 | 0.00 |
| 61 | 沙地 | 0.00 | 0.00 | 0.00 | 0.00 | 0.00 | 0.00 |
| 62 | 戈壁 | 0.00 | 0.00 | 0.00 | 0.00 | 0.00 | 0.00 |
| 63 | 盐碱地 | 0.00 | 0.00 | 0.00 | 0.00 | 0.00 | 0.00 |
| 64 | 沼泽地 | 0.60 | 0.40 | 0.60 | 0.50 | 0.30 | 0.20 |
| 65 | 裸土地 | 0.00 | 0.00 | 0.00 | 0.00 | 0.00 | 0.00 |
| 66 | 裸岩石砾地 | 0.00 | 0.00 | 0.00 | 0.00 | 0.00 | 0.00 |
表4 2000—2020年银川市生境质量等级面积变化Tab. 4 Area changes of habitat quality grades in Yinchuan City from 2000 to 2020 |
| 生境质量等级 | 2000年 | 2010年 | 2020年 | |||||
|---|---|---|---|---|---|---|---|---|
| 面积/km2 | 比例/% | 面积/km2 | 比例/% | 面积/km2 | 比例/% | |||
| 低 | 1510.64 | 21.73 | 1623.91 | 23.36 | 1930.70 | 27.78 | ||
| 较低 | 2647.92 | 38.09 | 2535.11 | 36.47 | 2377.61 | 34.20 | ||
| 中 | 247.88 | 3.57 | 217.47 | 3.13 | 244.56 | 3.52 | ||
| 较高 | 2004.25 | 28.83 | 2016.79 | 29.01 | 1869.37 | 26.89 | ||
| 高 | 540.64 | 7.78 | 558.05 | 8.03 | 529.09 | 7.61 | ||
| 总计 | 6951.33 | 100.00 | 6951.33 | 100.00 | 6951.33 | 100.00 | ||
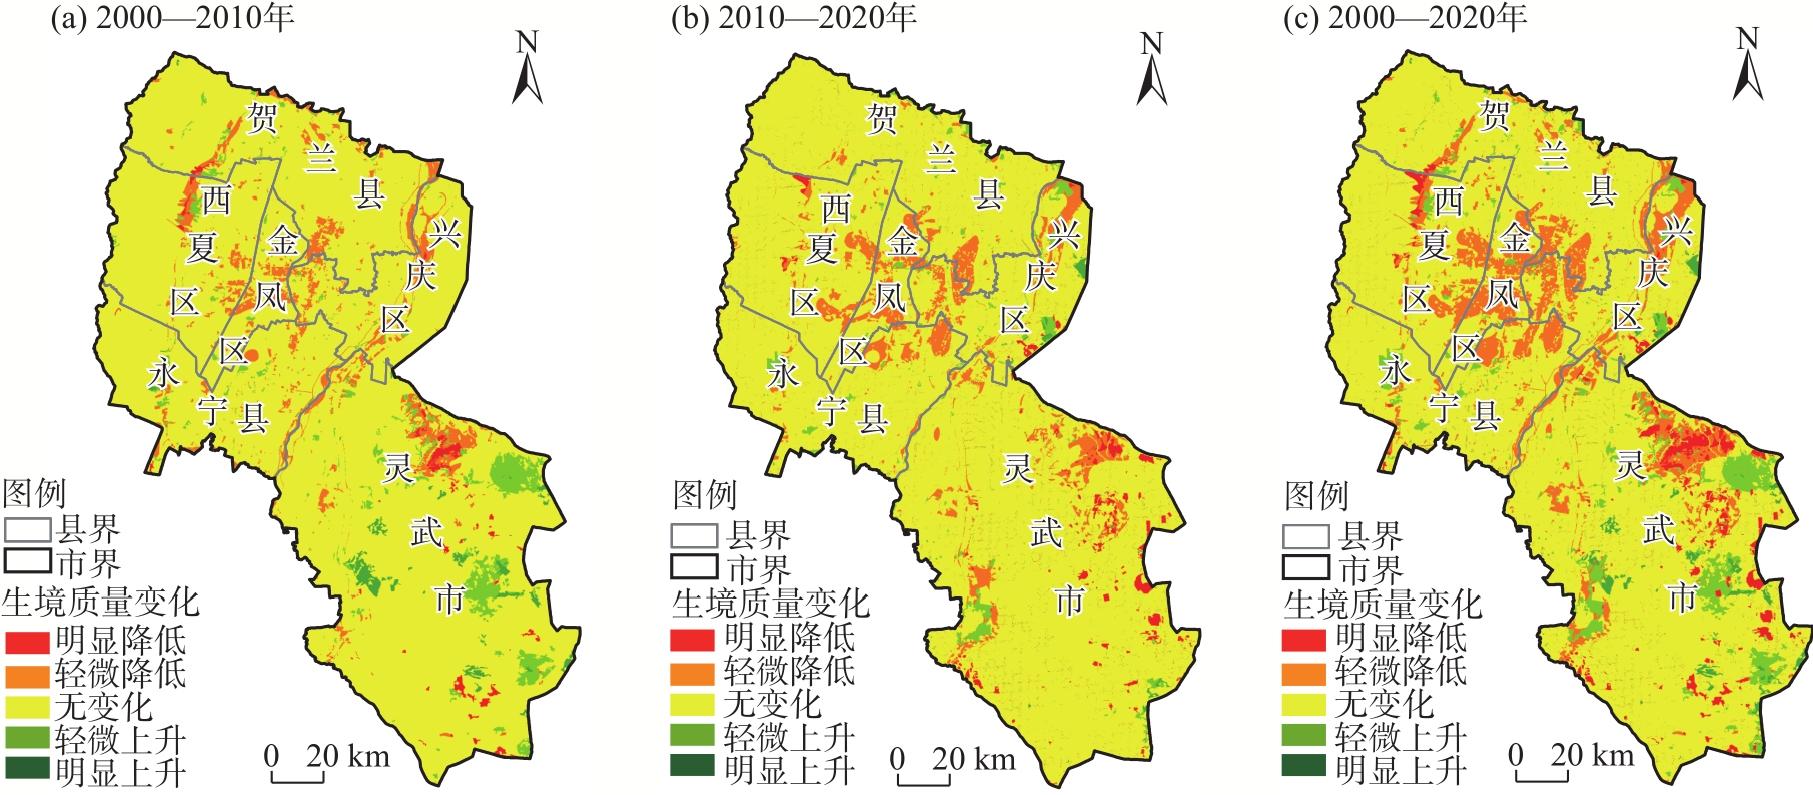
图3 2000—2020年银川市不同时期生境质量变化Fig. 3 Habitat quality changes at different periods in Yinchuan City from 2000 to 2020 |
表5 2000-2020年银川市不同时期生境质量面积变化Tab. 5 Area changes of habitat quality of Yinchuan City at different periods from 2000 to 2020 |
| 等级 | 级差 | 2000—2010年 | 2010—2020年 | 2000—2020年 | |||||
|---|---|---|---|---|---|---|---|---|---|
| 面积/km2 | 比例/% | 面积/km2 | 比例/% | 面积/km2 | 比例/% | ||||
| 明显降低 | -4、-3 | 55.83 | 0.80 | 115.27 | 1.66 | 188.23 | 2.71 | ||
| 轻微降低 | -2、-1 | 440.35 | 6.33 | 522.79 | 7.52 | 824.97 | 11.87 | ||
| 无明显变化 | 0 | 6120.54 | 88.06 | 6117.17 | 88.00 | 5486.23 | 78.92 | ||
| 轻微上升 | 1、2 | 267.27 | 3.84 | 163.70 | 2.35 | 365.16 | 5.25 | ||
| 明显上升 | 3、4 | 67.35 | 0.97 | 32.40 | 0.47 | 86.74 | 1.25 | ||
表6 2000-2020年银川市生境质量等级转移矩阵Tab. 6 Transition matrix of habitat quality grades in Yinchuan City from 2000 to 2020 /% |
| 生境质量等级 | 2000年 | |||||
|---|---|---|---|---|---|---|
| 低 | 较低 | 中 | 较高 | 高 | ||
| 2020年 | 低 | 84.03 | 17.34 | 6.61 | 7.87 | 5.17 |
| 较低 | 9.34 | 77.67 | 9.70 | 2.94 | 0.45 | |
| 中 | 1.07 | 0.77 | 67.75 | 6.37 | 1.28 | |
| 较高 | 4.33 | 4.12 | 14.50 | 80.88 | 7.00 | |
| 高 | 1.23 | 0.10 | 1.44 | 1.94 | 86.10 | |
| [1] |
|
| [2] |
|
| [3] |
|
| [4] |
吴健生, 曹祺文, 石淑芹, 等. 基于土地利用变化的京津冀生境质量时空演变[J]. 应用生态学报, 2015, 26(11): 3457-3466.
[
|
| [5] |
郑贱成, 谢炳庚, 游细斌. 基于土地利用变化的广东省生境质量时空演变特征[J]. 生态学报, 2022, 42(17): 6997-7010.
[
|
| [6] |
如克亚·热合曼, 阿里木江·卡斯木, 哈力木拉提·阿布来提, 等. 基于InVEST模型的天山北坡城市群生境质量时空演化研究[J]. 生态与农村环境学报, 2022, 38(9): 1112-1121.
[
|
| [7] |
提杨, 庄鸿飞, 陈敏豪, 等. 天津市自然保护地与区域生境质量的时空演变格局[J]. 生态学报, 2023, 43(7): 2770-2780.
[
|
| [8] |
|
| [9] |
粟一帆, 李卫明, 李金京, 等. 桥边河大型底栖动物生境适宜性[J]. 生态学报, 2020, 40(16): 5844-5854.
[
|
| [10] |
赵庆建, 吴晓珍. 基于InVEST模型的岷江流域土地利用变化对生境质量的影响研究[J]. 生态科学, 2022, 41(6): 1-10.
[
|
| [11] |
刘晓娟, 黎夏, 梁迅, 等. 基于FLUS-InVEST模型的中国未来土地利用变化及其对碳储量影响的模拟[J]. 热带地理, 2019, 39(3): 397-409.
[
|
| [12] |
王琦琨, 武玮, 杨雪琪, 等. 陕西省生境质量时空演变及驱动机制分析[J]. 干旱区研究, 2022, 39(5): 1684-1694.
[
|
| [13] |
谢怡凡, 姚顺波, 邓元杰, 等. 延安市退耕还林(草)工程对生境质量时空格局的影响[J]. 中国生态农业学报, 2020, 28(4): 575-586.
[
|
| [14] |
王鹏, 秦思彤, 胡慧蓉. 近30 a拉萨河流域土地利用变化和生境质量的时空演变特征[J]. 干旱区研究, 2023, 40(3): 492-503.
[
|
| [15] |
杨映, 胡理乐. 北京市房山区自然保护地生境质量评估[J]. 西部林业科学, 2022, 51(4): 80-86.
[
|
| [16] |
张晓东, 刘乃静, 赵银鑫, 等. 银川市2000—2020年土地利用时空变化特征及预测[J]. 科学技术与工程, 2021, 21(24): 10156-10164.
[
|
| [17] |
程静, 王鹏, 陈红翔, 等. 渭河流域生境质量时空演变及其地形梯度效应与影响因素[J]. 干旱区地理, 2023, 46(3): 481-491.
[
|
| [18] |
张海涛, 李加林, 田鹏, 等. 基于土地利用变化的东海区大陆海岸带生境质量时空演变研究[J]. 生态学报, 2023, 43(3): 937-947.
[
|
| [19] |
陈慧敏, 赵宇, 付晓, 等. 西辽河上游生境质量时空演变特征与影响机制[J]. 生态学报, 2023, 43(3): 948-961.
[
|
| [20] |
王晶, 胡一, 李鹏, 等. 治沟造地背景下延安市生境质量时空演变特征[J]. 生态学报, 2022, 42(23): 9808-9819.
[
|
| [21] |
陈实, 黄银兰, 金云翔. 退耕还林(草)工程实施前后黄河中游生境质量时空变化分析[J]. 干旱区研究, 2023, 40(3): 456-468.
[
|
| [22] |
左昕弘, 赖佳鑫, 刘峰, 等. 基于地统计学和空间自相关的土壤有机质空间异质性分析及分区:土地整治视角[J]. 中国农业资源与区划, 2022, 43(3): 240-252.
[
|
| [23] |
王劲峰, 徐成东. 地理探测器: 原理与展望[J]. 地理学报, 2017, 72(1): 116-134.
[
|
| [24] |
王波. 银川市生态系统服务价值时空演变及预测研究[D]. 兰州: 兰州大学, 2022.
[
|
| [25] |
张晓东, 赵志鹏, 赵银鑫, 等. 银川市景观生态风险评价与生态安全格局优化构建[J]. 干旱区地理, 2022, 45(5): 1626-1636.
[
|
/
| 〈 |
|
〉 |