
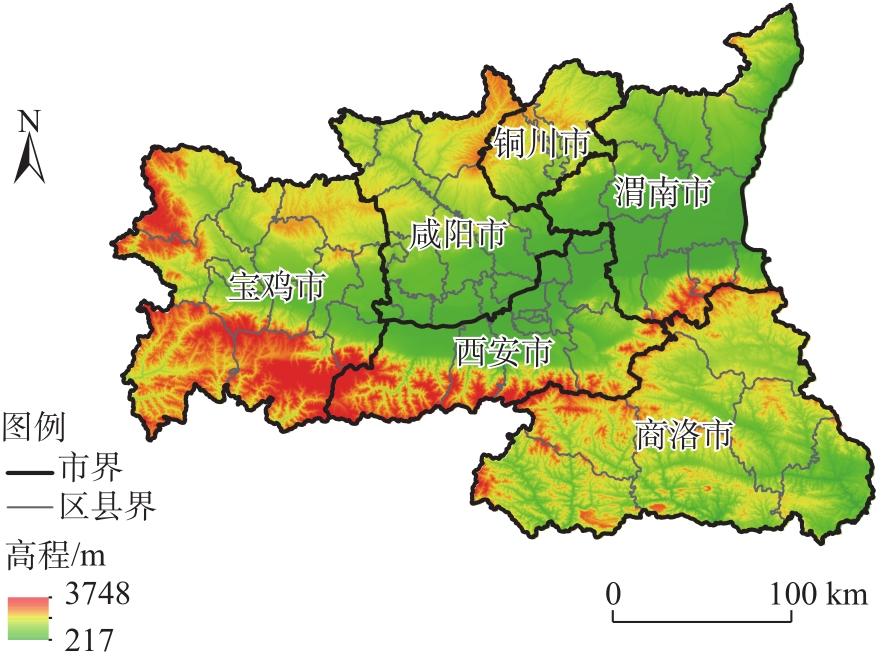
关中地区人类活动强度与地表温度的时空关联特征及其驱动作用
|
纪王迪(2000-),女,硕士研究生,主要从事城市热环境与脆弱性研究. E-mail: jwangd2000@163.com |
收稿日期: 2023-06-07
修回日期: 2023-09-14
网络出版日期: 2026-03-11
基金资助
国家自然科学基金(41971178)
Spatiotemporal correlation characteristics and driving forces of human activity intensity and surface temperature in the Guanzhong area
Received date: 2023-06-07
Revised date: 2023-09-14
Online published: 2026-03-11
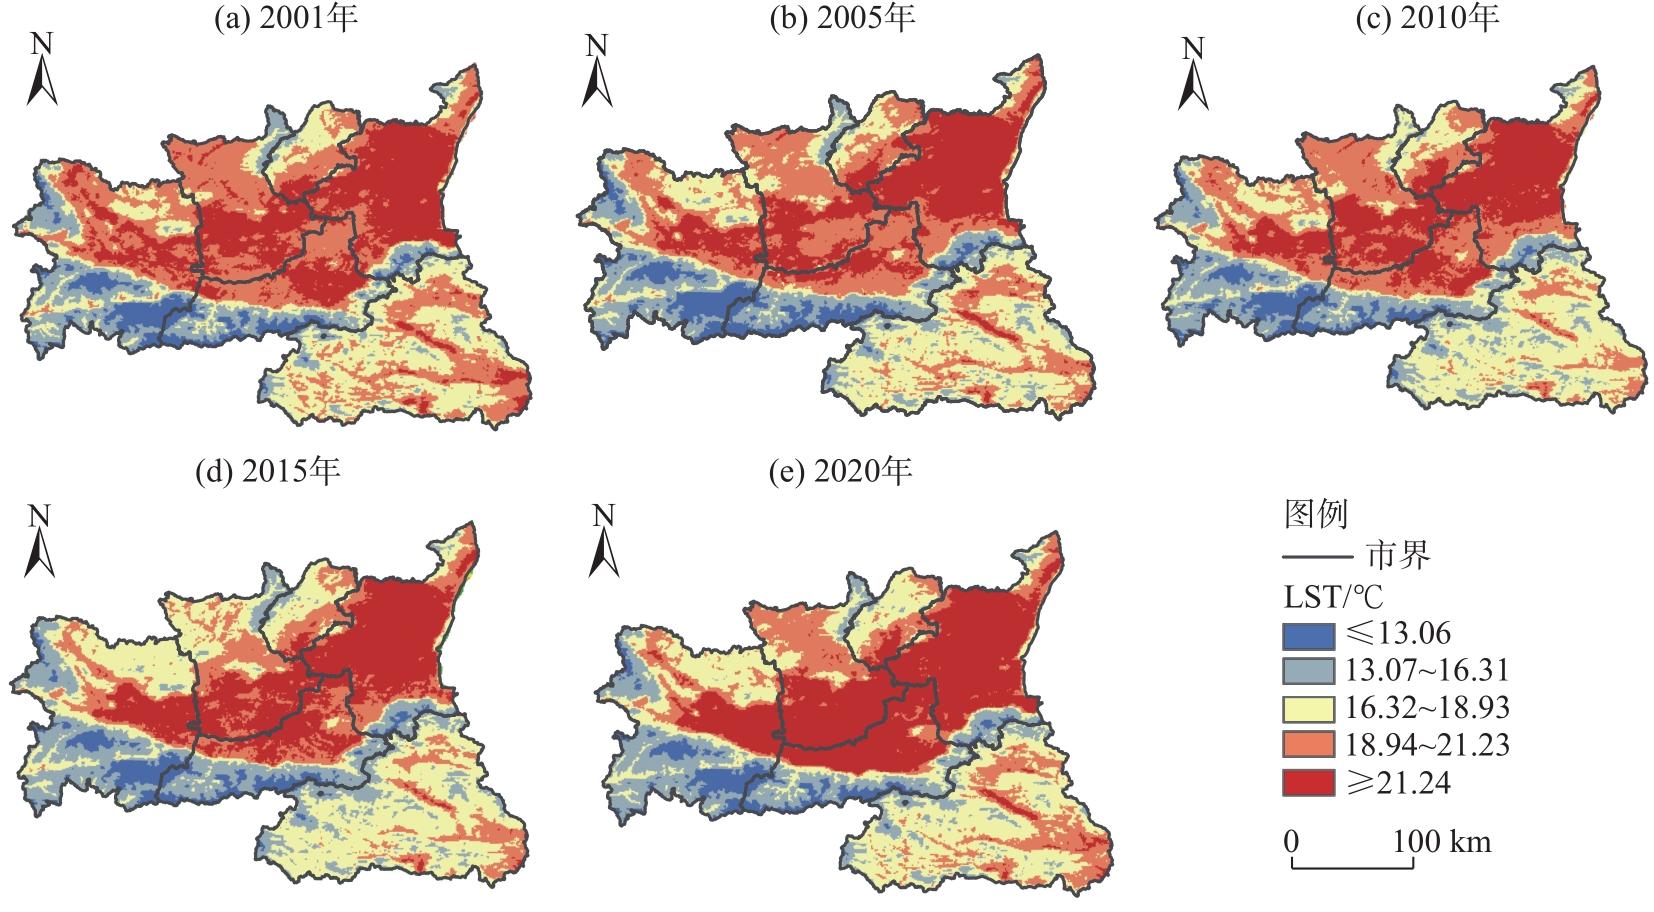
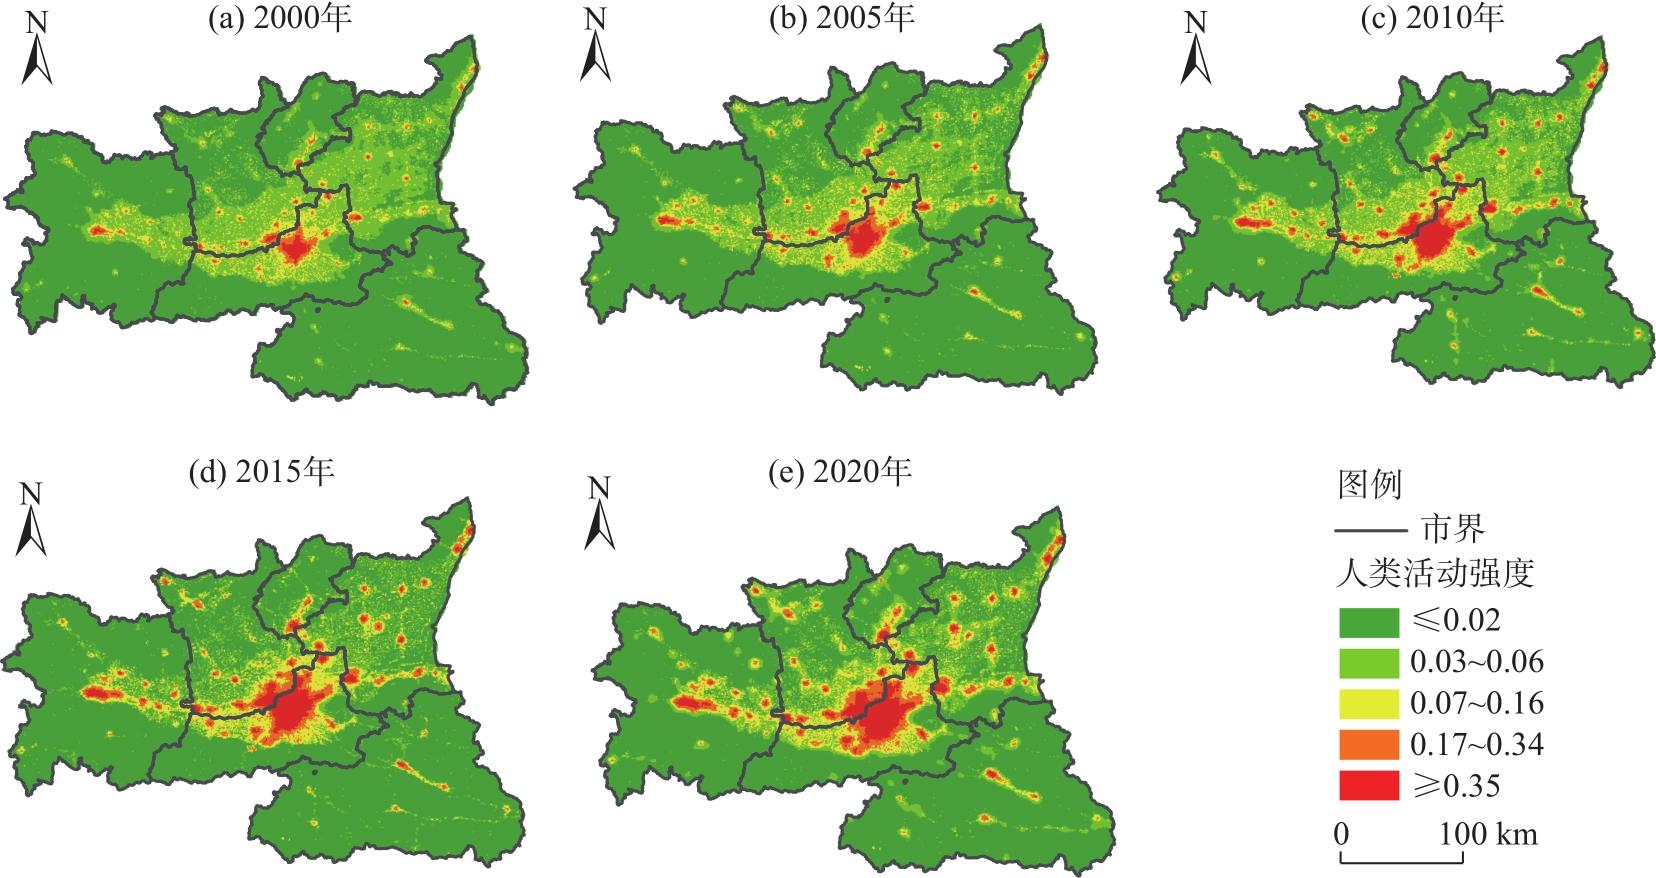
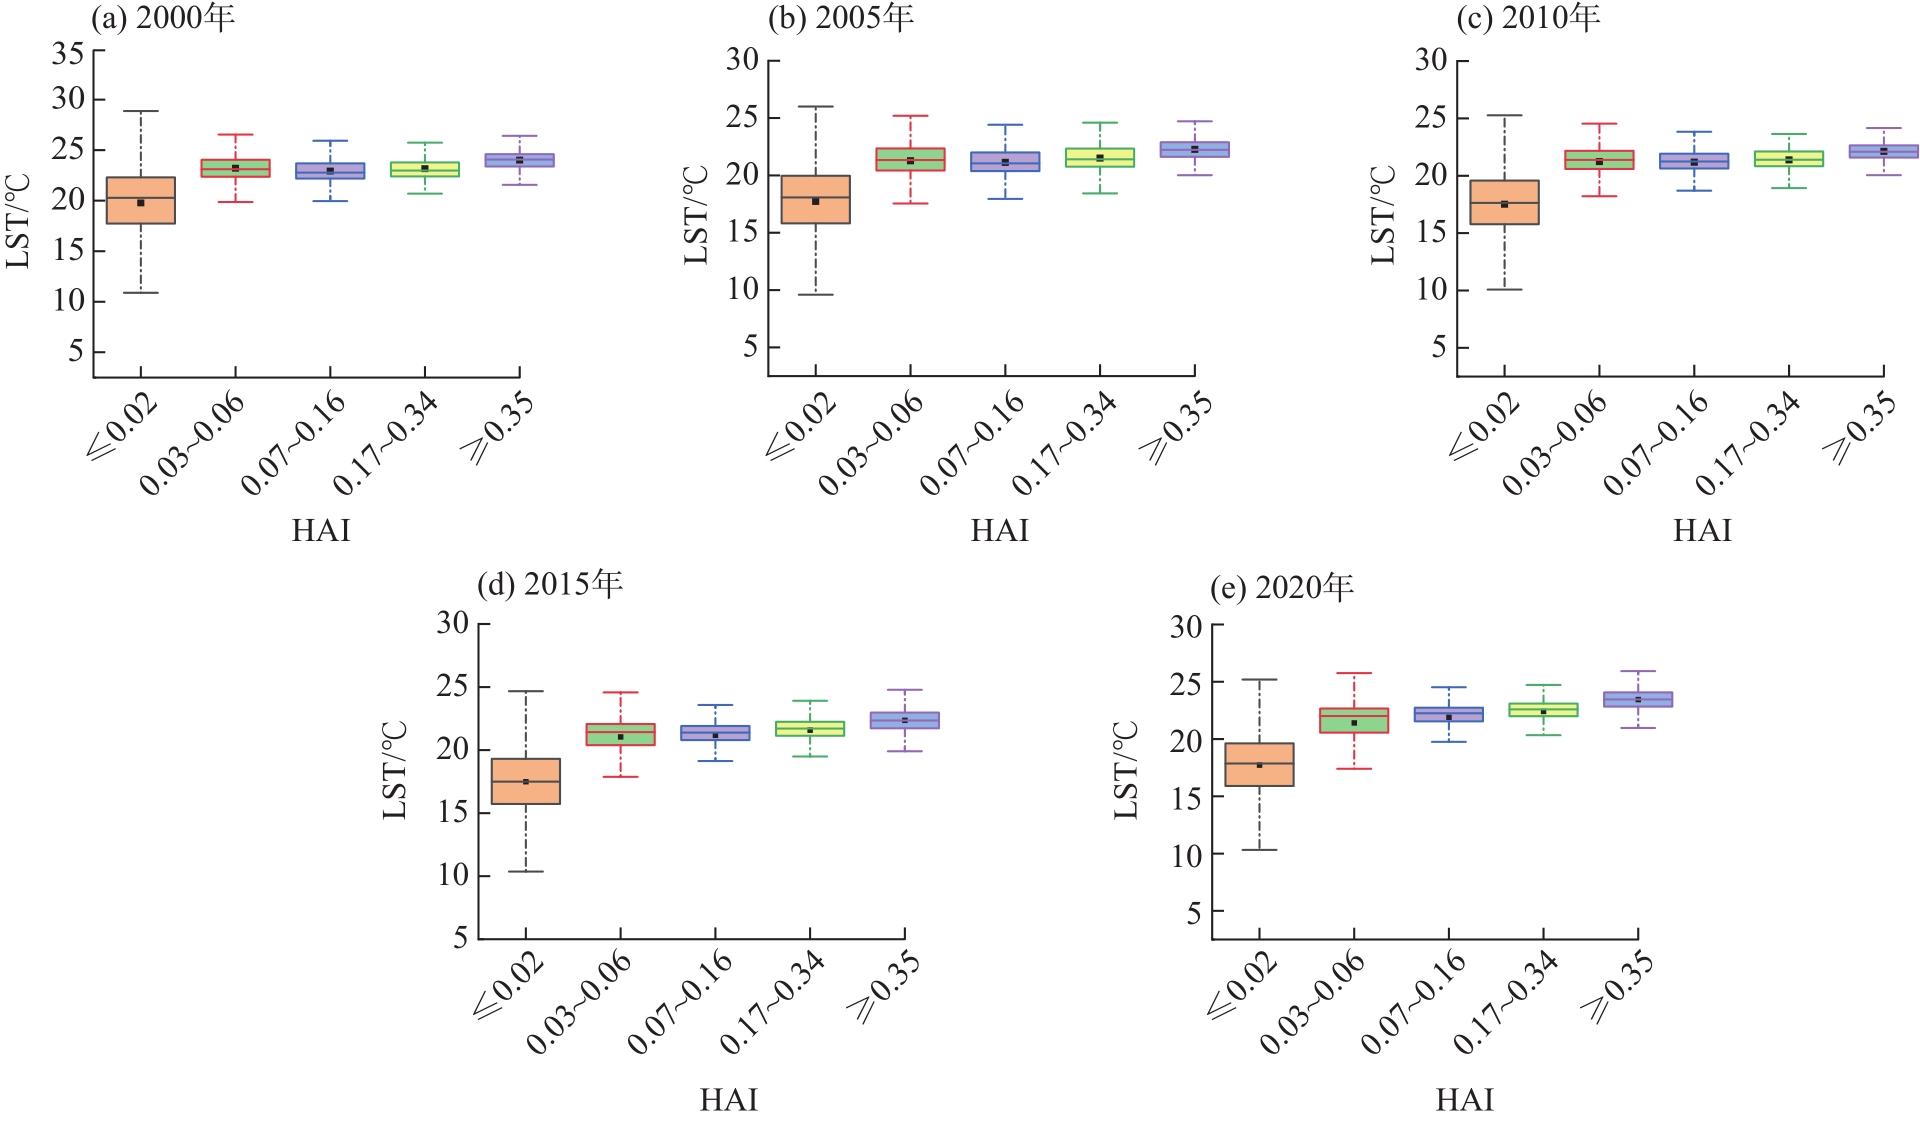
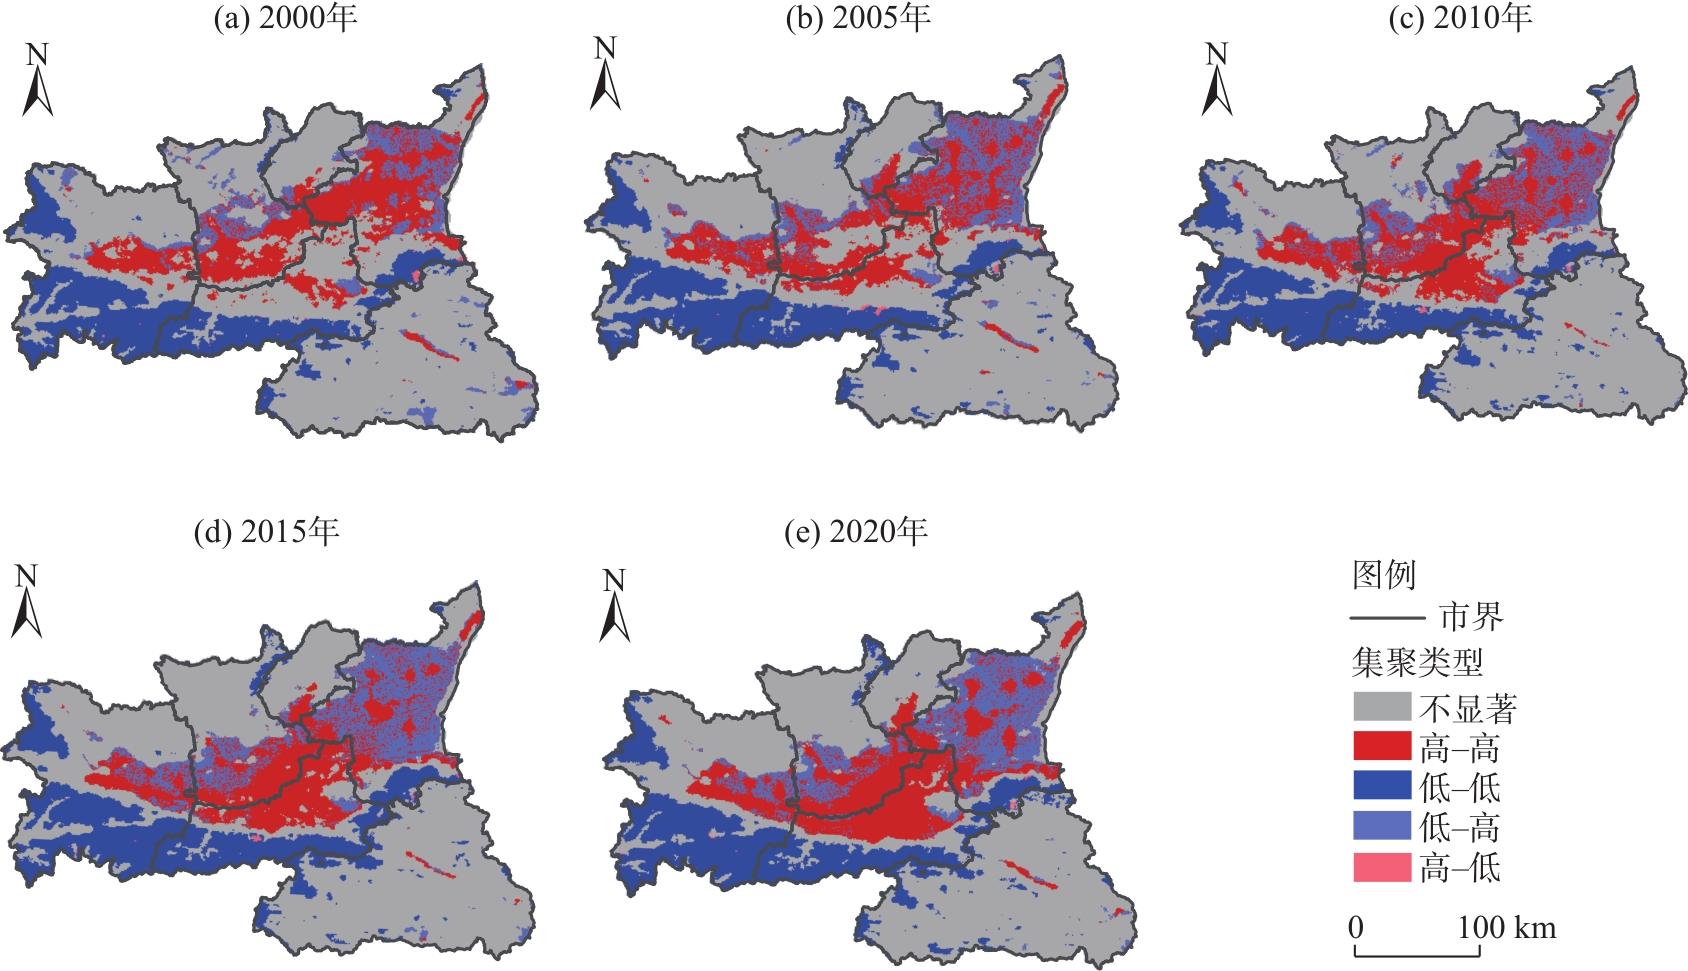
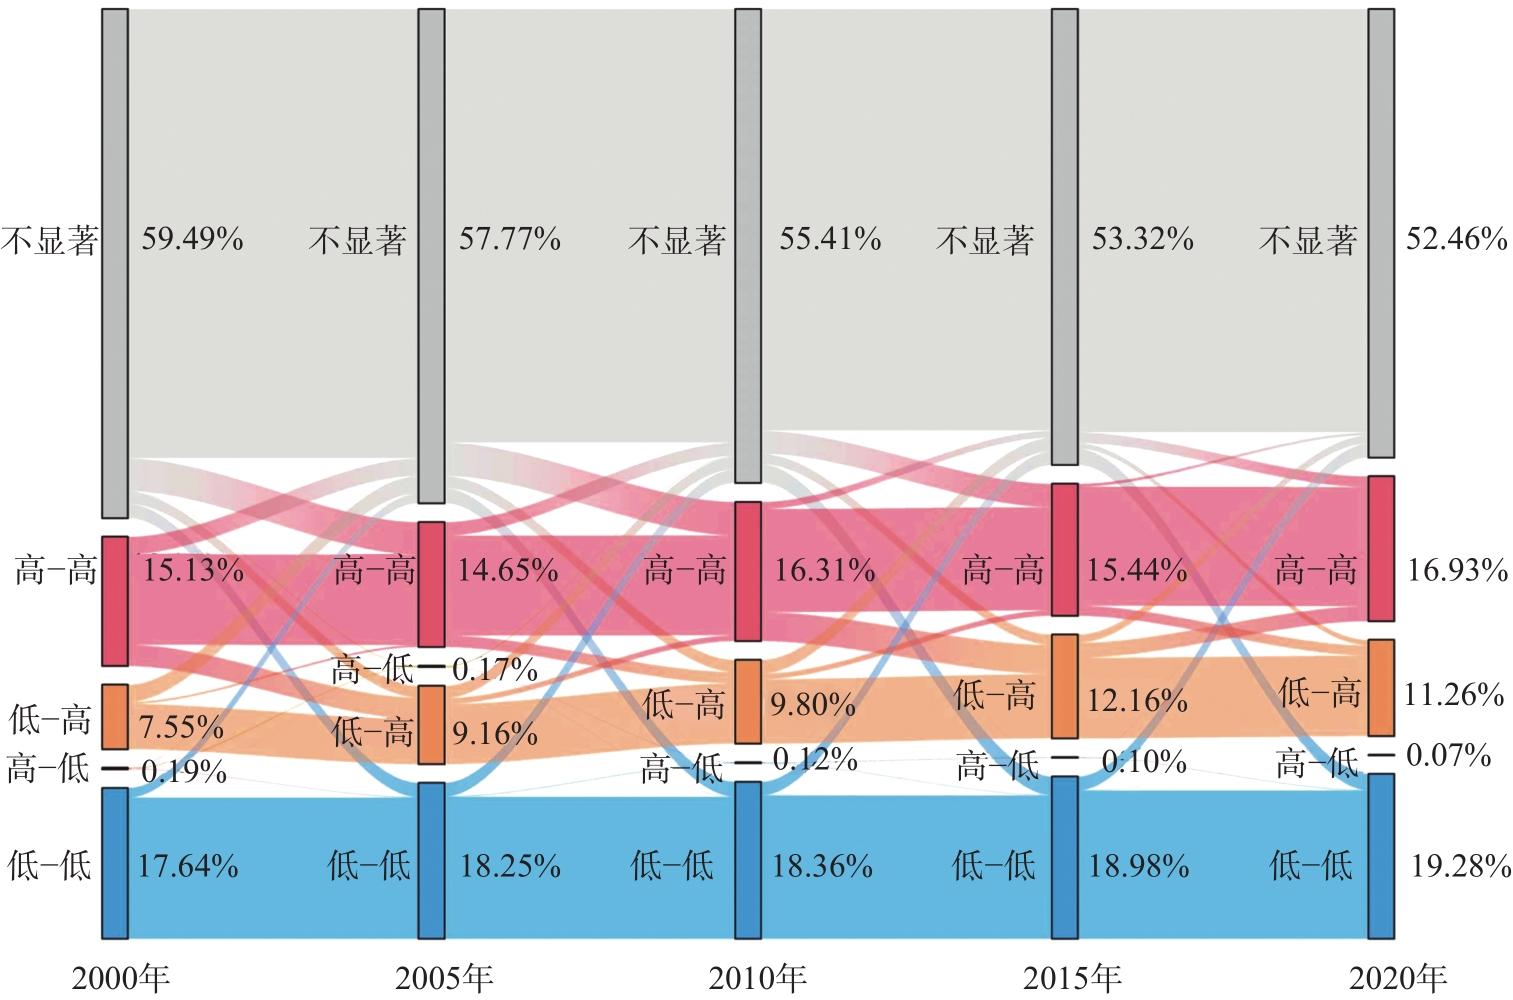
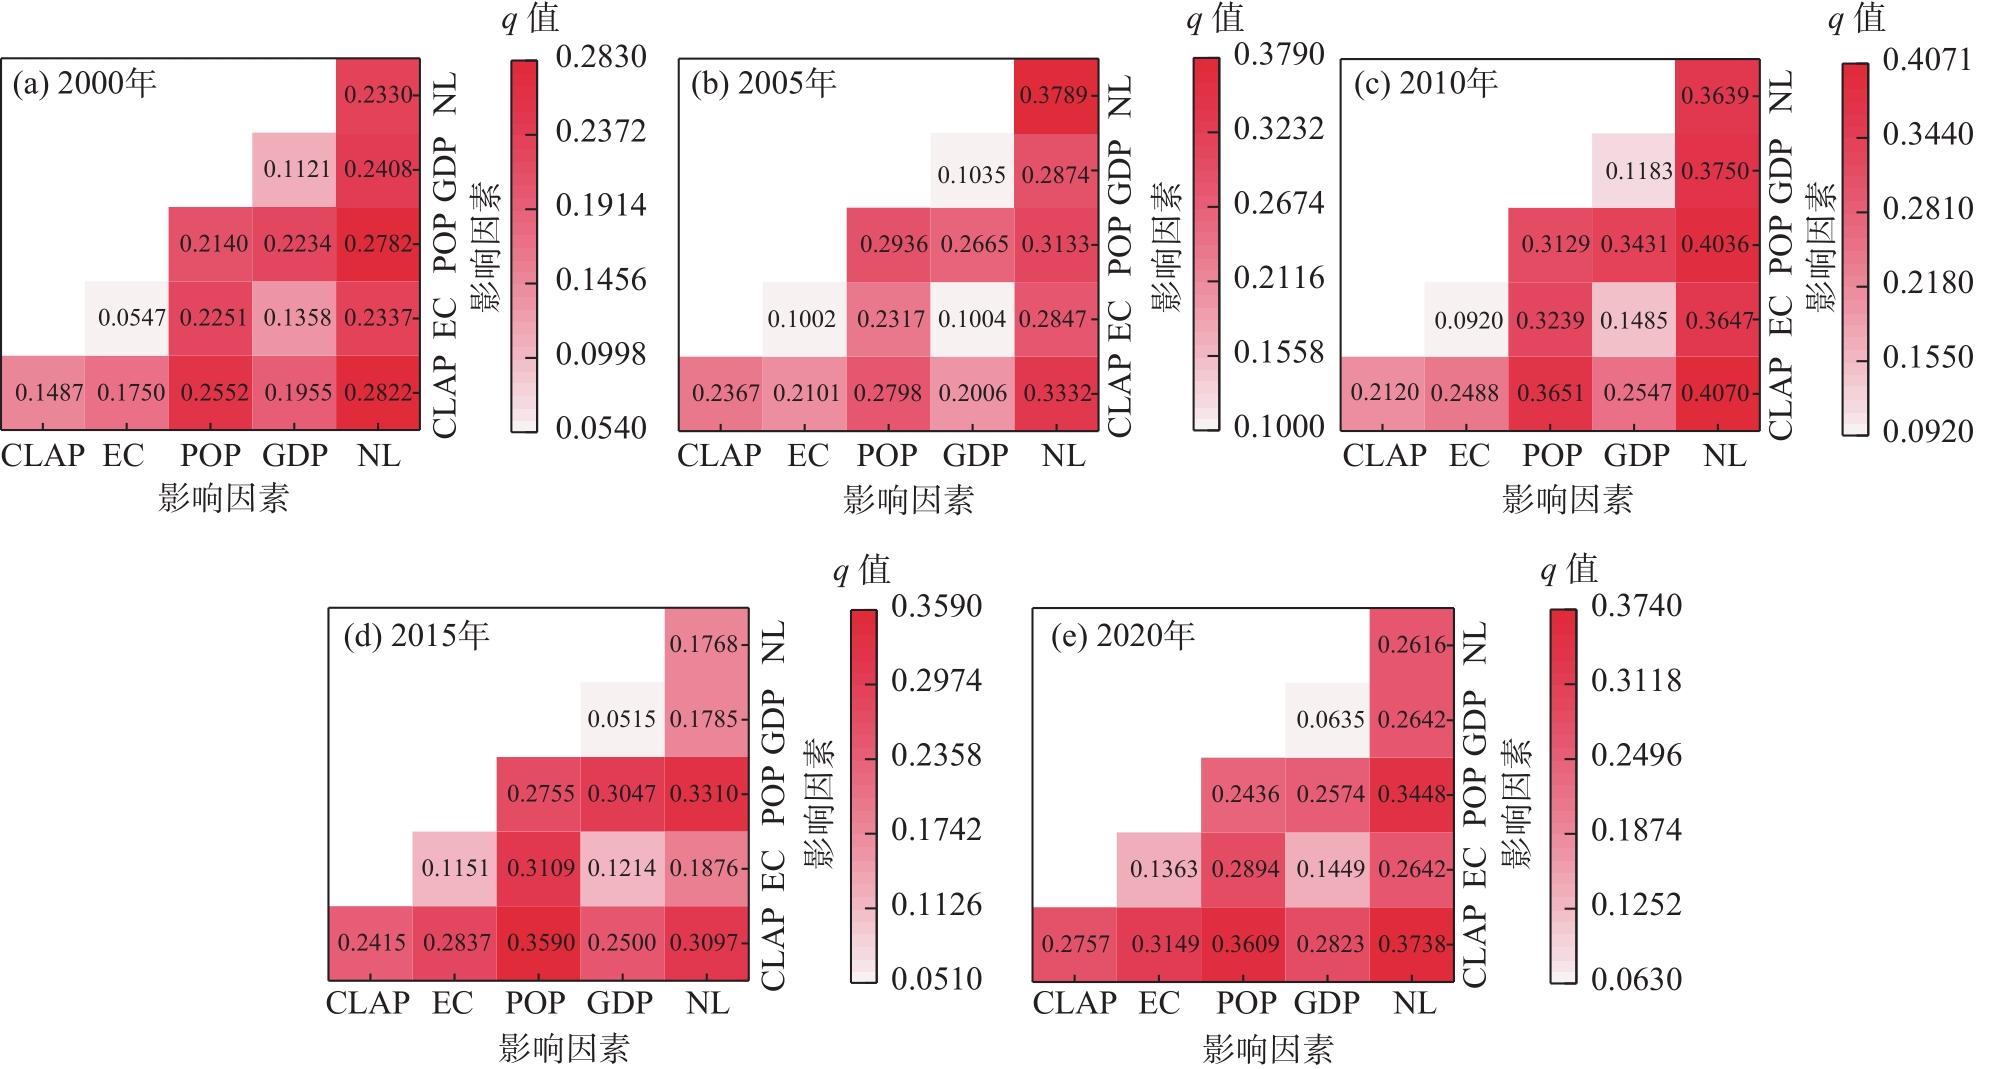
人类活动对全球温度升高的促进作用愈加明显,如何科学衡量人类活动强度并探究其与地表温度的时空关联性成为当前研究热题。以关中地区为例,整合人口密度、地区生产总值、夜间灯光强度、建设用地面积比例、电量消耗5个指标表征人类活动强度,分析关中地区人类活动强度与地表温度时空变化规律,探究人类活动强度与地表温度关联性及其驱动作用。结果表明:(1) 2001—2020年关中地区平均地表高温、低温区域分别呈现总体增大、减少的趋势,地表高温区域范围不断扩大。(2) 2000—2020年关中地区的人类活动强度逐渐增加,特别是在各地级市的市辖区和主要居民点,高强度区域范围不断扩大,而低强度区域主要位于秦岭山区。(3) 2000—2020年关中地区人类活动强度与地表温度呈显著正相关性和空间上的集聚性,正相关区域面积呈现增大趋势,主要由不显著及负相关转化为正相关区域,高-高类型集聚区主要分布在各城市主城区,低-低类型集聚区主要分布在秦岭山区。(4) 影响地表温度的人类活动强度指标中,夜间灯光强度、人口密度、建设用地面积比例对地表温度的驱动作用最为显著;且夜间灯光强度与建设用地面积比例、人口密度与建设用地面积比例交互作用对地表温度的解释力最强。
纪王迪 , 黄晓军 , 包微 , 马耀壮 . 关中地区人类活动强度与地表温度的时空关联特征及其驱动作用[J]. 干旱区地理, 2024 , 47(6) : 967 -979 . DOI: 10.12118/j.issn.1000-6060.2023.266
The accelerating role of human activities in the rise of global temperature has become increasingly evident. The scientific measurement of human activity intensity and the exploration of its spatiotemporal correlation with surface temperature has become a hot topic in research. Taking the Guanzhong area as an example, we integrate five indicators(population density, regional gross domestic product, nighttime light intensity, proportion of construction land area, and electricity consumption) to analyze spatiotemporal variations in human activity intensity and surface temperature. Furthermore, we explore the correlation and driving forces between human activity intensity and surface temperature. The results show that: (1) From 2001 to 2020, the average surface high and low temperature areas in the Guanzhong area demonstrated overall increasing and decreasing trends, respectively, with the scope of the surface high temperature areas continuously expanding. (2) The human activity intensity in the Guanzhong area gradually increased from 2000 to 2020, especially in downtown districts and major residential areas of prefecture-level cities. High-intensity areas continued to expand, while low-intensity areas were mainly located in the Qinling Mountains. (3) From 2000 to 2020, the human activity intensity in the Guanzhong area showed a significant positive correlation and spatial agglomeration with surface temperature. The area of positive correlation areas shows an increasing trend, mainly transforming from insignificant and negative correlations to positive correlation areas, with high-high type agglomeration areas primarily distributed in the main urban areas of cities, while low-low type agglomeration areas are mainly found in the Qinling Mountains. (4) Nighttime light intensity, population density, and the proportion of construction land area were identified as the most significant indicators of human activity intensity influencing surface temperature. Moreover, the explanatory power is most substantial for the interaction between nighttime light intensity and the proportion of construction land area as well as the interaction between population density and the proportion of construction land area.
表1 双因子交互作用类型Tab. 1 Types of two-factor interaction |
| 判断依据 | 交互作用类型 |
|---|---|
| q(X1∩X2)<Min[q(X1),q(X2)] | 非线性减弱 |
| Min[q(X1),q(X2)]<q(X1∩X2)<Max[q(X1),q(X2)] | 单因子非线性减弱 |
| q(X1∩X2)>Max[q(X1),q(X2)] | 双因子增强 |
| q(X1∩X2)=q(X1)+q(X2) | 独立 |
| q(X1∩X2)>q(X1)+q(X2) | 非线性增强 |
注:q为影响程度;X1、X2为影响因子。 |
表2 数据类型及其来源Tab. 2 Data types and sources |
| 数据名称 | 分辨率 | 年份 | 数据来源 |
|---|---|---|---|
| 地表温度(LST) | 1 km | 2001、2005、2010、2015、2020 | https://www.resdc.cn/ |
| 人口密度(POP) | 1 km | 2000、2005、2010、2015、2019 | https://www.resdc.cn/ |
| 地区生产总值(GDP) | 1 km | 2000、2005、2010、2015、2019 | https://www.resdc.cn/ |
| 夜间灯光强度(NL) | 1 km | 2000、2005、2010、2015、2020 | https://dataverse.harvard.edu/dataset.xhtml?persistentId=doi:10.7910/DVN/GIYGJ |
| 电量消耗(EC) | 1 km | 2000、2005、2010、2015、2019 | https://doi.org/10.6084/m9.figshare.17004523.v1 |
| 建设用地面积比例(CLAP) | 30 m | 2000、2005、2010、2015、2020 | https://www.resdc.cn/ |
表3 关中地区不同温度区间面积占比Tab. 3 Proportion of different temperature ranges in the Guanzhong area /% |
| 年份 | 面积占比 | ||||
|---|---|---|---|---|---|
| ≤13.06 ℃ | 13.07~16.31 ℃ | 16.32~18.93 ℃ | 18.94~21.23 ℃ | ≥21.24 ℃ | |
| 2001 | 5.85 | 14.12 | 24.06 | 31.99 | 23.99 |
| 2005 | 7.27 | 16.08 | 26.88 | 28.50 | 21.27 |
| 2010 | 6.06 | 17.58 | 28.56 | 26.01 | 21.79 |
| 2015 | 5.69 | 19.48 | 32.32 | 19.40 | 23.11 |
| 2020 | 5.12 | 14.80 | 27.68 | 21.61 | 30.78 |
图3 2000—2020年人类活动强度空间分布变化Fig. 3 Spatial distribution changes of human activity intensity from 2000 to 2020 |
表4 不同人类活动强度等级区间面积占比Tab. 4 Proportion of different human activity intensity levels /% |
| 年份 | 面积占比 | ||||
|---|---|---|---|---|---|
| ≤0.02 | 0.03~0.06 | 0.07~0.16 | 0.17~0.34 | ≥0.35 | |
| 2000 | 80.55 | 13.10 | 4.81 | 1.09 | 0.46 |
| 2005 | 78.73 | 12.99 | 5.62 | 1.80 | 0.86 |
| 2010 | 74.92 | 13.53 | 7.10 | 3.25 | 2.20 |
| 2015 | 78.65 | 8.70 | 7.21 | 3.25 | 2.20 |
| 2020 | 74.67 | 11.25 | 7.61 | 3.70 | 2.77 |
表5 影响地表温度的人类活动强度指标因素因子探测Tab. 5 Exploration of factors influencing surface temperature in relation to human activity intensity indicators |
| 驱动因素 | 影响程度 | ||||
|---|---|---|---|---|---|
| 2000年 | 2005年 | 2010年 | 2015年 | 2020年 | |
| 人口密度(POP) | 0.2140*** | 0.2936*** | 0.3129*** | 0.2755*** | 0.2436*** |
| 地区生产总值(GDP) | 0.1121*** | 0.1035*** | 0.1183*** | 0.0515*** | 0.0635*** |
| 夜间灯光强度(NL) | 0.2330*** | 0.3789*** | 0.3639*** | 0.1768*** | 0.2616*** |
| 电量消耗(EC) | 0.0547*** | 0.1002*** | 0.0920*** | 0.1151*** | 0.1363*** |
| 建设用地面积比例(CLAP) | 0.1487*** | 0.2367*** | 0.2120*** | 0.2415*** | 0.2757*** |
注:***表示在1%水平显著。 |
| [1] |
胡婷, 孙颖. IPCC AR6报告解读: 人类活动对气候系统的影响[J]. 气候变化研究进展, 2021, 17(6): 644-651.
[
|
| [2] |
孙颖. 人类活动对气候系统的影响——解读IPCC第六次评估报告第一工作组报告第三章[J]. 大气科学学报, 2021, 44(5): 654-657.
[
|
| [3] |
IPCC. Climate change 2022: Mitigation of climate change[R]. Cambridge: Cambridge University Press, 2022.
|
| [4] |
WMO. WMO statement on the state of the global climate in 2019[EB/OL]. http://library.wmo.int/index.php?lvl=notice_display&id=21700.
|
| [5] |
秦大河, 张建云, 闪淳昌, 等. 中国极端天与气候事件和灾害风险管理与适应国家评估报告[M]. 北京: 科学出版社, 2015: 1-17.
[
|
| [6] |
孙邵, 李多, 王遵娅, 等. 2018年全球重大天气气候事件及其成因[J]. 气象, 2019, 45(4): 533-542.
[
|
| [7] |
赵宗慈, 罗勇, 黄建斌. 回顾IPCC 30年(1988—2018年)[J]. 气候变化研究进展, 2018, 14(5): 540-546.
[
|
| [8] |
梁媚聪, 秦圆圆, 樊星, 等. IPCC第六次评估报告第三工作组报告主要结论解读及对策建议[J]. 环境保护, 2022, 50(13): 72-76.
[
|
| [9] |
韩冬锐, 徐新良, 李静, 等. 长江三角洲城市群热环境安全格局及土地利用变化影响研究[J]. 地球信息科学学报, 2017, 19(1): 39-49.
[
|
| [10] |
沈中健, 曾坚. 闽南三市城镇发展与地表温度的空间关系[J]. 地理学报, 2021, 76(3): 566-583.
[
|
| [11] |
梁洪武, 阿里木江·卡斯木, 张雪玲, 等. 干旱区绿洲城市群地表温度时空变化及其影响因素——以天山北坡城市群为例[J]. 生态学报, 2023, 43(9): 3650-3664.
[
|
| [12] |
|
| [13] |
张雪玲, 阿里木江·卡斯木, 梁洪武. 石河子绿洲地表温度时空变化与城镇发展协调性分析[J]. 生态与农村环境学报, 2023, 39(3): 324-334.
[
|
| [14] |
|
| [15] |
|
| [16] |
|
| [17] |
黄晓军, 宋涛, 王博, 等. 土地利用规模-结构-形态演变对城市热环境的影响——以西安市主城区为例[J]. 地理科学, 2022, 42(5): 926-937.
[
|
| [18] |
康利刚, 曹生奎, 曹广超, 等. 青海湖流域地表温度时空变化特征研究[J]. 干旱区地理, 2023, 46(7): 1084-1097.
[
|
| [19] |
刘宇, 匡耀求, 吴志峰, 等. 不同土地利用类型对城市地表温度的影响——以广东东莞为例[J]. 地理科学, 2006, 26(5): 5597-5602.
[
|
| [20] |
钱乐祥, 丁圣彦. 珠江三角洲土地覆盖变化对地表温度的影响[J]. 地理学报, 2005, 60(5): 761-770.
[
|
| [21] |
苏伟忠, 杨英宝, 杨桂山. 南京市热场分布特征及其与土地利用/覆被关系研究[J]. 地理科学, 2005, 25(6): 6697-6703.
[
|
| [22] |
罗瑶, 彭文甫, 董永波, 等. 基于地理探测器下的川西高原地表温度空间格局及影响因子分析——以西昌市为例[J]. 干旱区地理, 2020, 43(3): 738-749.
[
|
| [23] |
陈泓瑾, 刘琳, 张正勇, 等. 天山北坡人类活动强度与地表温度的时空关联性[J]. 地理学报, 2022, 77(5): 1244-1259.
[
|
| [24] |
乔治, 贺曈, 卢应爽, 等. 全球气候变化背景下基于土地利用的人类活动对城市热环境变化归因分析——以京津冀城市群为例[J]. 地理研究, 2022, 41(7): 1932-1947.
[
|
| [25] |
|
| [26] |
田浩, 刘琳, 张正勇, 等. 2001—2020年中国地表温度时空分异及归因分析[J]. 地理学报, 2022, 77(7): 1713-1729.
[
|
| [27] |
李海军, 高煜, 高鹏. 结合地理探测器的长沙市区地表温度驱动力探究[J]. 测绘与空间地理信息, 2022, 45(11): 78-81, 86.
[
|
| [28] |
武蓉蓉, 谢苗苗, 刘琦, 等. 大都市功能区块视角下的热岛影响因素空间分异[J]. 资源科学, 2020, 42(12): 2463-2474.
[
|
| [29] |
乔治, 黄宁钰, 徐新良, 等. 2003—2017年北京市地表热力景观时空分异特征及演变规律[J]. 地理学报, 2019, 74(3): 475-489.
[
|
| [30] |
文英. 人类活动强度定量评价方法的初步探讨[J]. 科学与社会, 1998(4): 56-61.
[
|
| [31] |
郑文武, 邹君, 田亚平, 等. 基于RS和GIS的区域人类活动强度空间模拟[J]. 热带地理, 2011, 31(1): 77-81.
[
|
| [32] |
王鹤饶, 郑新奇, 袁涛. DMSP/OLS数据应用研究综述[J]. 地理科学进展, 2012, 31(1): 11-19.
[
|
| [33] |
|
| [34] |
冯志贤, 张继贤, 侯伟, 等. 基于地表覆盖分类的生态环境人为干扰度分析——以北京市为例[J]. 生态学杂志, 2017, 36(2): 508-516.
[
|
| [35] |
黄创绵, 蔡汝山. 单因素方差分析方法在环境试验中的应用[J]. 电子产品可靠性与环境试验, 2010, 28(6): 21-26.
[
|
| [36] |
王劲峰, 徐成东. 地理探测器: 原理与展望[J]. 地理学报, 2017, 72(1): 116-134.
[
|
| [37] |
徐新良. 中国地表温度LST年度1 KM数据集[DB/OL]. [2023-02-19]. 中国科学院资源环境科学数据中心数据注册与出版系统. https://www.resdc.cn/DOI/DOI.aspx?DOIID=98.
[
|
| [38] |
徐新良. 中国人口空间分布公里网格数据集[DB/OL]. [2023-02-20]. 中国科学院资源环境科学数据中心数据注册与出版系统. https://www.resdc.cn/DOI/DOI.aspx?DOIID=32.
[
|
| [39] |
徐新良. 中国GDP空间分布公里网格数据集[DB/OL]. [2023-02-21]. 中国科学院资源环境科学数据中心数据注册与出版系统. https://www.resdc.cn/DOI/DOI.aspx?DOIID=33.
[
|
| [40] |
|
| [41] |
|
| [42] |
徐新良, 刘纪远, 张树文, 等. 中国多时期土地利用土地覆被遥感监测数据集(CNLUCC)[DB/OL]. [2023-02-20]. 中国科学院资源环境科学数据中心数据注册与出版系统. https://www.resdc.cn/DOI/DOI.aspx?DOIID=54.
[
|
| [43] |
韩贵锋, 赵珂, 颜文涛, 等. 快速城市化山地城市地表温度的多维梯度——以重庆市主城区为例[J]. 应用生态学报, 2012, 23(6): 1655-1662.
[
|
| [44] |
杨智威, 陈颖彪, 吴志峰, 等. 粤港澳大湾区城市热岛空间格局及影响因子多元建模[J]. 资源科学, 2019, 41(6): 1154-1166.
[
|
| [45] |
王莹书, 石培基, 赵武生, 等. 兰州市热环境时空特征及影响因素研究[J]. 生态科学, 2022, 41(2): 59-65.
[
|
/
| 〈 |
|
〉 |