
庆阳市空气污染及气象因子影响特征分析
|
焦美玲(1974-),女,高级工程师,主要从事应用气象服务和气候变化等方面的研究. E-mail: jml_920@163.com |
收稿日期: 2023-06-21
修回日期: 2023-09-04
网络出版日期: 2026-03-11
基金资助
甘肃省气象局科研项目(ZcMs2022-33)
庆阳市科技计划项目(QY-STK-2022A-129)
庆阳市气象局科技项目(QY2019-3)
Characteristics of air pollution and meteorological factors in Qingyang City
Received date: 2023-06-21
Revised date: 2023-09-04
Online published: 2026-03-11
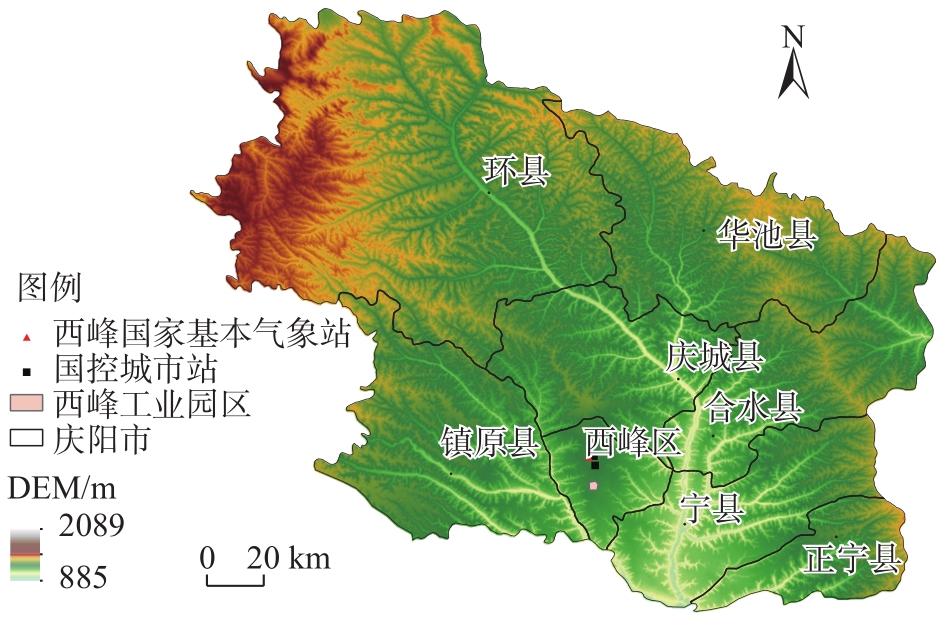
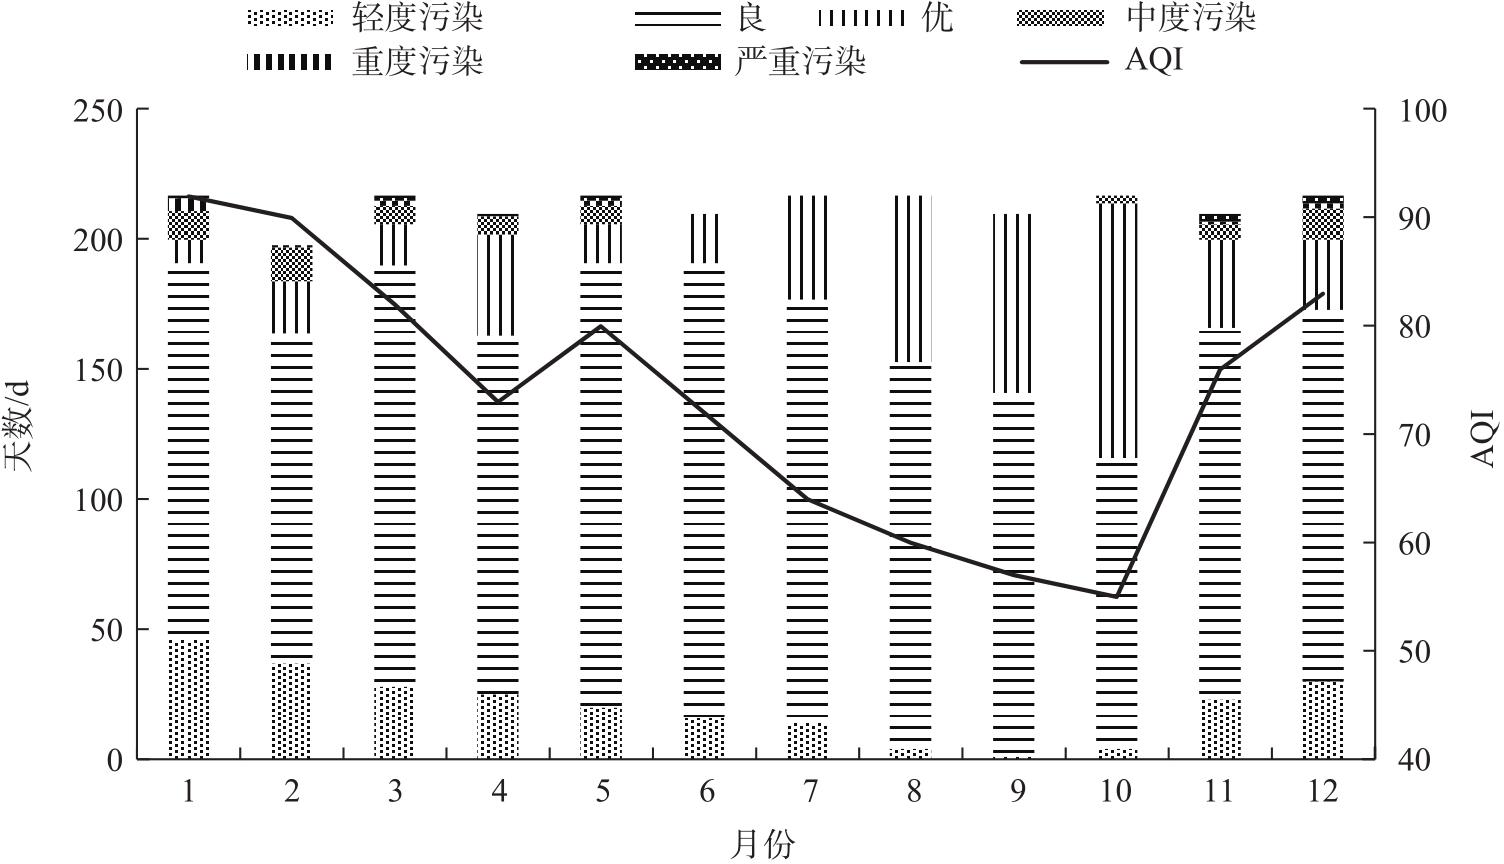
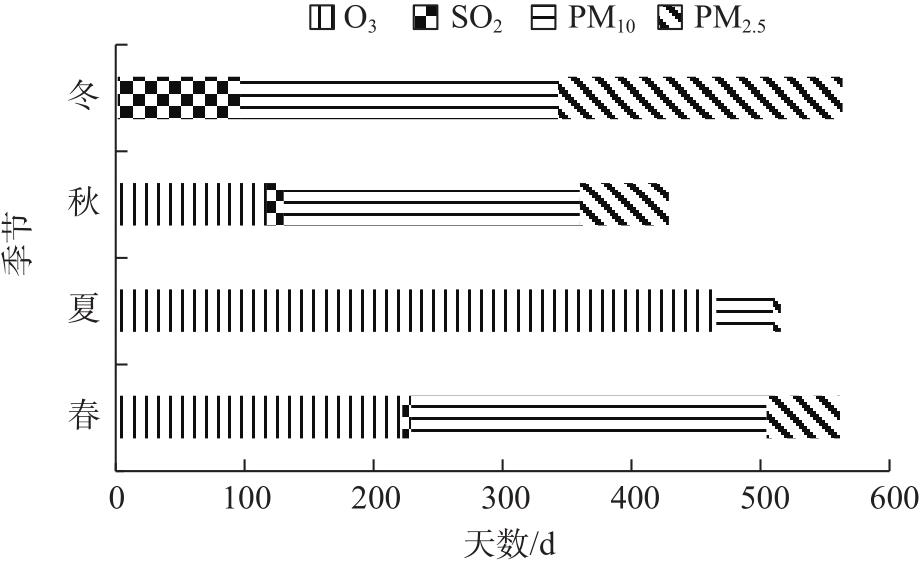
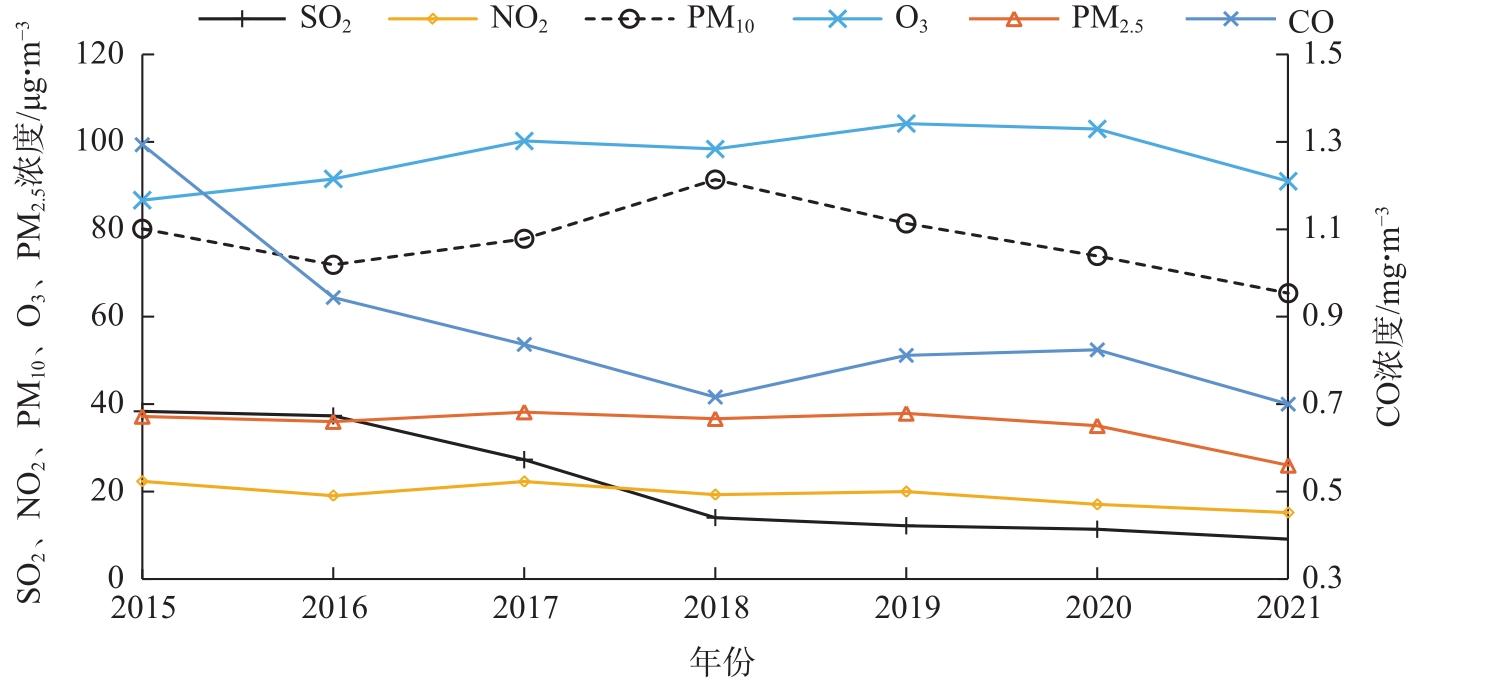
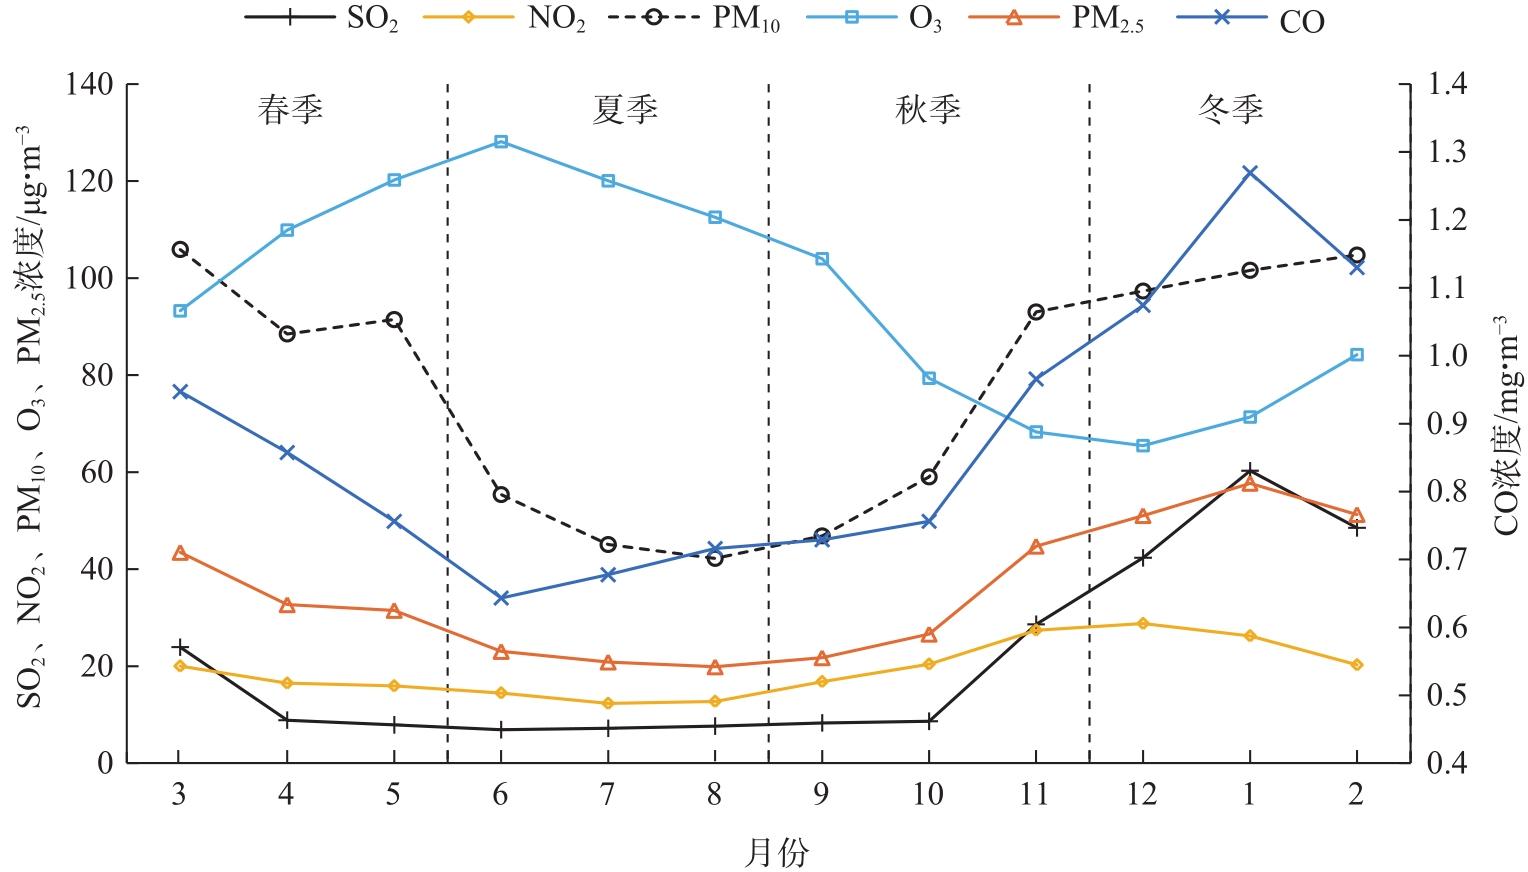
基于2015—2021年庆阳市空气污染和气象数据,利用变率统计分析庆阳市空气质量指数、首要污染物及其浓度变化特征,运用气候相似性原理和多因子综合评价并探究气象因子对污染物的作用与影响,并确立响应指标,为全市精准开展大气污染防治提供支撑。结果表明:(1) 庆阳市空气质量优良率86.6%,空气质量指数年均为73,呈不明显上升趋势。首要污染物主要为PM10、PM2.5和O3 3种,且季节特征明显。2017年后SO2污染明显改善,但颗粒物与O3并发的复合型污染凸显,与当地气候、污染排放源有密切关系。(2) O3浓度夜间维持较高位,且以1.5 μg·m-3·a-1的年速率上升,气温对O3正效应显著,初夏气温高,降水量少是O3浓度升高和超标的主要驱动因子。(3) 外源输送和供暖期本地排放造成秋末—冬春季的PM10和PM2.5超标。(4) PM10、PM2.5和O3超标日下的主要气象因子阈值特征不同。
焦美玲 , 韩晶 , 曹彦超 , 王娟 , 秦拓 , 贺涛 . 庆阳市空气污染及气象因子影响特征分析[J]. 干旱区地理, 2024 , 47(6) : 932 -941 . DOI: 10.12118/j.issn.1000-6060.2023.302
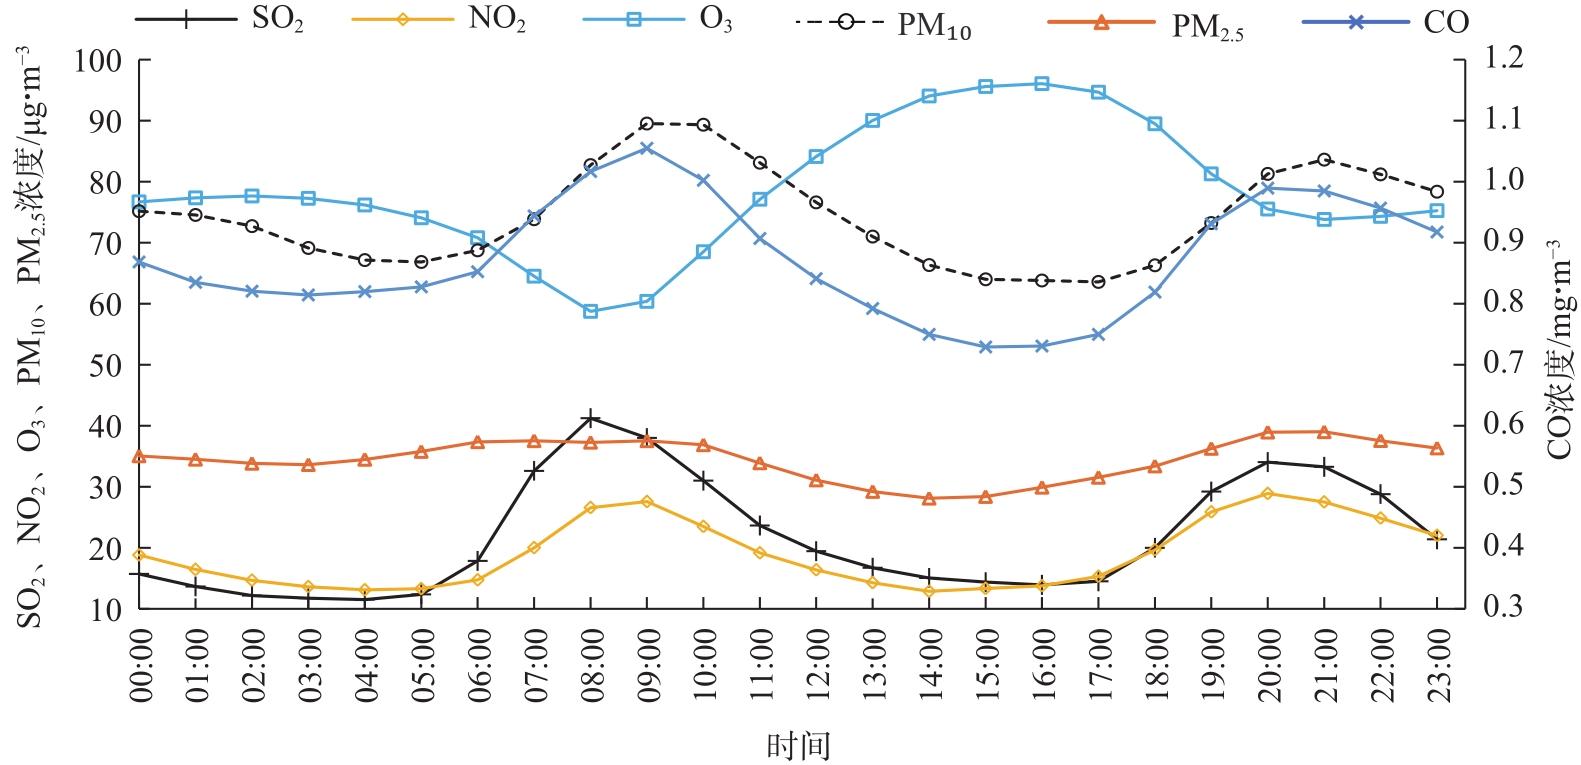
Based on air pollution and meteorological data (2015—2021) from Qingyang City, Gansu Province, China, this study employed mathematical statistics and Pearson correlation analysis to examine AQI, primary pollutants, and their concentration changes. It aims to explore the influence of meteorological factors on pollution levels and establish response indicators to aid the prevention and control of air pollution in the area. Results indicate that Qingyang City predominantly experiences excellent air quality, with distinct seasonal variations in AQI. The best air quality occurs from mid-summer to mid-autumn, followed by spring, and deteriorates significantly in winter. The primary pollutants identified are O3, PM10, and PM2.5, with O3 peaking in summer, and a combination of PM10, O3 and PM2.5 in spring and autumn. Winter and the heating season primarily feature PM10 and PM2.5. A complex interplay between particulate matter and O3 is evident. Annually, concentrations of SO2, NO2, CO, PM2.5, and PM10 demonstrate a declining trend, whereas O3 shows an average increase of 1.5 µg·m-3·a-1. Monthly and seasonal concentration fluctuations are significant, with elevated levels of PM10 and PM2.5 in winter and spring, and the highest O3 concentrations in June. Moderate or severe pollution episodes predominantly occur from late autumn to winter and spring, driven by local climate conditions and pollution sources. Temperature significantly enhances O3 concentrations, with high temperatures in early summer and low precipitation serving as primary contributors. External transport and local emissions during the heating season lead to exceedances in PM10 and PM2.5 standards. Daily O3 variations display a unimodal pattern, without significant nighttime decreases. Conversely, other pollutants exhibit a bimodal daily pattern, with peaks around 04:00 and 15:00, and elevated levels at 20:00 and 09:00. Exceedance days for PM10, PM2.5, and O3 typically coincide with dry conditions or precipitation less than 3 mm. Meteorological factors such as air pressure, temperature, humidity, maximum wind speed, and wind direction show marked variations on these days. The periods with the highest frequency of PM10 exceedances span from March to April, PM2.5 from December to January of the following year, and O3 from June to July. For PM10, the exceedance thresholds include temperatures of 10-20 ℃, humidity levels of 20%-50%, air pressure between 850-863 hPa, and maximum wind speeds of 4 m·s-1 or above, predominantly with NW winds. PM2.5 exceedances occur at temperatures of -5-3 ℃, humidity of 40%-80%, air pressure between 854-867 hPa, and maximum wind speeds of 2-6 m·s-1, with SW and S winds. O3 exceedances are noted at temperatures of 19-26 ℃, humidity of 25%-60%, air pressure between 851-858 hPa, and maximum wind speeds of 3-5 m·s-1, under S and SW winds.
表1 AQI指数分级标准Tab. 1 AQI index grading standards |
| 污染级别 | AQI指数范围 |
|---|---|
| 优 | 0~50 |
| 良 | 51~100 |
| 轻度污染 | 101~150 |
| 中度污染 | 151~200 |
| 重度污染 | 201~300 |
| 严重污染 | >300 |
注:AQI为空气质量指数。下同。 |
表2 污染物浓度限值国家标准(二类区二级)Tab. 2 National standard for pollutant concentration limits (class II, zone II) |
| 污染物 | 浓度限值 | |
|---|---|---|
| 24 h平均 | 年平均 | |
| SO2/μg·m-3 | 150 | 60 |
| NO2/μg·m-3 | 80 | 40 |
| PM10/μg·m-3 | 150 | 70 |
| PM2.5/μg·m-3 | 75 | 35 |
| O3/μg·m-3 | 160 | - |
| CO/mg·m-3 | 4 | - |
注:“-”表示未确定限值。 |
表3 庆阳市AQI分级年日数及达标率Tab. 3 Annual days and compliance rates of AQI classification in Qingyang City |
| 年份 | 空气质量级别/d | AQI 达标率/% | |||||
|---|---|---|---|---|---|---|---|
| 优 | 良 | 轻度污染 | 中度污染 | 重度污染 | 严重污染 | ||
| 2015 | 86 | 210 | 58 | 9 | 1 | 1 | 80.9 |
| 2016 | 56 | 266 | 30 | 11 | 2 | 1 | 88.0 |
| 2017 | 43 | 275 | 29 | 12 | 3 | 2 | 87.1 |
| 2018 | 56 | 265 | 29 | 8 | 3 | 4 | 87.9 |
| 2019 | 35 | 272 | 40 | 14 | 2 | 2 | 84.9 |
| 2020 | 55 | 257 | 49 | 4 | 1 | 0 | 85.2 |
| 2021 | 89 | 249 | 16 | 8 | 1 | 2 | 92.6 |
| 平均 | 62 | 254 | 36 | 9 | 2 | 2 | 86.6 |
表4 庆阳市6项空气污染物与气象因子相关性Tab. 4 Correlation between six air pollutants and meteorological factors in Qingyang City |
| 污染物 | 气压 | 降水量 | 气温 | 相对湿度 | 日照时数 | 最大风速 |
|---|---|---|---|---|---|---|
| SO2 | 0.430** | -0.391** | -0.584** | -0.301** | -0.039 | 0.263* |
| NO2 | 0.676** | -0.553** | -0.708** | -0.254* | -0.203 | 0.378** |
| PM10 | 0.417** | -0.624** | -0.624** | -0.567** | 0.068 | 0.454** |
| CO | 0.402** | -0.370** | -0.558** | -0.200 | -0.110 | 0.295** |
| O3 | -0.821** | -0.412** | 0.818** | -0.060 | 0.491** | -0.318** |
| PM2.5 | 0.570** | -0.671** | -0.791** | -0.445** | -0.100 | 0.374** |
注:**表示在0.01级别(双尾),显著相关;*表示在0.05级别(双尾),显著相关。 |
表5 PM10、PM2.5和O3不同浓度级别下的气象要素日均值Tab. 5 Daily mean of meteorological elements at different concentration levels of PM10, PM2.5 and O3 |
| 污染物 | 时段 | 气象要素 | |||||||
|---|---|---|---|---|---|---|---|---|---|
| 气压/hPa | 气温/℃ | 相对湿度/% | 最大风速/m·s-1 | 主要风向(频率/%) | 分量风向(频率/%) | ||||
| PM10 | 3—4月超标日 | 856.4 | 10.8 | 44 | 5.6 | N(61) | N(25) | NW(34) | NE(2) |
| 3—4月达标日 | 858.4 | 9.2 | 53 | 4.4 | S(45) | S(21) | SE(11) | SW(13) | |
| 11月—翌年5月超标日 | 858.7 | 6.2 | 48 | 5.1 | N(46) | N(20) | NW(25) | NE(1) | |
| 11月—翌年5月达标日 | 860.4 | 5.0 | 52 | 4.2 | S(40) | S(15) | SE(10) | SW(15) | |
| PM2.5 | 12月—翌年1月超标日 | 860.9 | -1.1 | 61 | 3.7 | S(50) | S(19) | SE(14) | SW(17) |
| 12月—翌年1月达标日 | 863.5 | -2.4 | 47 | 4.0 | N(40) | N(13) | NW(20) | NE(7) | |
| 11月—翌年5月超标日 | 857.8 | 5.2 | 60 | 4.1 | S(55) | S(20) | SE(17) | SW(18) | |
| 11月—翌年5月达标日 | 860.5 | 5.0 | 50 | 4.3 | N(40) | N(13) | NW(22) | NE(5) | |
| O3 | 6—7月超标日 | 852.1 | 23.5 | 49 | 4.2 | S(86) | S(37) | SE(13) | SW(36) |
| 6—7月达标日 | 852.9 | 21.2 | 64 | 4.4 | S(60) | S(25) | SE(13) | SW(22) | |
| 4—8月超标日 | 852.6 | 22.7 | 43 | 4.3 | S(81) | S(31) | SE(17) | SW(33) | |
| 4—8月达标日 | 854.8 | 18.4 | 60 | 4.6 | S(51) | S(24) | SE(10) | SW(17) | |
表6 PM10、PM2.5和O3日浓度超标下的气象指标Tab. 6 Meteorological indicators for exceeding daily concentrations of PM10, PM2.5 and O3 |
| 污染物 | 气温 /℃ | 相对湿度 /% | 气压 /hPa | 最大风速 /m·s-1 | 盛行风向 /分量风向 |
|---|---|---|---|---|---|
| PM10 | 10~20 | 20~50 | 850~863 | ≥4 | N/NW |
| PM2.5 | -5~3 | 40~80 | 854~867 | 2~6 | S/SW |
| O3 | 19~26 | 25~60 | 851~858 | 3~5 | S/SW |
| [1] |
李惠娟, 周德群, 魏永杰. 我国城市PM2.5污染的健康风险及经济损失评价[J]. 环境科学, 2018, 39(8): 3467-3475.
[
|
| [2] |
|
| [3] |
WHO. Ambient air pollution: A global assessment of exposure and burden of disease[Z]. Geneva, Switzerland: World Health Organization, 2016: 44.
|
| [4] |
|
| [5] |
|
| [6] |
王冠岚, 薛建军, 张建忠. 2014年京津冀空气污染时空分布特征及主要成因分析[J]. 气象与环境科学, 2016, 39(1): 34-42.
[
|
| [7] |
佘倩楠, 徐茜, 周陶冶, 等. 长三角地区2015年大气重污染特征及其影响因素[J]. 环境科学学报, 2018, 38(8): 3185-3196.
[
|
| [8] |
赖安琪, 陈晓阳, 刘一鸣, 等. 珠江三角洲高质量浓度PM2.5和O3复合污染特征[J]. 中山大学学报(自然科学版), 2018, 57(4): 30-36.
[
|
| [9] |
郑小华, 李明星, 刘慧, 等. 汾渭平原空气质量的时空特征及其与气象因子的关系[J]. 环境科学学报, 2020, 40(11): 4113-4121.
[
|
| [10] |
|
| [11] |
|
| [12] |
董建红, 张志斌, 刘奔腾, 等. “三生”空间视角下西北地区生态环境质量分异机制的地理探测[J]. 干旱区地理, 2023, 46(4): 515-526.
[
|
| [13] |
罗逸臻, 黄远程, 王涛. 关中平原城市群生态环境质量时空变化特征及其驱动力[J]. 地球科学与环境学报, 2023, 45(6): 1316-1329.
[
|
| [14] |
李淑婷, 李霞, 毛列尼·阿依提看, 等. 2017—2019年中天山北坡城市群大气污染及污染天气类型特征[J]. 干旱区地理, 2022, 45(4): 1082-1092.
[
|
| [15] |
张小娟, 李莉, 王红丽, 等. 2010—2016年上海城区臭氧长时间序列变化特征初探[J]. 环境科学学报, 2019, 39(1): 86-94.
[
|
| [16] |
臧星华, 鲁垠涛, 姚宏, 等. 中国主要大气污染物的时空分布特征研究[J]. 生态环境学报, 2015, 24(8): 1322-1329.
[
|
| [17] |
王磊, 刘端阳, 韩桂荣, 等. 南京地区近地面臭氧浓度与气象条件关系研究[J]. 环境科学学报, 2018, 38(4): 1285-1296.
[
|
| [18] |
|
| [19] |
|
| [20] |
齐冰, 牛彧文, 杜荣光, 等. 杭州市近地面大气臭氧浓度变化特征分析[J]. 中国环境科学, 2017, 37(2): 443-451.
[
|
| [21] |
杨婧, 朱海斌, 刘建军, 等. 气象条件对银川市区近地面臭氧质量浓度的影响[J]. 干旱气象, 2021, 39(2):302-308, 325.
[
|
| [22] |
刘超, 董俊玲, 田力, 等. 2017年郑州市臭氧浓度特征及气象因素分析[J]. 气象与环境科学, 2022, 45(4): 33-38.
[
|
| [23] |
岳岩裕, 吴翠红, 许可, 等. 武汉城市圈臭氧污染特征及气象因子影响分析[J]. 气象与环境科学, 2021, 44(3): 16-23.
[
|
| [24] |
吕长春. 自贡市臭氧浓度变化特征及其与气象因素的相关性研究[J]. 气象与环境科学, 2021, 44(3): 47-53.
[
|
| [25] |
李伟杰, 赵胡笳, 陈权亮, 等. 2020年1—3月四川地区大气污染物变化特征分析[J]. 气象与环境学报, 2022, 38(1): 15-22.
[
|
| [26] |
郭安可, 殷小鸽, 王治民, 等. 工业园区大气污染过程与气象风场响应关系研究[J]. 气象与环境学报, 2022, 38(1): 23-32.
[
|
| [27] |
杨宇, 何唯, 李鹏, 等. 中国城市化与PM2.5浓度时空动态及作用机理——基于胡焕庸线变迁的视角[J]. 资源科学, 2022, 44(10): 2100-2113.
[
|
/
| 〈 |
|
〉 |